Original papers
IDENTIFICATION OF PHASE COMPOSITION OF BINDERS
FROM ALKALI-ACTIVATED MIXTURES OF GRANULATED
BLAST FURNACE SLAG AND FLY ASH
#JOZEF VLČEK*, LUCIE DRONGOVÁ*, MICHAELA TOPINKOVÁ*, VLASTIMIL MATĚJKA**, JANA KUKUTSCHOVÁ**, MARTIN VAVRO***, VÁCLAVA TOMKOVÁ*
* Institute of Industrial Ceramics, Faculty of Metallurgy and Material Engineering, VŠB-Technical University of Ostrava, 17. listopadu 15, 708 33, Ostrava-Poruba, Czech Republic
** Nanotechnology Centre, VŠB-Technical University of Ostrava, 17. listopadu 15, 708 33, Ostrava-Poruba, Czech Republic
*** Department of Geomechanics and Mining Research,
Institute of Geonics AS CR, v.v.i., Studentská 1768, 708 00, Ostrava-Poruba, Czech Republic
#E-mail: [email protected]
Submitted September 17, 2013; accepted January 16, 2014
Keywords: Binders, Alkali activation, Hydration products
The prepared alkali-activated binders (AAB) and composites using suitable latent hydraulic raw materials represent an alternative to materials based on Portland cements. This paper deals with ways how to inluence the functional parameters of AAB by setting up mixtures of granulated blast furnace slag (GBFS) and ly ash with selected chemical compositions. In this way the course of hydration process is modiied and the phase composition of products of alkali activation is changed as well as their inal properties. The amorphous character of the hydration products makes evaluation of the phase composition of hardened AAB dificult and signiicantly limits the number of experimental techniques suitable to characterise their phase composition. It was observed that measuring the pH of water extracts obtained from the alkali-activated mixtures can give supplementary information about the process of hardening of alkali-activated mixtures of GBFS and ly ash.
INTRODUCTION
In recent years serious efforts have been made to substitute traditional building materials based on Portland cements with alternative latent hydraulic materials or pozzolans. Latent hydraulic materials (LHM) are agents whose binding properties can be evoked by a process of alkali activation. The products of alkali activation of LHM are inorganic polymers with binding properties that are evoked by the effect of aqueous solutions of alkali (primarily sodium) compounds. Generally LHM materials are substances with a major content of SiO2, Al2O3 and CaO, showing a non-crystalline amorphous structure. Some natural systems, e.g. tuffs, trasses or diatomite and other natural raw materials after thermal treatment (burnt clays, bauxites, shales etc.) can also be alkali-activated. The main prerequisite for materials having pozzolanic properties is an amorphous structure and suitable content of SiO2, Al2O3 and CaO. Pozzolanic character also shows in some high-volume secondary products originating during processes in metallurgy, energetics or the chemical industry. Synthetic materials
with latent hydraulic properties belong to the category of technogenic pozzolans and comprise different slags, ly ashes or lue dust representing valuable materials from both the economic and ecological point of view.
During the alkali activation process several simul- taneous and consecutive chemical and physical trans-formations of the raw materials lead to the formation of a hardened resulting composite showing improved strength and other advanced properties. The course of the alkali activation process as well as the inal products has been described in different ways by many authors [1]. All of the chemical reactions and transformations of the raw materials proceed with different rates depending on the properties of the initial materials as well as the conditions during activation. The alkali activation pro-cess is signiicantly inluenced by the chemical and phase composition of the raw materials, their grain size and speciic surface area, as well as properties of the activator used (chemical nature, concentration), the mixing process during homogenization of the alkali-activated mixture, temperature and conditions during hydration of the hardened mixtures and so forth [1-9].
The process of alkali activation can be briely summarized as follows: the alkali solution attacks the disordered structure of the latent hydraulic material, breaks up the existing bonds and transfers ion fragments into solution. Out of these processes new hydrates are formed, which intergrow reciprocally until the resulting system gradually sets and hardens. Strictly speaking, two types of hydraulic products are formed, based on the chemical composition of the initial raw materials: ● Calcium silicate hydrates, C–S–H phases. Their ibrous
structure, such as during the hydration of Portland cements, assures the strength of the hardened material. ● Aluminosilicate hydrates, which often also consist
of alkali ions, i.e. N(C)–A–S–H phase. According to Davidovits [10, 11], these products of alkali activation can be considered chemically as “polysialates” or “sili-cooxoaluminates”, for which Davidovits introduced the term “geopolymers”. Their chemical composition and structure is close to that of zeolites and represents the precursors of zeolites.
In the course of activation process the alkali-acti-vated mixture consists of three different groups of cons-tituents:
1) unreacted raw materials, in which the major portion of the structure is amorphous and only a minor component is crystalline,
2) initial reaction products that for a long time are mainly of amorphous character with variable chemical com-position and heterogeneous microstructure,
3) inal products, showing crystalline structure with more or less constant composition and properties.
The greatest potential for preparation of binders based on alkali-activated materials in technical practise offers two secondary raw materials produced in high quantities and suficiently constant quality. These are granulated (quenched) blast furnace slag (GBFS) and power-station ly ash from the combustion of fossil fuels (ly ash class F).
In the 1960s, Gluchovski studied the process of alkali activation of GBFS and identiied calcium silicate hydrates and calcium and sodium aluminosilicate hyd-rates with structures close to those of zeolites as the products of this process [12, 13]. He also referred to 6 groups of alkali activators suitable for alkali activation [13]. Another signiicant step in the description of the alkali activation process occurred in 1978 in the works of J. Davidovits and his co-workers [10, 11], who studied the process of alkali activation of metakaolin and for the irst time termed this process “geopolymerization” and used the term “geopolymers” for the products of activation.
Nowadays, the term “alkali-activated binders” is used for systems originating during the complete trans-formation of latent hydraulic materials instead of
geopolymers, whereas the term “geopolymer” is used only for amorphous or semi-crystalline aluminosilicate hydrates which are precursors of zeolites [1, 3, 4].
A number of hydration products of different alkali activated latent hydraulic materials have been described by different authors. Criado et al. [7] studied the alkali activation of ly ashes and used X-ray diffraction (XRD) to identify hydroxysodalite and herschelite as the hydration products. According to Wang and Scrivener [6], C–S–H gel is the main product of alkali activation of GBFS if the pH of the mixture is high and thus favourable for low concentrations of calcium and high concentrations of silicon. Wang and Scrivener also described the formation of hydrotalcite if NaOH is used as an activator, either alone or mixed with a water glass.
Brough et al. [14] detected large amounts of zeolitic phases (hydroxysodalite, gismondine), which probably resulted from the high water/binder ratio (about 1), because an excess of water is decisive during the crys-tallization of N–A–S–H and N–C–A–S–H systems.
Puertas et al. [8] studied mixtures of GBFS and ly ash and mentioned that the main reaction product was C–S–H gel. Hydrotalcite (Mg6Al2CO3(OH)16·4H2O), pirs-sonite (Na2Ca(CO3)2·2H2O) and calcite CaCO3 were also formed but no alkali aluminosilicate phases were detected. Fernández-Jiménez and Palomo [9] studied the products of alkali activation of ly ashes using XRD. The authors found unreacted crystalline phases from ly ashes and hydroxysodalite (Na4Al3Si3O12OH), herschelite (NaAlSi2O6·3H2O) and aluminosilicate gel. Similarly, Xie and Xi [16] observed unreacted crystalline phases as the major crystalline constituents of hardened alkali-activated ly ash.
Brough and Atkinson [17] used XRD to study the products of alkali activation of GBFS. They did not ind any crystalline phases; however, using SEM the authors observed hydrotalcite after one month of hydration. Similarly, Song et al. [18] reported C-S-H gel and a small amount of hydrotalcite as the hydration products of alkali-activated GBFS. Puertas et al. [19] also observed calcite, instead of the products of GBFS alkali activation reported in [18].
In summary, the reaction products from alkali activation are dependent on the type of activator and the initial raw material. For substances with a prevalence of Si + Ca, C–S–H gel is the main product of hydration, whereas for systems comprised mostly of Si + Al, poly-mers comparable to zeolites are the main products of hydration [1, 3, 4, 20].
Next to XRD, infrared spectroscopy (IR) represents the next most valuable instrumental technique, which can supply researchers with information about the molecular structures of crystalline and amorphous substances. In general, IR spectroscopy is based on the interaction of infrared (IR) radiation (wavelength λ = 0.15 ~ 100 µm, i.e. with wavenumber ν̅ = 1/λ in the 12000 ~ 100 cm-1 region) with the studied sample. The most used is the mid-infrared region of IR radiation with ν̅ 4000 ~ 400 cm-1. The energy of the photons changes the vibrational states of the molecules, so the interaction of IR radiation with the sample causes periodical changes in the positions of the atoms in the molecules. If the interaction of infrared radiation with the sample changes the length of the bond, then a stretching vibration (marked as n) is observed, which can be either symmetric or asymmetric. In cases where the interaction is responsible for a change in bond angle, then a bending vibration (δ) occurs, which can be either in-plane or out-of-plane [21]. Phases with disordered structure – amorphous – show growth in the widths of IR bands observed in their IR spectra thanks to signiicant luctuation in bonds lengths and angles [22].
According to Lecomt [23], there are identical vibrations with peaks at 3440 cm-1 and 1650 cm-1 in binding systems based on Portland cement (PC) and also based on alkali-activated GBFS, which correspond to stretching and bending vibrations of O–H bonds in water molecules. Similar to PC, the vibrations of carbonate groups, with characteristic bands at 1450 cm-1 and 870 cm-1, can be observed in IR spectra of binders based on alkali-activated GBFS. The main region of stretching vibrations of [SiO4] tetrahedrons is broad in the case of alkali-activated GBFS, with the maximum centred at around 1000 cm-1, which also conirms the interconnection with [AlO4] tetrahedrons.
Palomo and colleagues [15] studied alkali activation of ly ash and observed using the FTIR technique that in the irst period of hydration process occurring at elevated temperature (65 ~ 85°C), Al-phases react irst, which is relected by the disappearance of vibrations with a maxi-mum centred around 800 cm-1 and the origination of new bands with maximum at approximately 700 cm-1. At the same time the main vibration belonging to Si–O and Al–O bands, which can be observed at 1060 cm-1 in the case of original ly ash, moves towards approxi-mately 1000 cm-1. This is caused by the formation of a structure in which (SiO4) groups are substituted for (AlO4) groups in the newly originating net. The difference in the charges is compensated for by alkali ions. Using XRD analysis the authors didn’t identify any new crystalline phase [15]. According to [25] the vibration interval 600 ~ 800 cm-1 corresponds to A–O–Si bonds, i.e. aluminosilicates. The authors of the study [26] mentioned that the original vibrations at 1088 cm-1 observed in IR spectra of initial ly ash shifted to 1029 cm-1, which may be due to the reorganization of glassy aluminosilicate phases. They explained this
fact by the reaction of amorphous phases of ly ash with activator and the formation of an amorphous gel.
Van Deventer et al. [20] used FTIR spectroscopy to study ly ash activation with NaOH solution and found that the original ly ash shows a relatively mild IR spectrum as a result of the presence of diverse crys-talline and amorphous phases, with a range of broad, overlapping bands in the same regions. An exception is a band at 1055 cm-1, corresponding to Si–O–T (T = Si or Al) bonds. According to these authors, the band at 1055 cm-1 does not completely disappear after geopolymer formation. The most obvious change in the hardened material structure is connected to the formation of a new band with maxima centred at 960 cm-1. This band is also ascribed to the presence of Si–O–T groups; nevertheless, its signiicant shift indicates extensive changes in bond arrangements. Creation of this new band in the spectrum is attributed to the newly formed geopolymer net.
In general it can be stated that IR spectroscopy gives evidence about the presence of Si–O–Si and Si–O–Al groups that is crucial for alkali-activated materials. Fur-ther interpretation and description of the bonds between SiO4 and AlO4 tetrahedrons is dificult and ambiguous using FTIR. For more detailed information about reciprocal interconnections, i.e. nets of aluminosilicate phases, it is necessary to employ MAS-NMR technique. MAS NMR (nuclear magnetic resonance spectroscopy using magic – angle spinning) of samples in a solid state has been used in recent years to identify the phase composition of alkali-activated pozzolanas. This method provides detailed information about the structure of materials containing atoms with non-zero nuclear spin; in the case of alkali-activated pozzolana these are 29Si and 27Al nuclides. Based on the coniguration of the surrounding electrons and the presence of the bonds, these nuclei form different magnetic ields acting in opposition to the external magnetic ield. If the frequency of the external ield and the rotational part of the magnetic dipole of an atom are the same then resonance occurs, which is a necessary condition for reception of the energy by the nucleus. The reception of the energy is detected in the form of a peak in the spectrum. Frequencies are multiplied by a numerical factor of 106 and are expressed in units of ppm [21].
The coniguration of SiO4 tetrahedrons is assigned using the symbols Qn or SiQn, where n represents the
number of other Si atoms linked through oxygen bonds. If an aluminium atom is bonded to the SiO4 tetrahedron then this arrangement is assigned as SiQn (xAl), where n
can be 1 to 4 and x has a maximum value of 4. The value of the index n denotes the degree of interconnection of the silicon and aluminium tetrahedrons [27, 28, 29].
is again expressed in the form e.g. AlQ4(4Si), which means that four atoms of silicon are linked through oxygen atoms to aluminium [27].
For 4-fold coordinated aluminium, resonance oc-curs in the 60 ~ 80 ppm interval. In the case of bonding between AlO4 and SiO4 tetrahedrons (aluminosilicate bond) resonance occurs in the 50 ± 20 ppm interval. Davidovits [10, 11] observed the following resonances: AlQ0: 79.5 ppm, AlQ1(1Si): 74.3 ppm, AlQ2(2Si): 69.5 ppm, AlQ3(3Si): 64.2 ppm and AlQ4(4Si): 55 ppm. According to many authors the presence of resonance for the AlQ4(4Si) unit in registered MAS NMR spectra gives evidence for the presence of geopolymer in alka-li-activated products [1]. Contrary to 27Al MAS NMR spectra, the interpretation of 29Si MAS NMR spectra is more dificult because the resonance signals of diffe- rent structural units with SiO4 tetrahedrons overlap signiicantly. Škvára et al. [30] listed the following resonance values: SiQ1: –78 ± 2 ppm, SiQ2: –85 ± 2 ppm, SiQ2(1Al): –82 ± 2 ppm, SiQ0: –85 ± 5 ppm. For geopo-lymers, Davidovits [11] listed the following resonances: SiQ4(4Al): –85 ± 5 ppm, SiQ4(3Al): –90 ± 5 ppm, SiQ4(2Al): –95 ± 5 ppm, SiQ4(1Al): –100 ± 5 ppm. For SiQ4(0Al) resonance in the interval –100 ~ –115 ppm has been reported [1].
Škvára et al. [30, 31] studied the hydration products of alkali-activated ly ash and observed resonance at 55 ppm as well as weak resonance at 3 ppm in the 27Al MAS NMR spectrum, which can be allotted to 6–fold coordinated aluminium in unreacted mullite (AS2H2), and observed that the main peak in this spectrum matches with AlQ4(4Si) whereas the presence of this structural unit veriies the presence of geopolymer. If the alkali-activated mixture contains substantial amounts of Al2O3 and CaO, then using MAS NMR phases of the geopolymer type and phases with branched aluminosilicate chains, typical for alkali-activated slag itself (chains of C−S−H phases where silicon is partially substituted by aluminium) are observed [22].
Generally in the course of alkali activation (most often acquired using sodium water glass or sodium hydroxide) of various pozzolana, two types of amor-phous products apparently originate: C–S–H phases and geopolymers. Cations from the activator (most often Na+) are incorporated in these hydration products in different ways. In the case of C–S–H phases, Na+ cations are adsorbed on the very ragged surface of the C–S–H gel and only a negligible portion of Na+ is captured inside the C–S–H gel. In the case of hydration products
of aluminosilicate (zeolitic character), the alkali cations are irmly bonded not only at the surface but also in the internal structure of the resulting geopolymer [33, 34].
In this work we study the process of alkali activation of mixtures of GBFS and FA using X-ray diffraction, IR spectroscopy and MAS NMR spectroscopy. We propose a method for identiication of the presence of both C-S-H gels and geopolymers based on pH measurements of water suspensions prepared from alkali-activated mixtures of GBFS and FA after different time periods of hydration.
EXPERIMENTAL Selection and adjustment of the raw material components
Two most common technogenic pozzolana: i) gra- nulated blast furnace slag (GBFS) produced at Arcelor Mittal Ostrava a.s., speciic surface area according to Blaine 380 m2 kg-1, and ii) ly ash (FA) class F produced in the Dětmarovice power plant, CEZ, a.s., speciic sur-face area according to Blaine 365 m2∙kg-1, were used for sample preparation. Industrially produced water glass was aplied as the alkali activator. Its original silicate modulus MS (MS = nSiO2/nNa2O) was modiied with a 50 %
solution of NaOH to give a value of MS = 2.0. Analysis
of the original water glass was performed in compliance with the Czech standard ČSN 653191 from 1987. The activator was dosed in an amount which assured a dosage of 5.0 wt. % of Na2O related to dry mixtures of GBFS and FA.
The chemical compositions of GBFS and FA were determined using XRFS (SPECTRO XEPOS spectro-meter equipped with a 50 W Pd X-ray tube) – Table 1.
Phase analysis was conducted using X-ray powder diffraction (XRPD) on a Bruker D8 Advance diffrac-tometer equipped with CoKα radiation and a VANTEC 1 detector.
The rheological characteristics of the mixtures were adjusted to the identical consistency using distilled water. The water to solid ratio, i.e. ratio of l/s, was close to 0.30.
With the aim of studying the effect of the com-position of the initial mixture on the hydration process of alkali-activated GBFS-FA systems, four mixtures of GBFS and FA designated as samples II, III, IV and V were prepared. Alkali-activated GBFS and FA were designated as samples I and VI. Such adjustment of
Table 1. Chemical composition of the raw materials.
Compounds (wt. %)
Raw material CaO MgO SiO2 Al2O3 Fe2O3 TiO2 Na2O K2O
GBFS 37.74 12.09 41.86 5.74 0.21 0.18 1.06 0.35
FA 3.40 3.00 50.39 27.85 7.90 0.95 0.67 2.36
chemical composition enables alteration of the phase composition of alkali activation products in favour of aluminosilicate hydrate formation to the detriment of C–S–H phases.
The composition of each mixture was further recal-culated whereby only the major oxides belonging to phases that take part in alkali activation were taken into account [34] (Table 2).
From Table 2 it is evident that the SiO2 content is only slightly modiied when the content of GBFS and FA changes and the content of Na2O remains almost unchanged. A signiicant decrease in CaO content followed by an increasing content of Al2O3 in the mix-tures is necessary for the purpose of modifying the inal hydration products.
Preparation and testing of samples
All sample types (I - VI) were prepared and cured by the same way. In the irst step the dry mixtures, II - V, were homogenized in a vibratory mill. Pure GBFS (sample I) and pure FA (sample VI) as well as homogenized mixtu-res II - V were then alkali-activated using a liquid acti-vator – water glass (MS = 2.0) – in suficient amount to
yield 5 wt. % of Na2O per 100 g of dry solid components in the inal mixture. The rheological properties of the mixtures were adjusted with distilled water to reach identical workability.
The prepared mixtures were poured into moulds (20 × 20 × 20 mm) and densiied using a vibrational table (60 sec., 25 Hz). The moulds were stored in a moist environment (more than 99 % of relative humidity) and after 24 hours the samples were taken out of the moulds and again stored in a moist environment. The temperature during storage of the moulds and samples was approximately 23 ± 1°C.
After 24 hours of storage the samples were tested for their:
● Bulk density (BD = m/V), where m is weight of the sample measured using an analytical balance and V is the volume of each sample calculated from its dimensions measured with digital micrometre.
● Compressive strength (CS) was measured using a la-boratory press with monotonous loading 2400 N·s-1 COMPACT LLB1 (BRIO Hranice, s.r.o.).
● Phase composition using X-ray powder diffraction em-ploying a Bruker D8 Advance diffractometer (Bruker AXS).
Three further types of tests used to characterise the samples are described later in this paper.
RESULTS AND DISCUSSION
The basic characteristics that document the time run of hydration processes are bulk density (BD) (Table 3) and compressive strength (Table 4). BD values (Table 3) grew slightly as a consequence of densiication of the hydrated structures caused by the illing of pores between raw material particles by hydration products. Higher BDs accrue to samples with a greater amount of GBFS as a result of the presence of hollow spheroidal particles in ly ash, which decrease the values of BD.
For all of the samples, the compressive strength increased with the time of hydration (Table 4). Com-paring the CS values for mixtures I - VI it is evident that the samples with a higher portion of FA and thus lower content of CaO showed lower values of CS as a consequence of a smaller amount of C–S–H phases being formed.
Table 2. Calculated composition of raw material mixtures.
Mixture = w(GBFS)/w(FA) Chemical composition (wt. %) Comp. ratio
Design. (wt. %) SiO2 (S) CaO (C) Al2O3 (A) Na2O (N) C/S A/S
I GBFS/FA= 100/0 48.43 39.22 5.96 6.39 0.810 0.123
II GBFS/FA = 80/20 50.02 32.82 10.80 6.36 0.656 0.216
III GBFS/FA = 60/40 52.29 25.74 15.63 6.34 0.492 0.299
IV GBFS/FA = 40/60 54.59 18.54 20.57 6.30 0.340 0.377
V GBFS/FA = 20/80 56.94 11.21 25.57 6.28 0.197 0.449
VI GBFS/FA= 0/100 59.33 3.74 30.68 6.25 0.063 0.517
Table 3. Average bulk densities (BD) of mixtures I ~ VI. Hydration Bulk density (kg∙m-3)
period (days) I II III IV V VI
7 2002 1991 1939 1895 1852 1804 28 2015 2000 1957 1911 1864 1823
Table 4. Average compressive strength (CS) of mixtures I ~ VI. Hydration CS (MPa)
period (days) I II III IV V VI
2 26.9 22.4 21.5 20.4 19.5 –
pH measurements of alkali-activated sample leaches
After 7 and 28 days of hydration, alkali-activated samples were milled for 2 min using a vibrating mill. The 0.09 ~ 0.2 mm fraction of each milled sample was obtained using sieving. In the next step 0.50 ± 0.01 g of each sieved sample was weighted into a plastic bottle and then 100 ml of distilled water was added. The prepared suspensions were manually stirred for 30 seconds and initial pH was measured using a HANNA pH 210 pH meter equipped with a combined glass electrode. The bottles with the suspensions were then covered with plastic foil to secure a constant volume. The pH values were then measured at selected time periods during which the suspensions were manually stirred for 30 se-conds prior to pH measurement.
The measured pH values (Table 5 and Table 6) monitor the fraction of alkali ions that are not irmly bonded in hydration products and thus can show the
difference between alkali ions bonded in zeolitic phases and alkali ions adsorbed only on the surface of C–S–H gel, which are easily released into the suspension. Zeolitic precursors such as the hydration products of FA alkali activation are practically insoluble in water and alkali ions bonded in their structures are not released into the suspension.
After conversion of the sieved grainy sample into a suspension, the hydration processes continues further under the same conditions; however, in contrast to the original sample the hydration processes proceeds in a high excess of water, hence signiicantly faster than in the original state. The samples with greater portions of Al (samples II - VI) represent a chemical composition more favourable for the formation of zeolitic phases, whereas alkali ions take part in the formation of these phases; therefore, pH values in the suspensions prepared from these samples decrease.
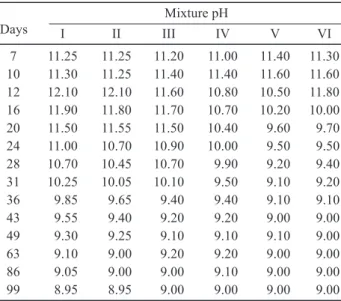
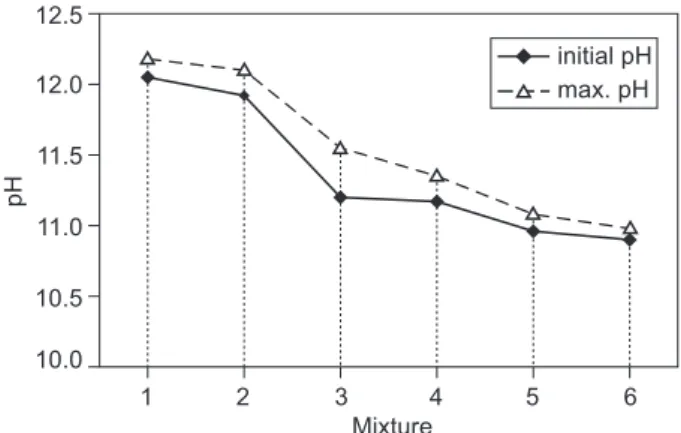
The dependency of the pH of the suspensions prepared from samples I - VI after 7 and 28 days of hy-dration are shown in Figures 1 and 2. The initial pH of the suspensions measured after their preparation increased over 2 - 3 days as a result of the release of alkali ions adsorbed on the hydration products (Figure 3). In the next time period, the pH values decrease proportionally as a consequence of zeolitic product formation. In mixtures with greater ly ash content (mixtures II - VI) Table 5. pH values after 7 days of hydration.
Mixture pH
Days I II III IV V VI
7 11.25 11.25 11.20 11.00 11.40 11.30 10 11.30 11.25 11.40 11.40 11.60 11.60 12 12.10 12.10 11.60 10.80 10.50 11.80 16 11.90 11.80 11.70 10.70 10.20 10.00 20 11.50 11.55 11.50 10.40 9.60 9.70 24 11.00 10.70 10.90 10.00 9.50 9.50 28 10.70 10.45 10.70 9.90 9.20 9.40 31 10.25 10.05 10.10 9.50 9.10 9.20 36 9.85 9.65 9.40 9.40 9.10 9.10 43 9.55 9.40 9.20 9.20 9.00 9.00 49 9.30 9.25 9.10 9.10 9.10 9.00 63 9.10 9.00 9.20 9.20 9.00 9.00 86 9.05 9.00 9.00 9.10 9.00 9.00 99 8.95 8.95 9.00 9.00 9.00 9.00
Table 6. pH values after 28 days of hydration. Mixture pH
Days I II III IV V VI
28 12.05 11.90 11.20 11.00 11.20 10.90 33 12.15 12.10 11.60 11.10 11.30 11.00 37 11.80 11.80 11.40 11.00 10.80 10.00 40 11,55 11.35 11.20 10.20 10.40 9.40 45 11.30 11.10 10.70 9.50 9.60 9.10 51 10.95 10.50 9.90 9.10 9.10 9.00 57 10.20 10.05 9.50 9.00 9.00 9.00 65 9.75 9.20 9.00 9.00 9.00 9.00 72 9.20 8.90 9.00 9.00 9.00 – 87 9.00 8.95 9.00 9.00 9.00 –
95 8.90 – – – 9.00 –
108 8.85 – – – – – Figure 2. Development of pH values after 28 days of hydration. Figure 1. Development of pH values after 7 days of hydration.
Days of hydration 20
8.5 9.5 10.5 11.5 12.5
40 60 80 100
30 50 70 90 110
Mixture I Mixture II Mixture III Mixture IV Mixture V Mixture VI
p
H
Days of hydration 0
8.5 9.5 10.5 11.5 12.5
20 40 60 80 100
Mixture I Mixture II Mixture III Mixture IV Mixture V Mixture VI
p
the conditions are more amenable to zeolite formation, therefore more alkali ions can be entrapped in their structures and the thus pH values are lower.
The inal pH of all of the samples stabilized at a value of about 9.0, showing the inal state of hydration process, which comprises achieving a dynamic balan-ce of alkali ions adsorbed on the formed gels and backwardly released into suspension during stirring. The time needed to decrease the pH to its inal value of 9.0 is unambiguously associated with the formation of zeolitic hydration products and varied between 90 and 55 days for the suspensions I - VI (Figure 4).
The time dependence of the pH of the aqueous suspensions prepared from hydrated samples shows the extent of C–S–H gel and zeolitic phase formation, and thus represents a valuable indirect method to characterise the hydration process in alkali-activated systems.
Phase analysis
The phase and structural analysis of the hydrated samples I (GBFS/FA=100/0), III (GBFS/FA=60/40) and V (GBFS/FA=20/80) was studied using XRD, IR spectroscopy and solid state NMR. The analysis was done on the powders obtained by milling each sample
(particle size below 25 µm) after 28 days of hydration. The hydration process of the freshly milled samples was stopped using washing with acetone followed by subsequent drying at laboratory temperature.
Results of XRD
Diffraction patterns of hydrated samples I, III and V are shown and compared in Figure 5. Sample I represents alkali-activated and hydrated GBFS and its diffraction pattern reveals the vitreous character of this sample. Calcium carbonate and merwinite were identiied as the only crystalline phases present in this sample. C–S–H gel as a main product of alkali activation and hydration of GBFS is typically a poorly crystalline phase; its presence is signalled by the diffraction line centred at 34.5°2θ CoKa [38]. Unfortunately, the position of this diffraction line is closely similar to the diffraction line of CaCO3. The similarity of the positions of the main diffraction lines of CaCO3 and C–S–H phase and its low crystallinity make it very dificult to verify the presence of C–S–H gel in this sample. In the case of samples III and V the situation with respect to veriication of C–S–H gel is the same as in the case of sample I. Other phases in samples III and V indicate the presence of mullite and silicon oxide, which are common admixtures of ly ash.
According to the theory, C–S–H gel is the product of alkali activation of granulated blast furnace slag. Products of alkali activation of metakaolin or ly ash are three-dimensional amorphous alumosilicate nets [10, 32], so called geopolymers. This paper [32] and others conirm that C–S–H gel and geopolymer, as products of alkali activation of granulated blast furnace slag and ly ash, can coexist at the same time. Using XRD it is not possible to verify the presence of geopolymer, mainly due to the amorphous character of these hydration products. Due to the position of main diffraction line of C–S–H phases is closely similar to the main diffraction line of CaCO3 as stated above, the presence of C–S–H is not reliably conirmed by XRD.
Figure 3. The initial and maximum pH value of the hydrated mixtures.
Figure 4. Time to attain a pH value 9.0.
Figure 5. XRD pattern of samples I, III and V (1 - calcite, 2 - C–S–H gel, 3 - α-quartz, 4 - merwinite, 5 - gehlenite, 6 - mullite).
Mixture 1
10.0 10.5 11.0 11.5 12.0 12.5
4 6
3 5
2
initial pH max. pH
p
H
Mixture I
20 40 60 80 100
IV VI
III V
II
Time of attainment of pH=9
T
im
e
(
d
a
y
s
)
2-Theta - Scale
5 10 20 30 40 50 60 70 80
I V
III
1, 2
1 1
3
5
6
6
6 6 6 6
6 6 6
4
3
3
3
Results of IR spectroscopy
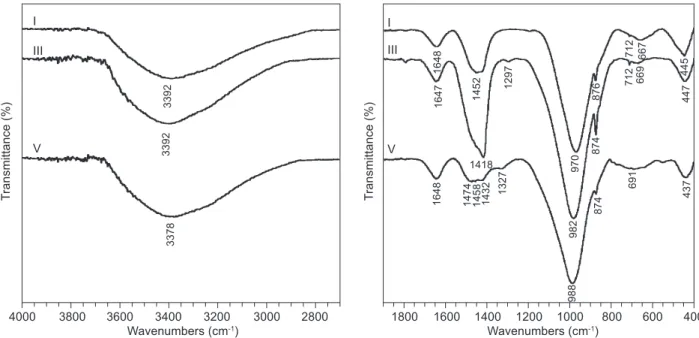
Contrary to X-ray diffraction, infrared spectroscopy (IR) can provide information about the structure of amorphous phases. The IR spectra of samples I, III and V after a 28-day period of hydration are compared in Figure 6. The broad band with a maximum centred at approximately 3385 cm-1, together with the band with a maximum centred at 1648 cm-1 belong to stretching and bending vibrations of the O-H group, and appear in the spectra of all the samples, verifying the presence of water. The band at 1452 cm-1 corresponds to asymmetric stretching vibration of O–C–O bonds and, together with the band centred at 876 cm-1, conirms the presence of the (CO3) anion and thus the presence of carbonates. The main hydration products originating in sample I is C–S–H gel, which shows vibrations of Si–O–Si and Si–O–Al groups at position 970 cm-1 [36]. The position of the band belonging to vibrations of Si–O–Si and Si–O–Al groups is slightly shifted towards higher values in the case of samples III and V (see Figure 6), in which the content of ly ash is signiicantly increased. The observed shift in the position of the peak maximum in the region around wavenumber 980 cm-1 conirms the presence of SiO4 tetrahedrons with an increasing number of bonds with other cations. In this case the given shift in the peak maximum evidences penetration of Al into the structure of the Si–O–Si net. Na cations from the alkali activator are also involved in the process of C–S–H gel as well as aluminosilicate hydrate formation [23, 30, 37]. The increase in aluminium content in the case of samp-les with more ly ash indicates that the formation of geopolymer type products is encouraged at the expense of C–S–H phases, as documented by the shift in the
maxima of the band at 970 cm-1 observed in sample I to the value 988 cm-1 observed for sample V (the sample with the highest content of ly ash).
Results of NMR
The structures of mixtures I, III and V after 28 days of hydration were further evaluated using 27Al and 29Si MAS NMR spectroscopy; the spectra registered for samples I, III, IV are shown in Figures 7, 8 and 9. The registered 29Si MAS NMR peaks were further deconvoluted to individual peaks that are related to the presence of the silicon and aluminium in a given coordination, which provides information about the structure of the resulting hydration products. The position and calculated area of each of the peaks is included below the given spectrum.
The course of the 27Al MAS NMR curve registered for each mixture (Figures 7, 8 and 9) veriies the presence of a peak with a maximum centred at approximately 60 ppm belonging to the structural unit AlQ4(4Si), which is a typical constituent of geopolymers. The position of the maximum shifts towards lower values (65.5 → 61.5 → → 59.5 ppm) with increasing amounts of ly ash, while alkali activation leads to the formation of geopolymer (for pure geopolymer the position of the maximum should be 55 ppm [1, 10, 11]). The second peak occurring in the 27Al MAS NMR spectra can be found in the region 2.5 to 9.5 ppm, and corresponds to 6-fold coordina-tion of aluminium. According to the literature, the pre-sence of this peak signals the prepre-sence of hydrotalcite [Mg0.75Al0.25(OH)2](CO3)0.125(H2O)0.5. The area of this peak decreases with increasing ly ash content.
Figure 6. Mid-IR spectra of mixtures I, III and V after 28 days of hydration.
Wavenumbers (cm-1)
V III I 3 3 9 2 3 3 9 2 3 3 7 8 T ra n s m it ta n c e ( % )
4000 3800 3600 3400 3200 3000 2800
Wavenumbers (cm-1)
V III I 1 4 3 2 1 4 5 8 1 4 7 4 1 6 4 8 1 6 4 8 1 6 4 7 1418 1 4 5 2 1 3 2 7 1 2 9 7 9 8 8 9 8 2 9 7 0 8 7 4 8 7 4 8 7 6 6 9 1 6 6 9 6 6 7 7 1 2 7 1 2 4 3 7 4 4 7 4 4 5 T ra n s m it ta n c e ( % ) 1600
The 29Si MAS NMR spectra of the samples show the presence of a single peak, its shape signalling that this peak is formed by several overlapping peaks. Using the deconvolution method the individual peaks can be separated and the contribution of the given Si structural unit can be calculated. Generally the presence of SiQ2 together with SiQ1 units proves the presence of C–S–H phases [30]; the peaks belonging to these units were demonstrated in the spectra of samples I and III. The area
of the peaks belonging to SiQ2 and SiQ1 is the lowest in the case of sample V. It is evident that the sum of the area of the peaks belonging to these units decreases with increasing content of ly ash, verifying the decrease in C–S–H gel content. The presence of the peak centred at -85 ppm belonging to both SiQ4(4Al) and SiQ2 units signals the presence of both geopolymer structure as well as the presence of C–S–H phases.
The SiQ4(xAl) units prove the presence of the geo-polymer structure, whereas sample V shows the highest number of these units, contrary to sample I which shows the lowest number of these units. The centre of gravity of the 29Si MAS NMR peak is shifted towards lower resonance with increasing ly ash content and also proves formation about geopolymer structure due to the presence of aluminium from the ly ash.
MAS NMR represents the most suitable technique to study the phase composition of alkali-activated techno-genic pozzolana. Generally all of the samples showed the presence of C–S–H phase as well as geopolymer structure, with the actual proportions of these structures dependent on the content of ly ash. Sample V, with the highest content of ly ash, showed the greatest extent of geopolymer structure compared with sample I, in which geopolymer structure was minor. On the other hand, sample I showed the presence of structure units typical for C–S–H phase to the highest extent, contrary to sample V in which this type of phase was a minor constituent.
CONCLUSION
The process of alkali activation of granulated blast furnace slag (GBFS) and its mixture with ly ash (FA) was studied in this paper and observations can be summarized as follows:
1. Phase composition of products of alkali activation shapes the mechanical properties. Alkali activated GBFS is characterized by the compressive strength over 100 MPa. It was observed that with FA content increasing the bulk density as well as compressive strength of the samples decreases. This trend is asso-ciated with extent of C–S–H gel formation which is in direct relation with GBFS content.
2. X-ray diffraction, does not provide satisfactory results for products of alkali activated GBFS and products of mixtures of GBFS and FA respectively. It is due to the amorphous character of that formed hydrated structures.
3. IR spectroscopy veriied shifting of the position of maximum of band attributed to Si–O–Si vibrations towards higher wavenumbers due to the penetration of Al cations into the structure of Si–O–Si net.
4. MAS-NMR spectroscopy proved that samples pre-pared from the pure GBFS and activator are for the most part composed of C−S−H phases, which are Figure 7. 27Al and 29Si MAS NMR of sample I after 28 days
of hydration.
Figure 8. 27Al and 29Si MAS NMR of sample III after 28 days of hydration.
Figure 9. 27Al and 29Si MAS NMR of sample V after 28 days of hydration.
ppm ppm
100 50 0 0 -50 -100 -150
ppm area %
AlO4 65.5 92
AlO6 9.5 8
ppm area %
SiQ0 -71.5 9
SiQ1 -78.5 44
SiQ2/SiQ4(4Al) -85.0 34
SiQ4(3Al) -92.0 13
ppm ppm
100 50 0 0 -50 -100 -150
ppm area %
AlO4 61.5 98
AlO6 2.5 2
ppm area %
SiQ0 -71.0 5
SiQ1 -76.5 16
SiQ2/SiQ4(4Al) -84.0 48
SiQ4(3Al) -92.0 25
SiQ4(Al) -102.0 6
ppm ppm
100 50 0 0 -50 -100 -150
ppm area %
AlO4 59.5 97
AlO6 2.5 3
ppm area %
SiQ1 -76.0 7
SiQ4(4Al) -83.0 13
SiQ4(3Al) -88.0 20
SiQ4(2Al) -92.5 24
SiQ4(1Al) -100.0 19
accompanied by the occurrence of spatially bonded SiO4 tetrahedronsthat are linked to AlO4 tetrahedrons. The presence of geopolymers was conirmed with help of MAS-NMR in the case of samples with high content of FA.
5. Observation of pH dependency of water leachates prepared from hydrated samples GBFS and its mixtu-re with FA showed the kinetics of pH stabilization strongly dependent on the phase composition of hydra- ted samples as well as on time of hydration. The inal pH of the suspensions prepared from alkali activated GBFS and its mixture with FA reached the same value, 9.0, but the time after which this value was acquired differed based on the composition of the samples. The increasing presence of FA signiicantly reduced this time. By this method of measure of the pH can be indirectly monitored evaluation of the phase composition of hydrating samples.
Alkali activation of secondary raw materials with latent hydraulic properties is promising environmental alternative to binders based on Portland cement. The hydration of alkali activated materials is complex process and its description requires utilization of different methods of chemical and phase analysis.
Acknowledgement
This paper was created in the Project No. LO1203 "Regional Materials Science and Technology Centre - Feasibility Program" funded by Ministry of Education, Youth and Sports of the Czech Republic and in the project No. SP2014/46 Material and energy saving on account of secondary raw materials utilization in industry. The work was also sustained by a project of long-term conceptual development of research organizations RVO:68145535.
REFERENCES
1. Shi, C., Roy, D., Krivenko, P.: Alkali-Activated Cements and Concretes, p. 392, Taylor & Francis, London and New York, 2006.
2. Odler, I.: Special Inorganic Cements (Modern Concrete Technology), p. 416, Routledge mot E F & N Spon, 2002. 3. Pacheco-Torgal, F., Castro-Gomes, J., Jalali, S.: Constr.
Build. Mater. 22, 1305 (2008).
4. Škvára, F. in: Proceedings International Conference Alkali activated materials – Research, Production and Utilization, p. 661-676, Praha 2007.
5. Brandštetr, J.: Stavivo 62, 110 (1984).
6. Wang S.-D., Scrivener, K.L.: Cem. Concr. Res. 25, 561 (1995).
7. Criado, M., Palomo, A., Fernández-Jiménez, A.: Fuel, 84, 2048 (2005).
8. Puertas, F., Martinez-Ramirez, S., Alonso, S., Vasquez, T.: Cem. Concr. Res. 30, 1625 (2000).
9. Fernández-Jiménez, A., Palomo, A.: Fuel 82, 2259 (2003). 10. Davidovits, J.: J. Therm. Anal. 37, 1633 (1991).
11. Davidovits, J. in: Proceedings. 1st International Conference
on Alkaline Cements and Concretes, p. 131 – 149, Kiev 1994.
12. Gluchovski, V.D.: Gruntosilikaty, Gosstrojizdat USSR, Kiev, 1959.
13. Gluchovski, V.D.: Šlakoščoločnyje betony namelkozer-nistych zapolnitěljach. Vyšša škola, Kiev, 1981.
14. Brough, A.R., Katz, A., Bakharev, T., Sun, G.K., Kirkpatrick, R.J., Struble, L.J., Young, J.F.: Mater. Res. Soc. Proc. 370, 199 (1994).
15. Palomo, A., Grutzeck, M.W., Blanco, M.T.: Cem. Concr. Res. 29, 1323 (1999).
16. Xie, Z., Xi, Y.: Cem. Concr. Res. 31, 1245 (2001).
17. Brough, A.R., Atkinson, A.: Cem. Concr. Res. 32, 865 (2002).
18. Song, S., Sohn, D., Jennings, H.M., Mason, T.O.: J. Mater. Sci. 35, 249 (2000).
19. Puertas, F., Fernández-Jiménez, A., Blanco-Varela, M.T.: Cem. Concr. Res. 34, 139 (2004).
20. van Deventer, J.S.J., Provis, J.L., Rees, C.A., Yong, Ch.Z., Duxson, P., Lukey, G.C. in: Proceedings International Conference Alkali activated materials – Research, Produc-tion and UtilizaProduc-tion, p. 725-734, Praha 2007.
21. Kalous, V.: Metody chemického výzkumu, p. 430, SNTL Alfa, Praha, 1987.
22. Mozgawa, W., Deja, J.: J. Mol. Struct., 924-926, 434 (2009).
23. Lecomte, I., Henrist, C., Liégeois, M., Maseri, F., Rulmont, A., Cloots, R.: J. Eur. Ceram. Soc. 26, 3789 (2006). 24. Bernal, S.A., Provis, J.L., Rose, V., de Gutierrez, R.M..:
Cem. Concr. Compos. 33, 46 (2011).
25. Zelić, J., Jozić, D., Tibljaš, D. in: Proceedings. International Conference Alkali activated materials – Research, Pro-duction and Utilization, p. 757-769, Praha 2007.
26. Wang, S.-D., Scrivener, K.L.: Cem. Concr. Res. 33, 769 (2003).
27. Kirkpatrick, R.J. in: Spectroscopic Methods in Mineralogy and Geology, p. 341 – 403, Ed. Hawthorne, F.C., Miner. Soc. of America, Washington, D.C., 1988.
28. Komnitsas, K., Zaharaki, D.: Geopolymerization: A review and prospects for the mineral industry. Miner. Eng. 20, 1261 (2007).
29. Buchwald, A., Hilbig, H., Kaps, Ch.: J. Mater. Sci., 42, 3024 (2007).
30. Škvára, F., Jílek, T., Kopecký, L.: Ceramics-Silikáty 49, 195 (2005).
31. Škvára, F., Kopecký, L., Němeček, J., Bittnar, Z.: Ceramics-Silikáty 50, 208 (2006).
32. Yip, C.K., Lukey, G.C., van Deventer, J.S.J.: Cem. Concr. Res. 35, 1688 (2005).
33. Tomková, V., Majling, J.: Ceramics-Silikáty 40, 115 (1996). 34. Tomková, V., Ovčačík, F., Vlček, J., Ovčačíková, H., Topinková, M., Vavro, M., Martinec, P.: Ceramics-Silikáty 56, 168 (2012).
35. ČSN 653191. Vodní sklo sodné tekuté. Praha: Český normalizační institut, 1984.
36. Fernández-Jiménez, A., Puertas, F.: Adv. Cem. Res. 13, 115 (2001).
37. Puertas, F., Fernández-Jiménez, A.: Cem. Concr. Compos.
25, 287 (2003).