BGD
12, 5535–5557, 2015Estimation of nutrient contributions from
the ocean
K. Nakayama
Title Page
Abstract Introduction
Conclusions References
Tables Figures
◭ ◮
◭ ◮
Back Close
Full Screen / Esc
Printer-friendly Version Interactive Discussion
Discussion
P
a
per
|
Discussion
P
a
per
|
Discussion
P
a
per
|
Discussion
P
a
per
|
Biogeosciences Discuss., 12, 5535–5557, 2015 www.biogeosciences-discuss.net/12/5535/2015/ doi:10.5194/bgd-12-5535-2015
© Author(s) 2015. CC Attribution 3.0 License.
This discussion paper is/has been under review for the journal Biogeosciences (BG). Please refer to the corresponding final paper in BG if available.
Estimation of nutrient contributions from
the ocean across a river basin using
stable isotope analysis
K. Nakayama1,2, Y. Maruya1,*, K. Matsumoto1, M. Komata1, K. Komai1, and T. Kuwae3
1
Kitami Institute of Technology, Kitami, Japan
2
The University of Western Australia, Perth, Australia
3
Port and Airport Research Institute, Yokosuka, Japan
*
now at: Kyoto University, Kyoto, Japan
Received: 16 February 2015 – Accepted: 16 March 2015 – Published: 14 April 2015
Correspondence to: K. Nakayama ([email protected])
BGD
12, 5535–5557, 2015Estimation of nutrient contributions from
the ocean
K. Nakayama
Title Page
Abstract Introduction
Conclusions References
Tables Figures
◭ ◮
◭ ◮
Back Close
Full Screen / Esc
Printer-friendly Version Interactive Discussion
Discussion
P
a
per
|
Discussion
P
a
per
|
Discussion
P
a
per
|
Discussion
P
a
per
|
Abstract
Since marine derived nutrients (MDN) are transported not only in river channels but also across the entire river basin, including via ground water and migratory animals, it is necessary to investigate the contribution of MDN to the forest floor (soils) in order to quantify the true role of MDN at the river ecosystem scale. This study investigated 5
the contribution of pink (Oncorhynchus gorbuscha) and chum salmon (O. keta) to total oceanic nitrogen (TN) input across a river basin using stable isotope analysis (SIA) of nitrogen (δ15N). The contribution of TN entering the river basin by salmon was 23.8 % relative to the total amount of TN exported from the river basin, providing a first estimate of MDN export for a river basin. The contribution of nitrogen from the ocean to the 10
river basin soils was between 22.9 and 23.8 %. Furthermore, SIA showed that the transport of oceanic TN by sea eagles (Haliaeetusspp.) was greater than that by bears (Ursusarctos), which had previously been that bears are thought to be the major animal transporter of nutrients in the northern part of Japan.
1 Introduction 15
SIA is increasingly being used to examine connectivity in coastal aquatic-terrestrial ecosystems, such as the input of MDN from the open ocean to coastal and widely river ecosystems (Wyatt et al., 2010a, b, 2012). In the case of river ecosystems, the transportation of nutrients, such as nitrogen and phosphorus, by migrating fish results in enhancement of biofilms and planktonic productivity in river systems (Juday et al., 20
1932; Cederholm and Peterson, 1985; Bilby et al., 1996; Gresh et al., 2000; Chaloner et al., 2002; Moore and Schindler, 2004; Yanai and Kochi, 2005; Levi and Tank, 2013). Most of those cases, many terrestrial consumers like mammals, birds and insects have been shown to play a large role in terms of providing MDN to watersheds (Donaldson, 1966; Ben-David et al., 1997a; Hinderbrand et al., 1999; Gende et al., 2002; Naiman 25
BGD
12, 5535–5557, 2015Estimation of nutrient contributions from
the ocean
K. Nakayama
Title Page
Abstract Introduction
Conclusions References
Tables Figures
◭ ◮
◭ ◮
Back Close
Full Screen / Esc
Printer-friendly Version Interactive Discussion
Discussion
P
a
per
|
Discussion
P
a
per
|
Discussion
P
a
per
|
Discussion
P
a
per
|
have been shown as important processes controlling the productivity of ecosystem. For example, Merz and Moyle (2006) found that the contribution of MDN to the foliar nitrogen of wine grapes was about 18 to 25 %. Also, Hilderbrand et al. (1999) demon-strated that trees and shrubs near spawning streams receive 24 to 26 % of the foliar nitrogen from MDN, while Helfield and Naiman (2002) suggested that 15.5 to 17.8 % of 5
spruce foliage nitrogen may be provided from MDN. Thus, isotopic methods as intrin-sic geospatial tracer provided quantification of cross-ecosystem transfer of nutrients. In particular, migrating fish, such as salmon, have been found to be necessary for a sustainable nutrient-cycle system due to their important role as nutrient transporters (Ben-David et al., 1998; Wipfli et al., 1998; Yanai and Kochi, 2005; Gende et al., 2007; 10
Hocking and Reimchen, 2009; Hocking and Reynolds, 2011). Additionally, MDN has been demonstrated to be important not only for river ecosystems but also potentially for upstream lakes (Kline et al., 1990, 1993; Schindler et al., 2003).
Here we focus on the nutrient budgets at the river basin scale of using stable iso-topes. When we consider nutrient flux in a river flowing from the upstream end into the 15
ocean, the flux depends on nutrients supplied not only inside the river itself but from the entire river basin (Dutta and Nakayama, 2010; Alam and Dutta, 2012; Riggsbee et al., 2008). Cederholm et al. (1989) demonstrated that mammals and birds consume migrat-ing fish, which may result in the secondary dispersion of MDN across the river basin associated with the movement of these consumers. Other studies have revealed that 20
mammals incorporate MDN from salmon, which may subsequently lead to re-export to the ocean through river flows (Bilby et al., 1996; Ben-David et al., 1997a, b; Hilder-brand et al., 1999; Szepanski et al., 1999; Reimchen, 2000). However, the contribution of MDN at the river basin scale has not been adequately quantified in natural systems because of difficulty to show those complex wood web and accurate biomass.
25
BGD
12, 5535–5557, 2015Estimation of nutrient contributions from
the ocean
K. Nakayama
Title Page
Abstract Introduction
Conclusions References
Tables Figures
◭ ◮
◭ ◮
Back Close
Full Screen / Esc
Printer-friendly Version Interactive Discussion
Discussion
P
a
per
|
Discussion
P
a
per
|
Discussion
P
a
per
|
Discussion
P
a
per
|
us to estimate nutrient budgets in natural river basin and convinced us to conserve the ocean- river connectivity.
2 Geophysical setting
Our target area, the Shiretoko Peninsula, was registered as a World Natural Heritage area in July of 2005. Shiretoko is located at the southernmost extent of drift ice and 5
its ecological systems exhibit high biodiversity and high rates of nutrient circulation, particularly due to runs of pink (Oncorhynchus gorbuscha) and chum (O. keta) salmon from the Sea of Okhotsk. Potential runs of salmon along the coast of Hokkaido in the Sea of Okhotsk have been estimated at about 29 900 000 individuals a year (Hokkaido National Fisheries Research Institute, Fisheries Research Agency, 2009), equivalent 10
to 2590 t of total nitrogen. The size of the Okhotsk coastal region of Hokkaido is about 24 000 km2, which corresponds to that the mean total nitrogen input from the ocean is about 108 kg km−2yr−1 if we assume that all salmon run up rivers and the total
nitro-gen is distributed into the river basins completely. Shiretoko is located on the north-east coast of Hokkaido, Japan (approximately 43◦57′N to 44◦21′N and 144◦58′E to
15
145◦23′E), and has a width, length and maximum altitude of about 15 km, 50 km and
1660 m, respectively (Fig. 1). The Rausu River Basin was selected as a study area because its watershed is the largest in the region and it is considered a representa-tive watershed in the Shiretoko Peninsula. The watershed area, river length, and the mean river slope are 32.5 km2, 7 km, 1/7, respectively (Fig. 2). Field experiments were 20
BGD
12, 5535–5557, 2015Estimation of nutrient contributions from
the ocean
K. Nakayama
Title Page
Abstract Introduction
Conclusions References
Tables Figures
◭ ◮
◭ ◮
Back Close
Full Screen / Esc
Printer-friendly Version Interactive Discussion
Discussion
P
a
per
|
Discussion
P
a
per
|
Discussion
P
a
per
|
Discussion
P
a
per
|
3 Methods
3.1 Nitrogen from a river basin to the ocean
TN, total dissolved nitrogen (TDN) and total particulate nitrogen (TPN) were measured at St.0 around the river mouth from 2007 to 2009 (Fig. 2). The nitrogen concentration of filtered and non-filtered water samples were analyzed by the cadmium reduction-5
colorimetric method. Annual TN and annual TDN export to the ocean were evaluated using the river discharge at St.0 with TDN-discharge and TPN-discharge curves. The TDN-discharge and TPN-discharge curves were produced using ten different peak dis-charge floods and base flow disdis-charges. As river disdis-charge was not measured during the winter season from January to March, a storage function method was applied to 10
estimate river discharge from 2008 to 2012 (Michael, 1978; Michael et al., 1979). The validity of the storage function method was confirmed through comparison with the observed river discharge from April to December.
3.2 Salmon runs
To evaluate the contribution of salmon to soil organic matter (SOM), the size of salmon 15
runs were investigated in the Rausu River. Salmon were caught at the river mouth for artificial incubation and release, providing an estimate of the number of salmon caught by the apparatus (Hokkaido National Fisheries Research Institute, Fisheries Research Agency, 2009). The apparatus for catching salmon consisted of bamboo, which does not obstruct flood flow or completely block the runs of salmon. Therefore, it was nec-20
BGD
12, 5535–5557, 2015Estimation of nutrient contributions from
the ocean
K. Nakayama
Title Page
Abstract Introduction
Conclusions References
Tables Figures
◭ ◮
◭ ◮
Back Close
Full Screen / Esc
Printer-friendly Version Interactive Discussion
Discussion
P
a
per
|
Discussion
P
a
per
|
Discussion
P
a
per
|
Discussion
P
a
per
|
of Hokkaido and has a width of 3 m and a length of about 6 km, instead of the Rausu River because the latter is too wide (about 15 m) to quantify the total salmon run.
3.3 Stable isotope analysis
MDN, such as nitrogen, are generally supplied from the ocean to surface soils in a river basin as SOM, as feces of mammals, droppings of birds, and the remains of salmon 5
preyed upon by mammals, birds and insects. To focus on the influence of SOM on nitrogen in the river basin soils, soil particles with diameter of less than 500 µm were used in the analysis. In general, some proportion of the nitrogen is reduced into the atmosphere due to denitrification, which indicates the difficulty evaluating total amount of supplied nitrogen. Nevertheless, we made an attempt to estimate the contribution of 10
MDN to SOM by sampling surface soils across the Rausu River Basin (Fig. 2). Surface soil samples were taken at 12, 20 and 21 stations in 2008, 2009 and 2012, respectively. In 2008, fewer samples were taken as we did not have permission to sample surface soils in special protection zones. Surface soils were sampled from three different points at each station in a volume of 5 cm×20 cm×20 cm (height×width×depth). Surface soil 15
sampling stations in 2012 are shown in Fig. 2. Stable isotope ratios of carbon (δ13C) and nitrogen (δ15N) were measured using a Delta Plus Advantage mass spectrom-eter (Thermo Electron) coupled with an elemental analyzer (Flash EA 1112, Thermo Electron) at the Port and Airport Research Institute, Japan. Stable isotope ratios are expressed in δ notation as the deviation from standards in parts per thousand (‰) 20
according to the following equation:
δ13C,δ15N=[Rsample/Rstandard−1]·103 (1)
whereR=13C/12C or15N/14N.
PeeDee Belemnite and atmospheric nitrogen were used as the isotope standards of carbon and nitrogen, respectively. The analytical precision in the mass spectrometer 25
BGD
12, 5535–5557, 2015Estimation of nutrient contributions from
the ocean
K. Nakayama
Title Page
Abstract Introduction
Conclusions References
Tables Figures
◭ ◮
◭ ◮
Back Close
Full Screen / Esc
Printer-friendly Version Interactive Discussion
Discussion
P
a
per
|
Discussion
P
a
per
|
Discussion
P
a
per
|
Discussion
P
a
per
|
bothδ13C andδ15N. The contribution of MDN to SOM in surface soils was evaluated by applying a two source mixing model based on stable isotope analysis (SIA) of carbon (δ13C) and nitrogen (δ15N) (Kline et al., 1998; Moore and Semmens, 2008; Hossler and Bauer, 2012). Three soil samples were collected at each sampling station in or-der to account for small scale variability in SOM (Fig. 2). Salmon tissue isotopes were 5
considered representative of the isotope composition of ocean productivity. To isotopi-cally characterize terrestrial productivity, we considered one terrestrial end-members (sources): Soil Samples exhibiting the Lowest values of δ13C and δ15N (hereafter SSL), and thus assumed to have the highest terrestrial contribution to SOM. Repre-sentative soil samples collected in the same river basin were chosen because they 10
have isotopically similar characteristics to the target soil samples in this study.
As bamboo grass (Sasa senanensis) is the dominant species in the study area, bam-boo grass was collected. Furthermore, to investigate the contribution of the other typical mammals and birds in Shiretoko to SOM, and to roughly understand these animals di-ets, droppings of sea eagles (Haliaeetusspp.) and feces of brown bear (Ursus arctos) 15
were collected (Kuwae et al., 2008, 2012). Dropping and feces samples can reduce the uncertainty in terms of SIA fractionation factors when compared to tissue samples (e.g., muscle, liver, and blood). As fractionation occurs during the making or breaking of bonds in small molecules, we might not expect fractionation during food assimilation, i.e., uptake of large molecules, in the absence of the breaking of nitrogen bonds (Fry, 20
2006). Thus, while tissue samples have variability and uncertainty related to fraction-ation factors (body conditions such as fasting), we consider that feces and dropping samples do not. However, in the case of multiple food sources, feces and dropping are likely to be enriched in relatively indigestible food sources, when compared with stom-ach contents or assimilated materials (Sponheimer et al., 2003; Kuwae et al., 2008). 25
BGD
12, 5535–5557, 2015Estimation of nutrient contributions from
the ocean
K. Nakayama
Title Page
Abstract Introduction
Conclusions References
Tables Figures
◭ ◮
◭ ◮
Back Close
Full Screen / Esc
Printer-friendly Version Interactive Discussion
Discussion
P
a
per
|
Discussion
P
a
per
|
Discussion
P
a
per
|
Discussion
P
a
per
|
The contribution of MDN was evaluated using a two sources mixing model based on the measuredδ13C andδ15N. The average contribution in the Rausu River Basin was computed using each sub-basin area obtained from the Thiessen method.
fC_MDN+fC_LDN=1 (2)
fC_MDNδ13Csalmon+fC_LDNδ13CSSL=δ13Csoil (3)
5
fN_MDN+fN_LDN=1 (4)
fN_MDNδ15N
salmon+fN_LDNδ15NSSL=δ15Nsoil (5)
wherefC_MDNandfC_LDNare the contributions of MDN and land-derived nutrient (LDN), δ13Csalmon, δ
13
CSSL and δ 13
Csoil are the stable isotope ratios of carbon for salmon,
SSL and soil samples, respectively, fN_MDN and fN_LDN are the contributions of MDN
10
and LDN,δ15Nsalmon,δ 15
NSSLandδ 15
Nsoilare the stable isotope ratios of nitrogen for
salmon, SSL and soil samples, respectively.
4 Results and Discussion
4.1 Estimation of nitrogen export to the ocean
During 2007 to 2009 the concentration of TDN was observed to be roughly constant, 15
0.090 mg L−1 (SD 0.022 mg L−1), regardless of the discharge in the Rausu River. In
contrast, TPN was revealed to be a function of river discharge (r2=0.88; Eq. 5). It should be noted that TPN showed a strong correlation with suspended sediment con-centrations (SS), with SS increasing with increasing river discharge. Also, TPN was confirmed to be associated with salmon spawning activities, which has been already 20
revealed by Moore et al. (2007).
TPN =0.0032·Q1.771 (6)
BGD
12, 5535–5557, 2015Estimation of nutrient contributions from
the ocean
K. Nakayama
Title Page
Abstract Introduction
Conclusions References
Tables Figures
◭ ◮
◭ ◮
Back Close
Full Screen / Esc
Printer-friendly Version Interactive Discussion
Discussion
P
a
per
|
Discussion
P
a
per
|
Discussion
P
a
per
|
Discussion
P
a
per
|
The validity of the storage function method model was confirmed using the observed river discharge from April to September of 2009, which resulted in a Coefficient of Determination (CoD) of 0.61. The reliability of the model has been shown to be high enough for the analysis of river discharge when the CoD is more than 0.6 (Dutta and Nakayama, 2010). Annual mean export of TDN, TPN and TN from 2008 to 2012 were 5
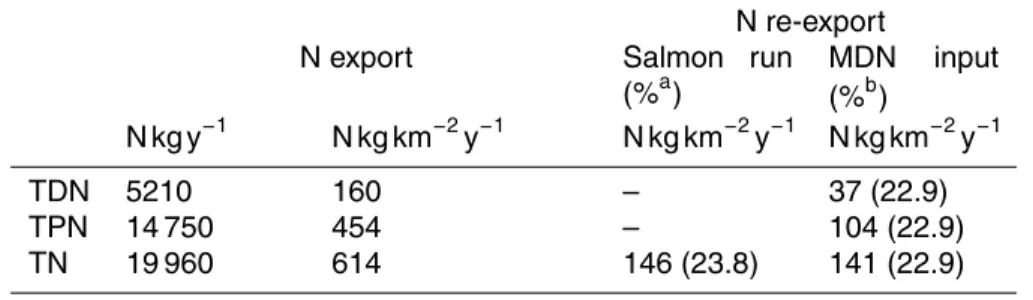
5210, 14 750 and 19 960 kg yr−1, respectively. Since the size of the Rausu River Basin
is 32.5 km2, the annual mean export of TDN, TPN and TN per unit catchment area were 160, 454 and 614 kg km−2yr−1, respectively (Table 1). The average concentrations of
TDN and TPN from 2008 to 2012 were 0.090 and 0.216 mg L−1, which agree with
a previous study at the site (Nakayama et al., 2011). 10
4.2 Contribution of salmon runs to nitrogen input from the ocean
The average number of salmon passing the cameras in the Tokorohoronai River dur-ing the 4 days while the apparatus for catchdur-ing salmon was present was 0.49 h−1.
The average numbers for 4 days after the apparatus was removed from the river was 0.61 h−1, so the rate of capture of salmon by the apparatus was estimated as 20 %:
15
(0.61–0.49)/0.61=0.20.
In the Rausu River, the annual average numbers of salmon caught by the appa-ratus at the river mouth were 2075 and 10 580 for chum and pink salmon, respec-tively, from 2001 to 2009. By assuming that all apparatuses have the same rate of capture, the chum and pink salmon runs can be estimated as 15 375 and 52 900, re-20
spectively. The average weight of chum and pink salmon are 3.3 and 2.0 kg, respec-tively (Makiguchi et al., 2007), with a nitrogen content of about 30.4 g kg−1(Larkin and
Slaney, 1997). Therefore, annual TN transported by chum and pink salmon is esti-mated to be 1542 and 3216 kg yr−1, respectively. Finally, the annual TN transported by
chum and pink salmon per unit catchment area can be estimated as 146 kg km−2yr−1
25
(SD 19 kg km−2yr−1), which corresponds to the contribution of TN by salmon, 23.8 %
BGD
12, 5535–5557, 2015Estimation of nutrient contributions from
the ocean
K. Nakayama
Title Page
Abstract Introduction
Conclusions References
Tables Figures
◭ ◮
◭ ◮
Back Close
Full Screen / Esc
Printer-friendly Version Interactive Discussion
Discussion
P
a
per
|
Discussion
P
a
per
|
Discussion
P
a
per
|
Discussion
P
a
per
|
4.3 Total input from the ocean to a river basin
The 2012 field experiment suggested that stable isotope ratios,δ13C and δ15N, were relatively higher close to the ocean (stations 20 and 21) compared to the top of the mountain (station 19), which has been also demonstrated by Kline et al. (1998) (Fig. 2). Tissueδ13C andδ15N were highest in the sea eagles (n=8) and lowest in the bamboo 5
grass (n=3). Theδ13C andδ15N of SOM (n=53) lay between sea eagles and bam-boo grass (Fig. 3). MANOVA suggested that there was no isotopic (δ13C and δ15N) difference between salmon tissue (n=12) and sea eagle feces. Feces from brown bears (n=7), which were previously thought to be the major terrestrial consumer of spawning salmon, were significantly lower than those of salmon and sea eagles (bear 10
vs. salmon (δ13C):P <0.001; bear vs. salmon (δ15N): P <0.001; bear vs. sea eagle (δ13C):P <0.001; bear vs. sea eagle (δ15N):P <0.001). The stable isotope ratios in sea eagle droppings were the highest among the animals measured. Also, the contribu-tions of the other predators may impact re-export of nutrient from the ocean across the river basin; their role in marine derived nitrogen input and re-export, such as through 15
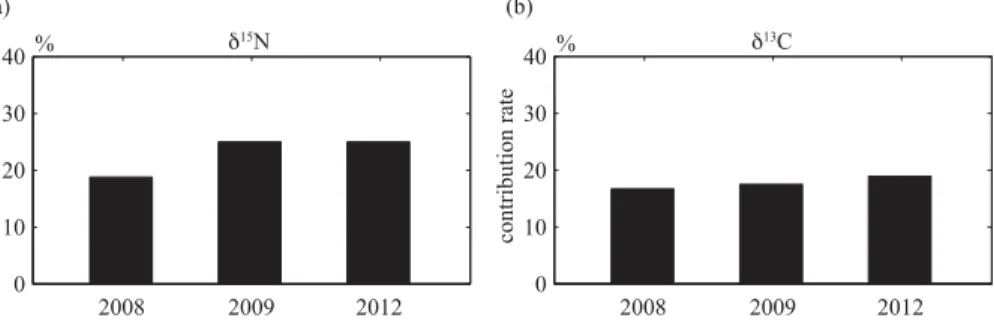
release of MDN-rich feces, should be investigated in more detail in future studies. The isotopic composition of salmon as representative of oceanic δ15N and δ13C were 10.99 and −20.54, respectively. The δ15N and δ13C of SSL were −3.19 and −29.48, respectively. Therefore, the three-year average estimate of the contribution of MDN to SOM for δ15N depending on the choice of terrestrial isotope values was 20
obtained e.g. 22.9 % (SD 3.6 %) by using a two sources mixing model. As the refer-ence, the three-year average estimate of the contribution of MDN to SOM for δ13C was 17.7 % (SD 1.1 %) (Fig. 4). Since annual export of TPN per unit area from the Rausu River Basin to the ocean was 454 kg km−2yr−1, annual re-export of TPN
orig-inally derived from the ocean is estimated to be 104 kg km−2yr−1 (
=454 kg km−2yr−1
25
* 22.9 %) (SD 16 kg km−2yr−1
=454 kg km−2yr−1
BGD
12, 5535–5557, 2015Estimation of nutrient contributions from
the ocean
K. Nakayama
Title Page
Abstract Introduction
Conclusions References
Tables Figures
◭ ◮
◭ ◮
Back Close
Full Screen / Esc
Printer-friendly Version Interactive Discussion
Discussion
P
a
per
|
Discussion
P
a
per
|
Discussion
P
a
per
|
Discussion
P
a
per
|
thus should be considered the minimum annual MDN re-export. The actual con-tribution of MDN to SOM may be more if we assume that TDN (160 kg km−2yr−1)
is re-exported with the same contribution as TPN; the contribution increases to 22.9 % ((104 (=454·22.9 %: TPN) +37 (=160·22.9 %: TDN)) kg km−2yr−1/614 (=TN) kg km−2yr−1
=141 kg km−2yr−1/614 kg km−2yr−1), which is similar to the annual
5
TN transported by chum and pink salmon per unit catchment area, 146 kg km−2yr−1
(Table 1).
5 Conclusions
In recent decades, field experiments and stable isotope analyses have been employed to understand the contribution of runs of salmon to river ecosystems. In river ecosys-10
tems, runs of salmon are thought to play a large role in the sustainability of nutrient circulation due to their contribution to mammals that incorporate MDN and disperse it across the entire river basin, with the MDN potentially re-exported to the ocean through river flows. In previous studies, the input of total nitrogen (TN) from the ocean to river basin ecosystems has been actively investigated, since it can control ecosystems in 15
which salmon run upstream for spawning, but the contribution of TN from the ocean across an entire river basin has not been examined in detail. This is despite the fact that waterfalls and the other obstacles, which inhibit runs of salmon are known to re-duce the transport of MDN upstream. Therefore, this study quantifies the role of salmon in transporting MDN across an entire river basin of the Shiretoko World Natural Her-20
itage area using stable isotope analysis.
Soil organic matter on the forest floor was investigated to understand the contribution of TN, which led to new understanding regarding the transportation potential of MDN by mammals, birds and insects. Contributions of MDN to SOM obtained from a two source mixing model based onδ13C orδ15N were almost the same using two different 25
BGD
12, 5535–5557, 2015Estimation of nutrient contributions from
the ocean
K. Nakayama
Title Page
Abstract Introduction
Conclusions References
Tables Figures
◭ ◮
◭ ◮
Back Close
Full Screen / Esc
Printer-friendly Version Interactive Discussion
Discussion
P
a
per
|
Discussion
P
a
per
|
Discussion
P
a
per
|
Discussion
P
a
per
|
was twice that for chum salmon, which suggests that pink salmon play a greater role in the input of TN across the Rausu River Basin.
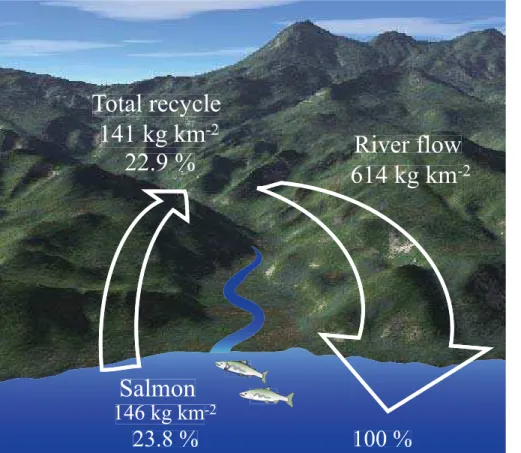
The contribution of nitrogen from the ocean across the river basin was 22.9 % (= 141 kg km−2yr−1/614 kg km−2yr−1), while the contribution of TN by salmon was 23.8 %
(SD 3.1 %). Therefore, the annual contribution of MDN to nitrogen may be between 5
22.9 % (=141 kg km−2yr−1) and 23.8 % (
=146 kg km−2yr−1), which provides valuable
support for a strong influence of MDN on the ecological systems across this river basin (Table 1 and Fig. 5).
Author contributions. K. Nakayama designed the field experiments and wrote most of the pa-per. Also, K. Nakayama performed mixing model analysis. Also, Y. Maruya produced the
fig-10
ures using the GIS technical input and carried out runoffanalysis. K. Komai helped the river discharge and nitrogen concentration analysis. M. Komata, and K. Komai measured total nitro-gen, dissolved total nitrogen and particulate total nitrogen. K. Matsumoto carried out the field experiments of salmon runs and conducted statistical analysis of stable isotopes. T. Kuwae designed the field experiment regarding stable isotopes and carried out stable isotope
mea-15
surements. All authors read and commented on drafts of this paper.
Acknowledgements. We wish to thank an anonymous reviewer for their constructive comments, which have contributed to a significant improvement of the manuscript. This work was sup-ported by a Grant-in-Aid for Scientific Research (B) (No. 24370016) from the Japan Society for the Promotion of Science (JSPS), Mitsui & Co., Ltd. Environment fund, and the Sumitomo
20
foundation. The data for this paper are available. Please contact to the corresponding author, Keisuke Nakayama, [email protected].
References
Alam, M. J. and Dutta, D.: A process-based and distributed model for nutrient dynam-ics in river basin: development, testing and applications, Ecol. Model., 247, 112–124,
25
doi:10.1016/j.ecolmodel.2012.07.031, 2012.
BGD
12, 5535–5557, 2015Estimation of nutrient contributions from
the ocean
K. Nakayama
Title Page
Abstract Introduction
Conclusions References
Tables Figures
◭ ◮
◭ ◮
Back Close
Full Screen / Esc
Printer-friendly Version Interactive Discussion
Discussion
P
a
per
|
Discussion
P
a
per
|
Discussion
P
a
per
|
Discussion
P
a
per
|
Ben-David, M., Flynn, R. W., and Schell, D. M.: Annual and seasonal changes in di-ets of martens: evidence from stable isotope analysis, Oecologia, 111, 280–291, doi:10.1007/s004420050236, 1997a.
Ben-David, M., Hanley, T. A., Klein, D. R., and Schell, D. M.: Seasonal changes in diets of coastal and riverine mink: the role of spawning Pacific salmon, Can. J. Zool., 75, 803–811,
5
doi:10.1139/z97-102, 1997b.
Ben-David, M., Hanley, T. A., and Schell, D. M.: Fertilization of terrestrial vegetation by spawning Pacific salmon: the role of flooding and predator activity, Oikos, 83, 47–55, 1998.
Bilby, R. E., Fransen, B. R., and Bisson, P. A.: Incorporation of nitrogen and carbon from spawn-ing coho salmon into the trophic system of small streams: evidence from stable isotopes,
10
Can. J. Fish. Aquat. Sci., 53, 164–173, doi:10.1139/f95-159, 1996.
Cederholm, C. J. and Peterson, N. P.: The retention of coho salmon (Oncorhynchus kisutch) carcasses by organic debris in small streams, Can. J. Fish. Aquat. Sci., 42, 1222–1225, doi:10.1139/f85-150, 1985.
Cederholm, C. J., Houston, D. B., Cole, D. I., and Scarlett, W. J.: Fate of coho salmon (
On-15
corhynchus kisutch) carcasses in spawning streams, Can. J. Fish. Aquat. Sci., 46, 1347– 1355, doi:10.1139/f89-173, 1989.
Chaloner, D. T., Wipfli, M. S., and Caouette, J. P.: Mass loss and macroinvertebrate colonization of Pacific salmon carcasses in southeastern Alaskan streams, Freshwater Biol., 47, 263– 273, doi:10.1046/j.1365-2427.2002.00804.x, 2002.
20
Donaldson, J. R.: The Phosphorus Budget of Iliamna Lake, Alaska, as Related to the Cyclic Abundance of Sockeye Salmon, Dissertation, University of Washington, Seattle, 1966. Dutta, D. and Nakayama, K.: Impacts of spatial data resolution in river flow simulation by
phys-ically based distributed modeling approach: a case study in Tsurumi River Basin, Japan, Hydrol. Process., 23, 534–545, doi:10.1002/hyp.7183, 2010.
25
Fry, B. J.: Stable Isotope Ecology, Springer Verlag, New York, 2006.
Gende, S. M., Edwards, R. T., Willson, M. F., and Wipfli, M. S.: Pacific salmon in aquatic and terrestrial ecosystems, BioScience, 52, 917–928, 2002.
Gende, S. M., Miller, A. E., and Hood, E.: The effects of salmon carcasses on soil nitro-gen pools in a riparian forest of southeastern Alaska, Can. J. For. Res., 37, 1194–1202,
30
doi:10.1139/X06-318, 2007.
BGD
12, 5535–5557, 2015Estimation of nutrient contributions from
the ocean
K. Nakayama
Title Page
Abstract Introduction
Conclusions References
Tables Figures
◭ ◮
◭ ◮
Back Close
Full Screen / Esc
Printer-friendly Version Interactive Discussion
Discussion
P
a
per
|
Discussion
P
a
per
|
Discussion
P
a
per
|
Discussion
P
a
per
|
the freshwater systems of the Pacific northwest, Fisheries, 25, 15–21, doi:10.1577/1548-8446(2000)025< 0015:AEOHAC> 2.0.CO;2, 2000.
Helfield, J. M. and Naiman, R. J.: Salmon and alder as nitrogen sources to riparian forests in a boreal Alaskan watershed, Oecologia, 133, 573–582, doi:10.1007/s00442-002-1070-x, 2002.
5
Hilderbrand, G. V., Hanley, T. A., Robbins, C. T., and Schwartz, C. C.: Role of brown bears (Ursus arctos) in the flow of marine nitrogen into a terrestrial ecosystem, Oecologia, 121, 546–550, doi:10.1007/s004420050961, 1999.
Hocking, M. D. and Reimchen, T. E.: Salmon species, density and watershed size predict mag-nitude of marine enrichment in riparian food webs, Oikos, 118, 1307–1318, 2009.
10
Hocking, M. D. and Reynolds, J. D.: Impacts of salmon on riparian plant diversity, Science, 331, 1609–1612, 2011.
Hokkaido National Fisheries Research Institute, Fisheries Research Agency: available at: http: //salmon.fra.affrc.go.jp/zousyoku/result/result.htm, 2009.
Hossler, K. and Bauer, J. E.: Estimation of riverine carbon and organic matter source
15
contributions using time-based isotope mixing models, J. Geophy. Res., 117, p. 15, doi:10.1029/2012JG001988, 2012.
Juday, C. W., Rich, H., Kemmerer, G. I., and Mann, A.: Limnological studies of Karluk Lake, Alaska, 1926–1930, Bull. U.S. Bur. Fish., 47, 407–436, 1932.
Kline Jr., T. C., Goering, J. J., Mathisen, O. A., Poe, P. H., and Parker, P. L.: Recycling of
20
elements transported upstream by runs of Pacific salmon: I. δ15N and δ13C evidence in Sashin Creek, southeastern Alaska, Can. J. Fish. Aquat. Sci., 47, 136–144, doi:10.1139/f90-014, 1990.
Kline Jr., T. C., Goering, J. J., Mathisen, O. A., Poe, P. H., Parker, P. L., and Scalan, R. S.: Recycling of elements transported upstream by runs of Pacific salmon. II.δ15N andδ13C
25
evidence in the Kvichak River watershed, Bristol Bay, southwestern Alaska, Can. J. Fish. Aquat. Sci., 50, 2350–2365, doi:10.1139/f93-259, 1993.
Kline Jr., T. C., Wilson, W. J., and Goering, J. J.: Natural isotope indicators of fish migration at Prudhoe Bay, Alaska, Can. J. Fish. Aquat. Sci., 55, 1494–1502, doi:10.1139/f98-012, 1998. Kuwae, T., Beninger, P. G., Decottignies, P., Mathot, K. J., Lund, D. R., and Elner, R. W.: Biofilm
30
BGD
12, 5535–5557, 2015Estimation of nutrient contributions from
the ocean
K. Nakayama
Title Page
Abstract Introduction
Conclusions References
Tables Figures
◭ ◮
◭ ◮
Back Close
Full Screen / Esc
Printer-friendly Version Interactive Discussion
Discussion
P
a
per
|
Discussion
P
a
per
|
Discussion
P
a
per
|
Discussion
P
a
per
|
Kuwae, T., Miyoshi, E., Hosokawa, S., Ichimi, K., Hosoya, J., Amano, T., Moriya, T., Kon-doh, M., Ydenberg, R. C., and Elner, R. W.: Variable and complex food web structures re-vealed by exploring missing trophic links between birds and biofilm, Ecol. Lett., 15, 347–356, doi:10.1111/j.1461-0248.2012.01744.x, 2012.
Larkin, G. A. and Slaney, P. A.: Implications of trends in marine-derived nutrient influx
5
to south coastal British Columbia salmonid production, Can. J. For. Res, 22, 16–24, doi:10.1577/1548-8446(1997)022<0016:IOTIMN>2.0.CO;2, 1997.
Levi, P. S. and Tank, J. L.: Nonnative Pacific salmon alter hot spots of sediment nitrification in Great Lakes tributaries, J. Geophy. Res., 118, 436–444, doi:10.1002/jgrg.20044, 2013. Makiguchi, Y., Nii, H., Nakao, K., and Ueda, H.: Upstream migration of adult chum and pink
10
salmon in the Shibetsu River, Hydrobiologia, 582, 43–54, doi:10.1007/s10750-006-0555-8, 2007.
Merz, J. E. and Moyle, P. B.: Salmon, wildlife, and wine: marine-derived nutrients in human-dominated ecosystems of central California, Ecol. Appl., 16, 999–1009, doi:10.1890/1051-0761, 2006.
15
Michael, J. B.: A storage-routing model relating drainage basin hydrology and geomorphology, Water Resour. Res., 14, 921–928, doi:10.1029/WR014i005p00921, 1978.
Michael, J. B., Pilgrim, D. H., and Cordery, I.: A storage routing model based on catchment geomorphology, J. Hydrol., 42, 209–230, doi:10.1016/0022-1694(79)90048-9, 1979.
Moore, J. W. and Schindler, D. E.: Nutrient export from freshwater ecosystems by
anadro-20
mous sockeye salmon (Oncorhynchus nerka), Can. J. Fish. Aquat. Sci., 61, 1582–1589,
doi:10.1139/F04-103, 2004.
Moore, J. W. and Semmens, B. X.: Incorporating uncertainty and prior information into sta-ble isotope mixing models, Ecol. Lett., 11, 470–480, doi:10.1111/j.1461-0248.2008.01163.x, 2008.
25
Moore, J. W., Schindler, D. E., Carter, J. L., Fox, J. M., Griffiths, J., and Holtgrieve, G. W.: Biotic control of stream ecosystem fluxes: spawning salmon drive nutrient and matter export, Ecology, 88, 1278–1291, 2007.
Naiman, R. J., Bilby, R. R., Schindler, D. E., and Helfield, J. M.: Pacific salmon, nutri-ents, and the dynamics of freshwater and riparian ecosystems, Ecosystems, 5, 399–417,
30
BGD
12, 5535–5557, 2015Estimation of nutrient contributions from
the ocean
K. Nakayama
Title Page
Abstract Introduction
Conclusions References
Tables Figures
◭ ◮
◭ ◮
Back Close
Full Screen / Esc
Printer-friendly Version Interactive Discussion
Discussion
P
a
per
|
Discussion
P
a
per
|
Discussion
P
a
per
|
Discussion
P
a
per
|
Nakayama, K., Aynur, A., Nakaegawa, T., and Maruya, Y.: Evaluation of nutrient flux from Shiretoko into the ocean using MRI-GCM, Hydrol. Res. Lett., 5, 47–51, doi:10.3178/hrl.5.47, 2011.
Reimchen, T. E.: Some ecological and evolutionary aspects of bear–salmon interactions in coastal British Columbia, Can. J. Zool., 78, 448–457, 2000.
5
Riggsbee, J. A., Orr, C. H., Leech, D. M., Doyle, M. W., and Wetzel, R. G.: Suspended sed-iments in river ecosystems: photochemical sources of dissolved organic carbon, dissolved organic nitrogen, and adsorptive removal of dissolved iron, J. Geophy. Res., 113, p. 12, doi:10.1029/2007JG000654, 2008.
Schindler, D. E., Scheuerell, M. D., Moore, J. W., Gende, S. M., Francis, T. B., and Palen, W. J.:
10
Pacific salmon and the ecology of coastal ecosystems, Front. Ecol. Environ., 1, 31–37, doi:10.1890/1540-9295, 2003.
Sponheimer, M., Robinson, T., Ayliffe, L., Passey, B., Roeder, B., Shipley, L., Lopez, E., Cer-ling, T., Dearing, D., and Ehleringer, J.: An experimental study of carbon-isotope fraction-ation between diet, hair, and feces of mammalian herbivores, Can. J. Zool., 81, 871–876,
15
doi:10.1139/Z03-066, 2003.
Szepanski, M. M., Ben-David, M., and Ballenberghe, V. V.: Assessment of anadromous salmon resources in the diet of the Alexander Archipelago wolf using stable isotope analysis, Oe-cologia, 120, 327–335, doi:10.1007/s004420050866, 1999.
Wilkinson, C. E., Hocking, M. D., and Reimchen, T. E.: Uptake of salmon-derived nitrogen by
20
mosses and liverworts in Coastal British Columbia, Oikos, 108, 85–98, 2005.
Wipfli, M. S., Hudson, J., and Caouette, J.: Influence of salmon carcasses on stream productiv-ity: response of biofilm and benthic macroinvertebrates in southeastern Alaska, USA, Can. J. Fish. Aquat. Sci., 55, 1503–1511, doi:10.1139/cjfas-55-6-1503, 1998.
Wyatt, A. S. J., Waite, A. M., and Humphries, S.: Variability in isotope discrimination factors in
25
coral reef fishes: implications for diet and food web reconstruction, PLoS ONE, 5, e13682, doi:10.1371/journal.pone.0013682, 2010a.
Wyatt, A. S. J., Lowe, R. J., Humphries, S., and Waite, A. M.: Particulate nutrient fluxes over a fringing coral reef: relevant scales of phytoplankton production and mechanisms of supply, Mar. Ecol.-Prog. Ser., 405, 113–130, doi:10.3354/meps08508, 2010b.
30
BGD
12, 5535–5557, 2015Estimation of nutrient contributions from
the ocean
K. Nakayama
Title Page
Abstract Introduction
Conclusions References
Tables Figures
◭ ◮
◭ ◮
Back Close
Full Screen / Esc
Printer-friendly Version Interactive Discussion
Discussion
P
a
per
|
Discussion
P
a
per
|
Discussion
P
a
per
|
Discussion
P
a
per
|
Table 1.Summary of annual export and re-export of nitrogen per unit area.
N re-export
N export Salmon run
(%a)
MDN input
(%b)
N kg y−1 N kg km−2y−1 N kg km−2y−1 N kg km−2y−1
TDN 5210 160 – 37 (22.9)
TPN 14 750 454 – 104 (22.9)
TN 19 960 614 146 (23.8) 141 (22.9)
a
=(Salmon run)/(N export). b
BGD
12, 5535–5557, 2015Estimation of nutrient contributions from
the ocean
K. Nakayama
Title Page
Abstract Introduction
Conclusions References
Tables Figures
◭ ◮
◭ ◮
Back Close
Full Screen / Esc
Printer-friendly Version Interactive Discussion
Discussion
P
a
per
|
Discussion
P
a
per
|
Discussion
P
a
per
|
Discussion
P
a
per
|
0 21 42 63 84
km
Study Area
Japan
Shiretoko Peninsula
Rausu River basin
BGD
12, 5535–5557, 2015Estimation of nutrient contributions from the ocean K. Nakayama Title Page Abstract Introduction Conclusions References Tables Figures ◭ ◮ ◭ ◮ Back Close
Full Screen / Esc
Printer-friendly Version Interactive Discussion Discussion P a per | Discussion P a per | Discussion P a per | Discussion P a per |
(a) (b) (c)
St.8 St.7St.9 St.1 St.6 St.5 St.4 St.3 St.2 St.10 St.13 St.15 St.17 St.21 St.19 St.18 St.16 St.14 St.20 St.12 St.11
soil sampling stations
St.0: discharge and nutrient observation station 0 1700 m m 5200 2600 3900 1300 0 m N
-30 -25 (‰)
St.8 St.7 St.9 St.1 St.6 St.5 St.4 St.3 St.2 St.10 St.13 St.15 St.17 St.21 St.19 St.18 St.16 St.14 St.20 St.12 St.11
soil sampling stations
5200 2600 3900 1300 0 m N St.8 St.7 St.9 St.1 St.6 St.5 St.4 St.3 St.2 St.10 St.13 St.15 St.17 St.21 St.19 St.18 St.16 St.14 St.20 St.12 St.11 N
soil sampling stations
5200 2600 3900 1300 0
m -2.5 -2.5 (‰)
BGD
12, 5535–5557, 2015Estimation of nutrient contributions from
the ocean
K. Nakayama
Title Page
Abstract Introduction
Conclusions References
Tables Figures
◭ ◮
◭ ◮
Back Close
Full Screen / Esc
Printer-friendly Version Interactive Discussion
Discussion
P
a
per
|
Discussion
P
a
per
|
Discussion
P
a
per
|
Discussion
P
a
per
|
-32
-30
-28
-26
-24
-22
-20
-18
-6
-4
-2
0
2
4
6
8
10
12
14
salmon (Oncorhynchus keta)
δ
13C
δ
15N
soil
bear (Ursus arctos)
bamboo grass (Sasa senanensis) sea eagle (Haliaeetus spp.) N = 53
N = 3
N = 7
N = 12
N = 8
BGD
12, 5535–5557, 2015Estimation of nutrient contributions from
the ocean
K. Nakayama
Title Page
Abstract Introduction
Conclusions References
Tables Figures
◭ ◮
◭ ◮
Back Close
Full Screen / Esc
Printer-friendly Version Interactive Discussion
Discussion
P
a
per
|
Discussion
P
a
per
|
Discussion
P
a
per
|
Discussion
P
a
per
|
2008 2009 2012
0 10 20 30
40% δ
15N
contribution rate
(a)
2008 2009 2012
0 10 20 30
40% δ
13C
contribution rate
(b)
Figure 4.Contribution of MDN from the ocean to the Rausu River basin in 2008, 2009 and 2012 using the two sources mixing model.(a)Average contributions of MDN based on SSL for
BGD
12, 5535–5557, 2015Estimation of nutrient contributions from
the ocean
K. Nakayama
Title Page
Abstract Introduction
Conclusions References
Tables Figures
◭ ◮
◭ ◮
Back Close
Full Screen / Esc
Printer-friendly Version Interactive Discussion
Discussion
P
a
per
|
Discussion
P
a
per
|
Discussion
P
a
per
|
Discussion
P
a
per
|