25
Journal of Engineering Science and Technology Review 1 (2008) 25- 27
Lecture Note
What is spinodal decomposition?
E. P. Favvas*
, 1and A. Ch. Mitropoulos
21Institute of Physical Chemistry, NCSR “Demokritos”, 153 10 Ag.Paraskevi, Attikis,Greece. 2Department of Petroleum Technology, Kavala Institute of Technology, 65 404 St.Lucas, Kavala, Greece.
Received 17 January 2008; Accepted 20 February 2008
___________________________________________________________________________________________
Abstract
Abstract: Phase separation may occur in a way that the growth is not in extent but in amplitude. Only in the unstable region such a procedure is thermodynamically feasible. In a phase diagram the unstable region is defined by the spinodal. When a system has crossed this locus, phase separation occurs spontaneously without the presence of a nucleation step. This process is known as spinodal decomposition and commonly results to a high interconnectivity of the two phases. The Cahn-Hilliard equation describes the kinetics of the process. In this note both processes (nucleation and spinodal) are depicted schematically.
Keywords: spinodal decomposition, nucleation and growth.
___________________________________________________________________________________________
Δ
Δ
−
Δ
=
Δ
Δ
Δ
β
β
(
+
)
+
=
Δ
β
Δ
Δ ∂ Δ ∂ Δ
∂ Δ
J
estr
JOURNAL OFEngineering Science and
Technology Review
www.jestr.org
______________
©
A pair of partially miscible liquids, i.e. liquids that do not
mix in all proportions at all temperatures, shows in a
tem-perature-composition diagram a miscibility gap where phase
separation occurs. Gibbs [1] showed that the condition for
stability (or metastability) in respect to continuous change of
phase is that the second derivative of the free energy of
mix-ing to be positive. If negative, the system is unstable. If zero,
the spinodal is defined. The free energy of mixing,
Δ
G
mix,
has the following general form:
mix mix
mix
H
T
S
G
=
Δ
−
Δ
Δ
.
(1)
For the regular solution model [2] the entropy of mixing is
the same as for the ideal mixing;
Δ
S
mix=-R(X
AlnX
A+XlnX
B),
where X
Aand X
Bare the molar fractions of components A
and B in the mixture (X
A+X
B=1). However, the enthalpy of
mixing may be written as
Δ
H
mix=X
AX
Bβ, where
β
is an
in-teraction parameter lumping the energy of mixing
contribu-tion [3]. Under these assumpcontribu-tions, eq.(1) becomes:
(
A A B B)
B A mix
X
X
X
X
RT
X
X
G
=
+
ln
+
ln
Δ
β
.
(2)
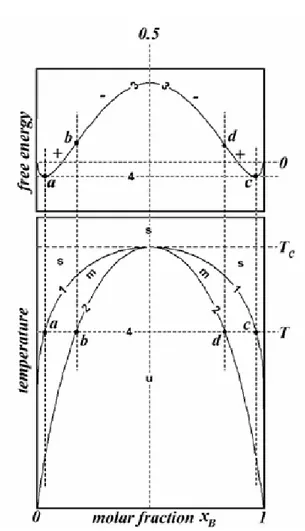
Figure 1. A phase diagram with a miscibility gap (lower frame) and a diagram of the free energy change (upper frame). The phase diagram is the temperature versus the molar fraction of a component e.g. xB. Note that the diagram is symmetrical around xB=0.5 which is the case of the regular solution model. Line (1) is the phase boundary. Above this line the two liquids are miscible and the system is stable (s). Below this line there is a metastable region (m). Within that region the system is stable to small fluctuations but is unstable to large fluctuations. Line (2) is the spinodal. Below this line the system is unstable (u). Regions (m) and (u) constitute the miscibility gap. Within that gap the system turns from one phase to a two-phase system. Temperature (Tc) is the upper consolute temperature. Above this temperature the two liquids are miscible in all proportions. At a given temperature (T) the tie line (4) cuts the phase boundary and the spinodal at points (a, c) and (b, d), respectively. The
changes in the free energy of mixing (ΔG), at this given temperature, in
respect to xB are shown by line (3) in the upper frame. Segments (ab) and (cd) correspond to a positive second derivative of ΔG, ∂2ΔG/xB2>0, while segment (bd) to a negative one, ∂2ΔG/xB2<0. At points (b) and (d)
∂2ΔG/xB2=0.
J
estr
______________
©
Δ
Δ
−
Δ
=
Δ
Δ
Δ
β
β
(
+
)
+
=
Δ
β
Δ
Δ ∂ Δ ∂ Δ
∂ Δ
J
estr
______________
* E-mail address: [email protected]
26
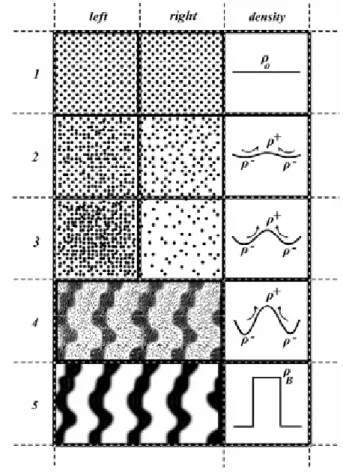
Figure 2 (left). The nucleation and growth process. The columns repre-sent two adjacent local regions in the solution denoted as “left” and “right” and the rows five stages of the system denoted by numbers 1, 2, 3, 4, 5; where the first three stages show what will happen when a small fluctuation occurs and the last two when a large fluctuation takes place. Black dots represent one of the two components e.g. B. In the 1st row the solution has been brought in to the metastable region and at themoment there is not difference in the local concentrations; CBleft=CBright.
In the 2nd row an infinitesimal fluctuation causes a concentration
differ-ence, such as CBleft>CBright, and therefore diffusion is expected to take
place between left and right localities. In the 3rd row the expected
diffu-sion results to CBleft=CBright. Diffusion takes place from left to right i.e. from higher to lower concentration (down-hill) and the system comes
back to what is depicted on the first row. In the 4th row a large
fluctua-tion causes the formafluctua-tion of a nucleus of a critical size. For presentafluctua-tion reasons, the figure was drawn such as all component B on the left region is spent to form that nucleus; therefore CBleft=0<CBright. Down-hill diffu-sion takes place now from right to left; note, that the higher concentra-tion is on the right, the nucleus does not intervene. Once some B
reach-es to the left is arrreach-ested by the nucleus that grows (5th row). Phase
sepa-ration occurring in this way is known as nucleation and growth and the fingerprint of that mechanism is the formation of a nucleus.
Figure 3 (right). The spinodal decomposition process. The columns denoted as “left” and “right” represent two adjacent local regions in the solution and the rows denoted by numbers “1, 2, 3, 4, 5,” represent five stages of the system. Black dots represent one of the two components e.g. B. Note that rows 4 and 5 represent some final stages of the process.
The drawing on the 4th row is produced by repeating the 3rd row to an
x-y plane. The 5th row is produced from the 4th row by artwork. The
col-umn denoted as “density” represents the density profile of the system at a given stage. In the 1st row the solution has been brought, very care-fully, in to the unstable region. This carefulness is shown in a way that there is not difference in the local concentrations; CBleft=CBright. Since there is not concentration gradient, no diffusion between left and right takes place; the solution remains at the moment one-phase system. The density of the system at this stage has a flat profile equal to an average value, let say ρο. In the 2nd row an infinitesimal fluctuation causes a concentration difference, such as CBleft>CBright, and therefore diffusion is expected to take place between left and right localities. The density of the system has now a wavy profile with maxima and minima around the average density. In the third row the expected diffusion process results to CBleft>>CBright, however. Diffusion does not take place from left to right i.e. from higher to lower concentration (downhill), but oppositely from right to left i.e. from lower to higher concentration (uphill). Note that if diffusion was taken place normally from left to right (downhill) it
would result to CBleft=CBright; i.e. the system would be gone back to what
is depicted on the first row. This can not be happened because is the case of a stable system; i.e. contradicts the initial statement that the system is already in the unstable region (compare also with Fig.2 to see the difference). The density is large in extent but small in degree; the arrows show the diffusion direction. As diffusion progresses the density increases until it reaches a point where becomes equal to the density of pure B (rows 3-5). Phase separation that occurs in this way is known as spinodal decomposition and the fingerprint of that mechanism is the uphill diffusion.
The miscibility-gap and spinodal-region boundaries are
ob-tained by calculating the first and second derivatives of the
free energy, respectively, and setting them equal to zero.
B A
B A
c
X
X
X
X
T
T
ln
ln
2
−
−
=
;
A Bc
X
X
T
T
4
=
;
R
T
c2
β
=
.
3)
(
In Fig.1 (upper frame) it can be seen that the first
deriva-tive is zero at the two free energy minima corresponding to
27
growth whereas if it is in the unstable region by spinodal
decomposition.
Figure 2 depicts the nucleation and growth mechanism
[4]. Gibbs (Ref.1 p.254) discussed the possibility of the
for-mation of a fluid of different phase within any homogeneous
fluid and showed that the work W required to form (by a
reversible process) an heterogeneous globule in the interior
of a very large mass having initially the uniform phase of the
exterior mass will be:
P
r
r
W
=
4
π
2γ
−
4
π
3Δ
3
,
(4)
where
γ
is the surface ten
d
Δ
P is the hydrostatic pressure. In the case where a
criti-sion, r is the radius of the nucleus,
an
cal nucleus is formed the first derivative of eq.(4) becomes
zero while the hydrostatic equilibrium is preserved;
Δ
P=2
γ
/r
crit, where r
critis the radius of the critical nucleus.
When r>r
critthe nucleus grows and when r<r
critit collapses
because the pressure exerted by the surface is greater than
Δ
P. By introducing r
critin eq.(4) the minimum work W
minrequired to form that critical nucleus is given as:
γ
π
24
r
=
.
min
3
crit(5)
Figure 3 depict
[5]. Cahn and Hilliard [6] utili e the van der Waals equation
W
s the spinodal decomposition mechanism
z
for the energy of binary mixture [7] to develop a model for
spinodal decomposition through Fick’s law of diffusion.
B B
D B
B
C
M
C
C
f
C
⎪⎧
⎛ ∂
2⎞
⎪⎫
∂
where ƒ is the free energy density of homogeneous material
of composition e.g. C
B, M is a positive constant [8], and
κ
is
a positive parameter. The first term on the right hand side of
eq.(6) is the classical diffusion equation where the
coeffi-cient of
∇
2C
Bis the diffusion coefficient D. Since M>0 the
sign of D will be determined by the sign of
∂
2ƒ/
∂
C
2B. When
∂
2ƒ/
∂
C
2B>0 the solution is stable, D>0, and diffusion (if any)
occurs downhill. When
∂
2ƒ/
∂
C
2B<0 the solution has crossed
the spinodal and is unstable, D<0, and diffusion takes place
uphill. It is noted, however, that the second term on the right
hand side of eq.(6) (i.e. the fourth-order term) stabilizes the
system against short distance scale fluctuations when
∂
2ƒ/
∂
C
2B<0. Uphill diffusion and consequently spinodal
de-composition requires a large enough distance scale
fluctua-tion (i.e. to move mass over long distances).
In this note an elementary review on the concept of
spi-nodal decomposition was given. The nucleation and growth
mechanism was also presented. Comparing the two
proc-esses it is evident that nucleation is large in degree and small
in extent while spinodal is small in degree and large in
ex-tent. In Fig.2 and 3 the evolution of the density profiles at
various stages of the processes was drawn. It is noted that
spinodal decomposition results to a high interconnectivity of
the two phases. However, the morphology of the resulted
separation is only an indication that spinodal decomposition
has taken place [9]. Nucleation may also produce high
inter-connectivity [10]. Besides, fractal morphology is possible to
be induced by both processes. For instance a fractal flake
that grows is an example of a fractally nucleation process
whereas a twin-dragon Peano curve that thickens is an
ex-ample of a fractally spinodal process [11].
M
t
4 2
2
∇
−
2
∇
⎪⎭
⎬
⎪⎩
⎨
⎟
⎟
⎠
⎜
⎜
⎝ ∂
=
∂
=
κ
,
(6)
______________________________
References
1. J.W.Gibbs, Collected Works, Yale University Press, New H pp.105-115 and pp.252-258 (1948).
ed, follow
t.Phys. 38, 707 (1985); V.M.Agishev and K.M.Yamaleev, yss.U.Zav. Fizika 10, 124 (1975); K.R.Mecke and V.Sofonea,
gstaff, and R.J.Charles, J.
Acknowledgments
: The authors would like to thank
Ar-chimedes research Project and INTERREG-III ‘Hybrid
Technology for separation’ for funding this work.
aven, J.Sta
Iz.V 2. E.A.Guggenheim, Proc.Roy.Soc.A 148, 304 (1935); J.B.Thompson,
Jr., in Researches in Geochemistry, Ed. by P.H.Abelson. John Wiley and Sons Inc., New York, Vol.2 p.340 (1967).
3. For the ideal solution the enthalpy of mixing is zero.
4. IUPAC definition of nucleation and growth: A process in a phase
transition in which nuclei of a new phase are first form ed by delingen der Koninklijke Nederlandsche Akademie van
Wetenschap-pen te Amsterdam 1, 1 (1893).
8. M is related to the interdiffusion coefficient. For a binary system JB=−M·∇(μB-μA), where J and μ are respectively the flux and the the propagation of the new phase at a faster rate; J.B.Clark,
J.W.Hastie, L.H.E.Kihlborg, R.Metselaar, and M.M.Thackeray, Pure App.Chem. 66, 577 (1994).
5. IUPAC definition of spinodal decomposition: A clustering reaction in a homogeneous, supersaturated solution (solid or liquid) which is un-stable against infinitesimal fluctuations in density or composition. The solution therefore separates spontaneously into two phases, starting with small fluctuations and proceeding with a decrease in the Gibbs energy without a nucleation barrier; ibid.
6. J.W.Chan and J.E.Hilliard, J.Chem.Phys. 28, 258 (1958).; J.W.Chan and J.E.Hilliard, J.Chem.Phys. 31, 688 (1959); see also J.W.Chan, J.Chem.Phys. 30, 1121 (1959); R.B.Heady and J.W.Chan, J.Chem.Phys. 58, 896 (1973); J.W.Cahn, Trans.A.IM.E. 242, 166 (1968); J.W.Cahn, Acta Met. 9, 795 (1961); J.W.Cahn and R.J.Charles, Phys.Chem. Glasses 6, 181 (1965); V.S.Stubican and A.H.Schultz, J. Amer. Cerum. Soc., 51 290 (1968); A.Noviek-Cohen,
Phys.Rev.E 56, R3761 (1997); J.Zhu, L-Q.Chen, J.Shen, and
V.Tikare, Phys.Rev.E 60, 3564 (1999); C.P.Grant,
Com-mun.Part.Differ.Eq. 18, 453 (1993).
7. J.D.van der Waals, The thermodynamic theory of capillarity flow under the hypothesis of a continuous variation in density,
Verhan-11.
chemical potential of e.g. the B component and M is the mechanical mobility. Changes in the concentration are given by taking the diver-gence of the flux: ∂CB/∂t=−∇·JB.
9. J.W.Cahn, J.Chem.Phys. 42, 93 (1965).
10. W.Haller, J.Chem.Phys. 42, 686 (1965); see also W.Haller, D.H.Blackburn, J.H.Simmons, F.E.Wa
Amer. Ceram. Soc. 53, 34 (1970); G.R.Srinivasan, I.Tweer, P.B.Macedo, A.Sarkar, and W.Haller, J.Non-Cryst. Solids 6, 221 (1971); W.Haller, D.H.Blackburn, and J.H.Simmons, J. Amer. Cerum. Soc., 57 126 (1974).
F.Katsaros, P.Makri. A.Ch.Mitropoulos, N.Kanellopoulos,
U.Keiderling, and A.Wiedenmann, Physica B 234-236, 402 (1997).
![THERMAL DECOMPOSITION AND STABILITY IN A SERIES OF HETEROBIMETALLIC CARBONYL COMPOUNDS OF THE TYPE [FE(CO)4 (HGX)2 ] (X=CL, BR, I)](data:image/gif;base64,R0lGODlhAQABAIAAAP///wAAACH5BAEAAAAALAAAAAABAAEAAAICRAEAOw==)