www.IJCSI.org 444
Classification rules for Indian Rice diseases
A.Nithya1 and Dr.V.Sundaram2
1
Asst
Coimbatore, Tamil Nadu, India.
Professor in Computer Applications, Nehru Arts and Science College,
2
Coimbatore,Tamil Nadu,India. Dr.V.Sundaram, Karpagam College of College,
Abstract
Many techniques have been developed for learning rules and relationships automatically from diverse data sets, to simplify the often tedious and error-prone process of acquiring knowledge from empirical data. Decision tree is one of learning algorithm which posses certain advantages that make it suitable for discovering the classification rule for data mining applications. Normally Decision trees widely used learning method and do not require any prior knowledge of data distribution, works well on noisy data .It has been applied to classify Rice disease based
on the symptoms. This paper intended to discover classification rules for the Indian rice diseases using the c4.5 decision trees algorithm. Expert systems have been used in agriculture since the early 1980s. Several systems have been developed in different countries including the USA, Europe, and Egypt for plant-disorder diagnosis, management and other production aspects. This paper explores what Classification rule can do in the agricultural domain.
Key words: Decision Trees, Pruning, Datamining, Classification, Expert System
1.Introduction
Decision trees have become one of the most powerful and popular approaches in knowledge discovery and data mining, the science and technology of exploring large and complex bodies of data in order to discover useful patterns. The area is of great importance because it enables modeling and knowledge extraction from the abundance of data available. The construction of decision tree classifiers does not require any domain Knowledge or parameter setting, and therefore is appropriate for exploratory Knowledge discovery. The Decision tree can handle high dimensional agricultural data. Their representation of acquired knowledge. The learning and classification steps of decision trees induction are simple and fast.
The transfer of experts from consultants and scientists to agriculturists, extends workers and farmers represent a bottleneck
www.IJCSI.org 445
fields work independently towards the same goal, as in the case of ID3 (Quinlan, 1986), a
machine learning scheme, and CART
(Breiman et al, 1984), standing for “classification and regression trees,” a statistical scheme. These methods both induce decision trees using essentially the same technique. Machine learning researchers also incorporate statistics into learning schemes directly, as in the case of
the Bayesian classification system AUTO
CLASS (Cheese man et al, 1988). C4.5
performs top down induction of Decision trees from a set of examples which have ach been given a classification (Quinlan, 1992). Typically, a training set will be specified by the user. The root of the tree specifies an attribute to be selected and tested first, and the subordinate nodes dictate tests on further attributes. The leaves are marked to show the classification of the object they represent. An information-theoretic heuristic is used to determine which attribute should be tested at each node, and the attribute that minimizes the entropy of the decision is chosen. C4.5 is a well-developed piece of software that derives from the earlier ID3 scheme (Quinlan, 1986), which itself evolved through several versions
2. The ID3 algorithm
According to [9], the ID3 algorithm is a decision tree building algorithm which determines classification of objects by testing values of their properties. It builds tree in top down fashion, starting from set of objects and specification of properties. At each node of tree, the properties tested and the result is used to partition data object set. The information theoretic heuristic is used to produce shallower trees by deciding an order in which to select attributes. The first stage in applying the information theoretic heuristic is to calculate the proportions of positive and negative training cases that are currently available at a node. In the case of the root node this is all the cases in the training set. A value
known as the information needed for the node is calculated using the following formula where p is the proportion of positive cases and q is the proportion of negative cases at the node:
-The basic algorithm of ID3
Examples S, each of which is descried by number of attributes along with the class attribute C, the basic pseudo code for the ID3 algorithm is:
If (all examples in S belong to class C) then make leaf labeled C
Else select the “most informative” attribute A Partition S according to A’s values (v1... vn)
Recursively construct sub-trees T1, T2... Tn for
each subset of S.
ID3 uses a statistical property, called information gain measure, to select among the candidates attributes at each step while growing the tree. To define the concept of information gain measure, it uses a measure commonly used in information theory, called entropy. The entropy is calculated by
Entropy (S) =
Where S is a set, consisting of s data samples, Pi is the portion of S belonging to the class i. Notice that the entropy is 0 when all members of S belong to the same class and the entropy is 1 when the collection contains an equal number of positive and negative examples. If the collection contains unequal numbers of positive and negative examples, the entropy is between 0 and 1. In all calculations involving entropy, the outcome of all calculations involving entropy, the outcome of (0 log2 0) is defined to be 0. With
www.IJCSI.org 446
v € Values (A)
i =1
c
n
J=1 j
Splitting Criterion
i) Information gain:
Gain (S, A) = Entropy (S) - ∑ ( | Sv | / | S | )
Entropy ( Sv
ii) Gain Ratio: )
Gain Ratio (S, A) Ξ Gain(S, A) / Split
Information (S, A)
Split Information (S, A) Ξ - ∑ (|Si|/ |S|) log2
(|Si
iii) Gini value: |/|S|)
Gini (D) = 1 - ∑ p2
Where pj is
Rice crop is one of the crops in India, due to its importance as the main food and for exporting. The rice cultivation area in India is approximately. Rice is the main grain crop of India. India ranks second in the world in production of rice. About 34% of the total cultivated area if the nation is under rice cultivation. Out of the total production of food grains, production of rice is 42%. Rice is cultivated in areas having annual average rainfall of 125 cm and average temperature of 23 degree Celsius. Major Rice cultivating areas are north east India, eastern and western coastal regions and river basin of Ganga. West Bengal, Punjab and Uttar Pradesh are the major rice producing states. Besides, Tamil Nadu, Karnataka, Orissa, Haryana, Bihar, Chhattisgarh, Assam and Maharashtra also produce rice. Many affecting diseases infect the Indian rice crop: some diseases are considered more important than others.In this case we focus into the most important diseases for example
“blast,” “helminthosporiose,” “stem rot” and “foot rot”.
Table1
relative frequency of class j in D
3. Data Domain
Attribute Possible Values
Variety Taichung-65, Jaya
(IET-723),rohini(PTB-36),Aswathi(PTB-37)
Age Possible Value
Part Leaves, leaves
spot,nodes.panicles,grains,p lant,flag leaves,leaf
sheath,stem
Appearance Spots,oval,fungal
Color Gray,olive,brown,brownish,
whitish,yellow
Temperature Real Values
Diseases Blast,” elminthosporiose,”
“stem rot” and “foot rot”, kernelsmut brown spot.
if appearance=spot and color =discolorthen disease =Kernel smut
if appearance=spot and color =brown<=age55
Then disease=brown-spot
4. Decision Tree Comparisons and Results
The decision tree classifier applied on the dataset uses three different splitting criteria namely
(i) Information Gain (ii)Gain Ratio (iii)Gini Index
www.IJCSI.org 447
varied. The complete results are provided below:
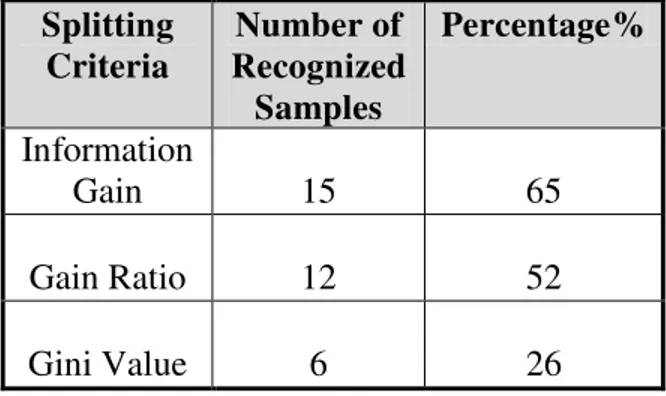
Table 2: Decision Tree’s splitting criteria comparison data.
Splitting Criteria
Number of Recognized Samples
Percentage%
Information
Gain 15 65
Gain Ratio 12 52
Gini Value 6 26
As the above results depict the fact that change in selection criteria of best attribute while constructing learning tree may change the performance of decision tree classifier. According to above shown results information gain has the highest performance over gain ratio and gini Index
splitting criteria. Below is the performance chart of three different splitting criterions drawn against the number of correctly recognized test samples.
Figure 1: Decision Trees splitting criteria comparison bar chart
5.Conclusion
The decision tree algorithm provides many benefits of trees over many other classifiers such as neural network. The most
important benefits are interpretability.
Moreover the c4.5 can effectively create comprehensive tree with greater predictive power and able to get a prediction error about 1.5% on data of test set. The enhancement in classification results over fitting error using pruning techniques and Handling the huge numbers of attribute values.
References
[1].Gilbert Saporta. Data Mining and
Official Statistics, Paper, Chaire de
Statistique Appliquée, Conservatoire
National des Arts et Métiers. 292 rue Saint Martin, Paris, 15 novembre 2000.
[2].a Sikandar, Haris Vohra, Syed Samad
Ahmed Bukhari, Faiz-ul-Haque Zeya’,
Decision Tree and Neural Network Classifier Performance Comparison using Canny Cancer Detector a Diagnosis Tool [3] Ying Lu, Jiawei Han, “Cancer
Classification Using Gene Expression
Data”, Information Systems vol. 28 issue 4, Elsevier Science Ltd., Oxford,UK, 2003, pp. 243 – 268.
[4]Patricia L.Dolan, Yang Wu, Linnea K. Ista, Robert L. Metzenberg, Mary Anne Nelson, Gabriel P. Lopez, “Robust and efficient synthetic method for forming DNA microarrays”, PubMed Central, Oxford University Press, USA, 2001.
Author Biographies
1. A.Nithya received her BSc degree in Computer Science from Bharathiar University and Msc, M.Phil degree in
Computer Science from Bharathiar
University. Currently doing PhD in
Karpagam University. She is currently working in Nehru Arts and Science College, Coimbatore, Tamilnadu, India. Her research
Interests include Data Mining, Data
www.IJCSI.org 448 2. Dr.V.Sundaram has more than 35 years
of teaching experience in Government & various Private Engineering Colleges. He
has published above 30 papers in