A Novel High-Throughput Method for
Molecular Detection of Human Pathogenic
Viruses Using a Nanofluidic Real-Time PCR
System
Coralie Coudray-Meunier1, Audrey Fraisse1, Sandra Martin-Latil1, Sabine Delannoy2, Patrick Fach2, Sylvie Perelle1*
1Université Paris-Est, ANSES, Food Safety Laboratory, Enteric viruses Unit, 14 rue Pierre et Marie Curie, 94701 Maisons-Alfort Cedex, France,2Université Paris-Est, ANSES, Food Safety Laboratory, Identypath, 14 rue Pierre et Marie Curie, 94701 Maisons-Alfort Cedex, France
Abstract
Human enteric viruses are recognized as the main causes of food- and waterborne dis-eases worldwide. Sensitive and quantitative detection of human enteric viruses is typically achieved through quantitative RT-PCR (RT-qPCR). A nanofluidic real-time PCR system was used to develop novel high-throughput methods for qualitative molecular detection qPCR array) and quantification of human pathogenic viruses by digital RT-PCR (RT-dPCR). The performance of high-throughput PCR methods was investigated for detecting 19 human pathogenic viruses and two main process controls used in food virology. The conventional real-time PCR system was compared to the RT-dPCR and RT-qPCR array. Based on the number of genome copies calculated by spectrophotometry, sensitivity was found to be slightly better with RT-qPCR than with RT-dPCR for 14 viruses by a factor range of from 0.3 to 1.6 log10. Conversely, sensitivity was better with RT-dPCR than with
RT-qPCR for seven viruses by a factor range of from 0.10 to 1.40 log10. Interestingly, the
number of genome copies determined by RT-dPCR was always from 1 to 2 log10lower than
the expected copy number calculated by RT-qPCR standard curve. The sensitivity of the RT-qPCR and RT-qPCR array assays was found to be similar for two viruses, and better with RT-qPCR than with RT-qPCR array for eighteen viruses by a factor range of from 0.7 to 3.0 log10. Conversely, sensitivity was only 0.30 log10better with the RT-qPCR array than
with conventional RT-qPCR assays for norovirus GIV detection. Finally, the RT-qPCR array and RT-dPCR assays were successfully used together to screen clinical samples and quantify pathogenic viruses. Additionally, this method made it possible to identify co-infec-tion in clinical samples. In conclusion, given the rapidity and potential for large numbers of viral targets, this nanofluidic RT-qPCR assay should have a major impact on human patho-genic virus surveillance and outbreak investigations and is likely to be of benefit to public health.
OPEN ACCESS
Citation:Coudray-Meunier C, Fraisse A, Martin-Latil S, Delannoy S, Fach P, Perelle S (2016) A Novel High-Throughput Method for Molecular Detection of Human Pathogenic Viruses Using a Nanofluidic Real-Time PCR System. PLoS ONE 11(1): e0147832. doi:10.1371/journal.pone.0147832
Editor:Naoya Sakamoto, Hokkaido University, JAPAN
Received:July 27, 2015
Accepted:January 8, 2016
Published:January 29, 2016
Copyright:© 2016 Coudray-Meunier et al. This is an open access article distributed under the terms of the Creative Commons Attribution License, which permits unrestricted use, distribution, and reproduction in any medium, provided the original author and source are credited.
Data Availability Statement:All relevant data are within the paper.
Funding:Coralie Coudray-Meunier was a PhD student who received financial support from ANSES (Agence Nationale de Sécurité Sanitaire de l'alimentation, de l'environnement et du travail).
Introduction
Human enteric viruses constitute a serious public health concern, since they are capable of causing a variety of acute illnesses, including the most commonly reported acute gastrointesti-nal illness. They are mainly transmittedviathe fecal-oral route either by person-to-person con-tact or by ingestion of contaminated water and food, particularly shellfish, soft fruits and vegetables. Enteric viruses are shed in enormous quantities in feces (109to 1010/g) and have an infectious dose on the order of tens to hundreds of virions. Enteric viruses are host-specific and are not capable of replicating in the environment, but they survive for long periods of time on food or food contact surfaces or in water (ground, surface, and drinking water) [1]. These char-acteristics enable enteric viruses to play a significant role in food- and waterborne outbreaks. Aside from noroviruses, which have been recognized as the largest cause of outbreaks, the viruses most often implicated in outbreaks include hepatitis viruses (hepatitis A virus and hep-atitis E virus), rotavirus, adenovirus (40, 41), astrovirus, enterovirus [2,3,4,5,6,7]. Additional viruses of lesser epidemiologic importance include human bocavirus, cosavirus, parvovirus, sapovirus, tick-borne encephalitis virus (TBEV), Aichi virus, and coronavirus [8,9,10,11].
Tools for rapid detection of viral pathogens are important for analyzing clinical, environ-mental and food samples. Detection of these enteric viruses based on their infectivity is compli-cated by the absence of a reliable cell culture method and the low levels of contamination of food and environmental samples [12,13]. To date, real time RT-PCR has been one of the most promising detection methods due to its sensitivity, specificity, and speed. Recently, the ISO/TS 15216–1 and 15216–2 standards covering real time RT-PCR for both quantitative determina-tion and qualitative detecdetermina-tion of NoV and HAV in foodstuffs were published [14,15,16].
The aim of this study was to develop real time RT-PCR assays for detection of a total of 19 human enteric viruses (including 3 genogroupes of norovirus and 4 coronaviruses) and two control process viruses (mengovirus and murine norovirus) generally used for monitoring the recovery of viral foodstuff extraction methods. Limits of detection of the viral genomes were determined with the conventional RT-qPCR system and with the Fluidigm’s BioMark System by using the qualitative nanofluidic real-time RT-PCR array and the quantitative digital RT-PCR array. The advantages of these new detection techniques were determined by detect-ing and quantifydetect-ing pathogenic viruses in clinical samples.
Methods
Viruses and cells
HAV strain HM175/18f, clone B (VR-1402), was obtained from the American Type Culture Collection (ATCC). This clone replicates rapidly and has cytopathic effects in cell culture [17]. HAV stock was produced by propagation in foetal rhesus monkey kidney (FRhK-4) cells (ATCC, CRL-1688) [18] and titrated by plaque assay [19]. The titer of viral production was established in HAV RNA genomic copies with an RT-qPCR standard curve obtained with the ten-fold dilutedin vitroRNA transcripts. Based on this approach, HAV stocks had titres of 9.33 x 10⁸genome copies / mL.
Mengovirus (strain MC0) was obtained from clarified supernatant provided by Dr. Albert Bosch from the“Enteric Virus Group”of the University of Barcelona. Mengovirus stock was produced by propagation in HeLa cells (ATCC, CCL-2™) [22]. The extracted RNA was con-firmed with RT-qPCR and quantified by measuring absorbance at 260 / 280 nm with a NanoDrop ND-1000. Based on this approach, the production stock of MNV-1 had titres of approximately 6.68 x 10¹¹genome copies / mL.
Rotavirus strain Wa (human rotavirus) was obtained from the Pasteur Institute (Paris, France) and was propagated in MA-104 rhesus monkey epithelial cell line (ATCC CRL-2378) [23]. The extracted RNA was confirmed with RT-qPCR and quantified by measuring absor-bance at 260 / 280 nm with a NanoDrop ND-1000. Based on this approach, the production stock of Wa had titres of approximately 3.21 x 10¹¹genome copies / mL.
Four viral strains were obtained from infected cell culture supernatants: two enterovirus strains (human B6 coxsackievirus (Schmitt strain: ATCC1
VR-1037AS/MK™) and human echovirus 19 (Burke strain)), one Adenovirus 40 strain (ATCC VR-931) and one Astrovirus GI strain.
Viruses and stools
The study was conducted in accordance with the ethics principles of the Declaration of Hel-sinki. Hepatitis A virus infection is a notifiable disease in France. The current system of manda-tory reporting was approved by the Commission Nationale de l’Informatique et des Libertés (deliberation n° 02–082, November 19 2002). Patients receive oral and written information on the finality of the notification and on the modalities of information recording. This informa-tion is available on line on the web site of the Institut de Veille Sanitaire (IVS) athttp://www. invs.sante.fr/content/download/6498/42945/version/2/file/fiche_info_patient.pdffor HAV samples and on the web site of the NRC atwww.cnr-ve.orgfor enteric virus samples. All clini-cal and biologiclini-cal parameters are treated anonymously. The virologiclini-cal surveillance of strain diversity is performed on stored samples obtained for hepatitis A diagnosis (no need for any additional blood draw). Diagnostic laboratories are asked to contribute to HAV and enteric virus strains surveillance by sending samples to the National Reference Centre (NRC). The study was not specifically approved by an ethics committee. Human samples were collected before the study and they are anonymously collected and analyzed.
The following human stool samples were provided by the National Reference Center (NRC) for Enteric Viruses (Dijon, France): adenovirus 41 (stool n°E5669), astrovirus GI (E4883), norovirus GI (E5486; E5569; E8050), norovirus GII (E6929; E6618; E7859; E7022; E6992), rotavirus (RV G12P8 = E7622; RV G1P8 = E8097), Aichi virus (E6841) and norovirus GII.13 + norovirus GIV.
The following human stool samples were provided by the National Reference Center (NRC) for HAV/HEV (Villejuif, France): HAV GIA (stools no. 780627147; 1181216151), HAV GIB (1280210015; 1280514230), HEV G3c (1280511146), HEV G3f (1280418084; 1280530128) and HEV G4 (1280615097; 1280522166).
The faecal samples were suspended in 1X Phosphate Buffered Saline (PBS), pH 7, to obtain a final 10% suspension (w/v), vortexed and centrifuged at 3000 g for 30 min at 4°C. Aliquots of 100μL supernatant were kept frozen at -80°C for later use.
The extracted genomic RNA/DNA of adenovirus, astrovirus and rotavirus were confirmed with RT-qPCR and quantified by measuring absorbance at 260 / 280 nm with a NanoDrop ND-1000.
DNA and RNA standards
Sequences from reference strains were inserted into recombinant plasmids (Table 1). The HEV, HAV, NoV GI and NoV GII cDNA were cloned in pGEM-T Easy vector (Promega, Charbonnières-les-Bains, France) and propagated inE.coliOne Shot1
TOP10F’(Life technol-ogies, Saint Aubin, France). High-quality DNA plasmids containing HAV or NoV regions were purified using the Qiagen Plasmid midi kit (Qiagen, Courtaboeuf, France) according to the manufacturer’s protocol. Then, NoV GI plasmid was digested with NCOI (Life technolo-gies), and HEV DNA, HAV DNA and NoV GII DNA plasmids were digested with SpeI (Life technologies) and transcripts were obtained by using a MEGAscript1kit (Life technologies) according to the manufacturer’s protocol. Synthesized RNA were treated with Turbo™DNase (Life technologies) according to the manufacturer’s protocol in order to remove the DNA tem-plate following transcription, and purified by using the MEGAclear™kit (Life technologies). The synthesized DNA and RNA were confirmed with (RT)-qPCR and quantified by measuring absorbance at 260 / 280 nm with a NanoDrop ND-1000 (Thermoscientific, Courtaboeuf, France) and the free software available on the“http://endmemo.com/bio/dnacopynum.php” website. Aliquots of 10μL containing 109genome copies /μL were kept frozen at -20°C for later use and used as standards.
Sapovirus, TBEV, norovirus GIV, Aichi virus, 229E, HKU1, cosavirus, OC43 and NL63 cDNA were cloned into the pBluescriptIISK+ vector by Genecust (Dudelange, Luxembourg). All recombinant plasmids were purified by Genecust and used to produce RNA transcripts. Sapovirus, TBEV, norovirus GIV, 229E, cosavirus and NL63 DNA plasmids (0.5μg) were digested withEcoRV (Life technologies) and Aichi virus, HKU1 and OC43 DNA plasmids were digested withSpeI (Life technologies).
Digested plasmids were transcribed by using the MEGAscript1
kit (Life technologies) according to the manufacturer’s protocol. Synthesized RNA was treated with Turbo™DNase (Life technologies) according to the manufacturer’s protocol in order to remove the DNA tem-plate following transcription, and purified by using the MEGAclear kit (Life technologies) according to manufacturer’s instructions. The synthesized RNA was confirmed with RT-qPCR and quantified by measuring absorbance at 260 / 280 nm with a Nanodrop ND-100 (Thermoscientific, France) and the free software available on the“http://endmemo.com/bio/ dnacopynum.php”website. RNA stocks were diluted to contain 109copies /μL. Aliquots of 10μL were kept frozen at -20°C for later use as standards.
Bocavirus and parvovirus cDNA were cloned into the pBluescriptIISK+ vector by Genecust (Dudelange, Luxembourg). Both recombinant plasmids were purified by Genecust. DNA plas-mids (0.5μg) were digested withSpeI (Life technologies) to be linearized. The synthesized DNA was confirmed with qPCR and quantified by measuring absorbance at 260 / 280 nm with a Nanodrop ND-100 (Thermoscientific, France) and the free software available on the “http://endmemo.com/bio/dnacopynum.php”website. DNA stocks were diluted to contain 109 copies /μL. Aliquots of 10μL were kept frozen at -20°C for later use as standards.
Nucleic acid extraction
Adenovirus 40, adenovirus 41, astrovirus, rotavirus, coxsackievirus B6, MNV-1, mengovirus, HAV (HM175/18f, HAV GIA and HAV GIB), HEV (HEV G3c, HEV G3G et HEV G4), NoV (GI, GII, GII+GIV), sapovirus, echovirus 19, Aichi virus, and astrovirus DNA or RNA were extracted using the NucliSens1
Adenovirus 41, astrovirus, rotavirus, coxsackievirus B6, MNV-1 and mengovirus DNA or RNA were confirmed with (RT)-qPCR and quantified by measuring absorbance at 260 / 280 nm with a NanoDrop ND-1000 (Thermoscientific, Courtaboeuf, France) and used as standards.
Extracted RNA from HAV (HM175/18f, HAV GIA and HAV GIB), HEV (HEV G3c, HEV G3G and HEV G4), NoV (GI, GII, GII+GIV), sapovirus, echovirus 19, Aichi virus, adenovirus 40 and astrovirus were quantified with (RT)-qPCR using standards (in vitrotranscripted RNA, plasmidic DNA, extracted genomic RNA).
Primers and probes
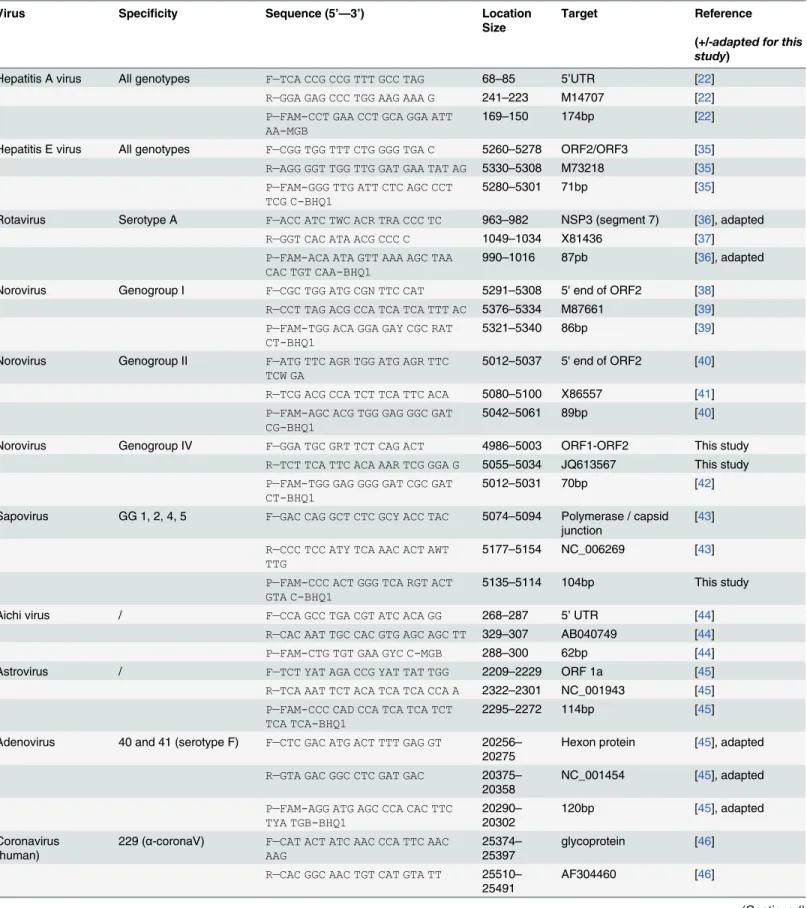
The primers and probes used to detect all the viruses of this study are described inTable 2. Those used to detect NoV GI, NoV GII, HAV and mengovirus are described in ISO/ TS 15216–1 / 15216–2 (2013). All the primers and probes were purchased from Life Technologies or Eurofins MWG Operon (Les Ulis, France).
RT-qPCR with the CFX96
™
real time PCR detection system
One-step RT-qPCR amplifications were performed on a CFX96™real time PCR detection sys-tem from Bio-Rad (Marnes-la-Coquette, France). Reactions were performed in a 15μL reaction mixture containing 1X of RNA UltraSense™master mix and 0.63μL of RNA Ultrasense™ enzyme mix, which are components of the RNA UltraSense™One-Step Quantitative RT-PCR System (Life technologies), 2 U RNAse inhibitor (Life technologies), 5μg of bovine serum albu-min (Life Technologies), 500 nM of forward primer, 900 nM of reverse primer, 250 nM of probe, and 5μL of RNA extract. A negative control containing all the reagents except the RNA template was included with each set of reaction mixtures.
The one-step RT-qPCR program involved 60 min reverse transcription of RNA at 55°C, fol-lowed by a 15 min denaturation step at 95°C, 45 cycles of 15 s at 95°C, 1 min at 60°C and 1 min at 65°C. Fluorescence was recorded by the apparatus at the end of the elongation steps (1 min-ute at 65°C) for each amplification cycle. All samples were characterised by a corresponding Ct value. Negative samples gave no Ct value. A standard curve for each target was generated with Table 1. GenBank accession number for viral sequences used to obtain recombinant plasmids.
Virus Reference sequence Position of the genomic sequence cloned Plasmid used
Hepatitis A virus M59808.1 39–518 pGEM-T Easy vector
Hepatitis E virus AB097812 5301–5371 pGEM-T Easy vector
Norovirus GI M87661 5257–5413 pGEM-T Easy vector
Norovirus GII X86557 4981–5135 pGEM-T Easy vector
Norovirus GIV JQ613567 4961–5140 pBluescriptIISK
Sapovirus NC_006269 5051–5200 pBluescriptIISK
Aichi virus AB040749 241–350 pBluescriptIISK
TBEV U27495 11031–11141 pBluescriptIISK
Parvovirus B19 AB550331 2221–2420 pBluescriptIISK
Cosavirus NC_012800 701–860 pBluescriptIISK
Bocavirus NC_012042 2511–2700 pBluescriptIISK
229E AF304460 25351–25530 pBluescriptIISK
HKU1 HM034837.1 28751–28940 pBluescriptIISK
NL63 JX504050 26191–26380 pBluescriptIISK
OC43 JN129835.1 28791–28940 pBluescriptIISK
Table 2. Primers and probes used in this study.(F: Forward; R: Reverse; P: Probe)
Virus Specificity Sequence (5’—3’) Location
Size
Target Reference
(+/-adapted for this study)
Hepatitis A virus All genotypes F—TCA CCG CCG TTT GCC TAG 68–85 5’UTR [22]
R—GGA GAG CCC TGG AAG AAA G 241–223 M14707 [22]
P—FAM-CCT GAA CCT GCA GGA ATT AA-MGB
169–150 174bp [22]
Hepatitis E virus All genotypes F—CGG TGG TTT CTG GGG TGA C 5260–5278 ORF2/ORF3 [35] R—AGG GGT TGG TTG GAT GAA TAT AG 5330–5308 M73218 [35]
P—FAM-GGG TTG ATT CTC AGC CCT TCG C-BHQ1
5280–5301 71bp [35]
Rotavirus Serotype A F—ACC ATC TWC ACR TRA CCC TC 963–982 NSP3 (segment 7) [36], adapted
R—GGT CAC ATA ACG CCC C 1049–1034 X81436 [37]
P—FAM-ACA ATA GTT AAA AGC TAA CAC TGT CAA-BHQ1
990–1016 87pb [36], adapted
Norovirus Genogroup I F—CGC TGG ATG CGN TTC CAT 5291–5308 5' end of ORF2 [38] R—CCT TAG ACG CCA TCA TCA TTT AC 5376–5334 M87661 [39]
P—FAM-TGG ACA GGA GAY CGC RAT CT-BHQ1
5321–5340 86bp [39]
Norovirus Genogroup II F—ATG TTC AGR TGG ATG AGR TTC TCW GA
5012–5037 5' end of ORF2 [40]
R—TCG ACG CCA TCT TCA TTC ACA 5080–5100 X86557 [41]
P—FAM-AGC ACG TGG GAG GGC GAT CG-BHQ1
5042–5061 89bp [40]
Norovirus Genogroup IV F—GGA TGC GRT TCT CAG ACT 4986–5003 ORF1-ORF2 This study
R—TCT TCA TTC ACA AAR TCG GGA G 5055–5034 JQ613567 This study
P—FAM-TGG GAG GGG GAT CGC GAT CT-BHQ1
5012–5031 70bp [42]
Sapovirus GG 1, 2, 4, 5 F—GAC CAG GCT CTC GCY ACC TAC 5074–5094 Polymerase / capsid junction
[43]
R—CCC TCC ATY TCA AAC ACT AWT TTG
5177–5154 NC_006269 [43]
P—FAM-CCC ACT GGG TCA RGT ACT GTA C-BHQ1
5135–5114 104bp This study
Aichi virus / F—CCA GCC TGA CGT ATC ACA GG 268–287 5’UTR [44]
R—CAC AAT TGC CAC GTG AGC AGC TT 329–307 AB040749 [44]
P—FAM-CTG TGT GAA GYC C-MGB 288–300 62bp [44]
Astrovirus / F—TCT YAT AGA CCG YAT TAT TGG 2209–2229 ORF 1a [45]
R—TCA AAT TCT ACA TCA TCA CCA A 2322–2301 NC_001943 [45]
P—FAM-CCC CAD CCA TCA TCA TCT TCA TCA-BHQ1
2295–2272 114bp [45]
Adenovirus 40 and 41 (serotype F) F—CTC GAC ATG ACT TTT GAG GT 20256– 20275
Hexon protein [45], adapted
R—GTA GAC GGC CTC GAT GAC 20375– 20358
NC_001454 [45], adapted
P—FAM-AGG ATG AGC CCA CAC TTC TYA TGB-BHQ1
20290– 20302
120bp [45], adapted
Coronavirus (human)
229 (α-coronaV) F—CAT ACT ATC AAC CCA TTC AAC AAG
25374– 25397
glycoprotein [46]
R—CAC GGC AAC TGT CAT GTA TT 25510– 25491
AF304460 [46]
Table 2. (Continued)
Virus Specificity Sequence (5’—3’) Location
Size
Target Reference
(+/-adapted for this study)
P—FAM-ATG AAC CTG AAC ACC TGA AGC CAA TCT ATG-BHQ1
25480– 25451
137bp [47]
HKU1 (β-coronaV) F—TCC TAC TAY TCA AGA AGC TAT CC 28775–
28797
phosphoprotein [46]
R—AAT GAA CGA TTA TTG GGT CCA C 28921–
28900
HM034837.1 [46]
P—FAM-TYC GCC TGG TAC GAT TTT GCC TCA-BHQ1
28808– 28831
147bp [47]
NL63 (α-coronaV) F—GTT CTG ATA AGG CAC CAT ATA GG 26215–
26237
phosphoprotein [46]
R—TTT AGG AGG CAA ATC AAC ACG 26357–
26337
JX504050 [46]
P—FAM-CGC ATA CGC CAA CGC TCT TGA ACA-BHQ1
26326– 26303
143bp [47]
OC43 (β-coronaV) F—CAT ACY CTG ACG GTC ACA ATA ATA
28812– 28835
glycoprotein [46]
R—ACC TTA GCA ACA GTC ATA TAA GC 28921–
28899
JN129835.1 [46]
P—FAM-TGC CAA AGA ATA GCC ART ACC TAG T-BHQ1
28889– 28865
110bp [47], adapted
Tick-born-encephalitis virus
European and Far-Eastern subtypes
F—GGG CGG TTC TTG TTC TCC 11054–
11071
3’NCR [48], adapted
R—ACW CAT CAC CTC CTT GTC AGA CT 11121–
11099
U27495 [48], adapted
P—FAM-TGA GCC ACC ATC ACC CAG ACA CA-BHQ1
11073– 11095
68bp [48], adapted
Parvovirus B19 F—CCC CGG GAC CAG TTC AGG 2241–2258 NS [49]
R—CCC CTY ACA CCR TCC CAC AC 2393–2374 AB550331 [49]
P—FAM-ATC ATY TGT CGG AAG CYC AGT TTC CTC CG-BHQ1
2262–2290 153bp [49]
Enterovirus / F—GCC CCT GAA TGC GGC 334–348 Polyprotein [50]
R—GAT TGT CAC CAT AAG CAG C 481–464 AJ295199 [51], adapted
P—FAM-CGG AAC CGA CTA CTT TGG GTG TCC GT-BHQ1
416–441 148pb [51]
Cosavirus / F—TTG TAG YGA TGC TGT RTG TGT
GTG
735–758 5’-UTR [52], adapted
R—CCA YTG TGT GGG TCC TTT CG 827–808 NC_012800 [52], adapted
P—FAM-CYC ACA GGC CRR AAG CCC TGT C-BHQ1
783–807 93bp [52], adapted
Bocavirus hBoV2 F—TCA GAC CAA GCG ACG AAG AC 2531–2550 GeneNP-1 [53]
R—CTC TAG CAA GYC TAG TAG AAT GCC
2675–2652 NC_012042 [53]
P—FAM-AAC CCA CAC CAT CCA GGA GCA TCT G-BHQ1
2646–2622 145bp [53]
MNV MNV-1 F—CCG CCA TGG TCC TGG AGA
ATG-3'
3193–3213 Polyprotein [54]
R—GCA CAA CGG CAC TAC CAA TCT TG-3'
3330–3308 DQ285629 [54]
P—FAM-CGT CGT CGC CTC GGT CCT TGT CAA-BHQ1
3227–3250 138bp [54]
synthesized RNA (HAV, HEV, NoV GI, NoV GII, NoV GIV, sapovirus, cosavirus, Aichi virus, human coronavirus (HKU1, 229E, NL63, OC43), TBEV), RNA extracts (rotavirus, astrovirus, enterovirus, MNV and mengovirus), synthesized DNA (parvovirus, bocavirus) or DNA extract (adenovirus) resulting from serial dilution in ultrapure water. The slopes (S) of the regression lines were used to calculate the amplification efficiency (E) of the RT-qPCR reactions, accord-ing to the formulaE= 10|-1/s|-1, to determine the RT-qPCR assay performance.
RT-dPCR with the BioMark System
Digital PCR works by partitioning a single sample into hundreds of individual PCR reactions. RT-dPCR amplifications were performed on a Fluidigm BioMark System by using qdPCR 37k IFC digital array microfluidic chips (Les Ulis, France). Utilizing nanoscale valves and channels, the Biomark Integrated Fluidic Circuit (IFC) controller partitions each of the 48 samples pre-mixed with PCR reagents into a panel of 770 PCR reaction chambers (i.e. 36,960 individual qPCR reactions on a digital array). By counting the number of positive reactions, the number of target molecules in each sample can be accurately estimated based on the Poisson distribution.
Reactions were performed in a 10μL reaction mixture containing 1X of RNA UltraSense™ master mix, 1X of ROX reference dye and 0.44μL of RNA Ultrasense™enzyme mix, which are components of the RNA UltraSense™One-Step Quantitative RT-PCR System (Life gies), 1X of 20X GE Sample Loading Reagent (Fluidigm), 2 U RNAse inhibitor (Life Technolo-gies), 500 nM of forward primer, 900 nM of reverse primer, 250 nM of probe, and 5.8μL of RNA extract. A negative control containing all the reagents except the RNA template was included with each set of reaction mixtures. 6μL out of ten reaction mix was charged onto the chip with the IFC controller MX, but 0.65μL were effectively partitioned into the 770 chambers of one panel, including 0.38μL of RNA extract.
The one-step RT-dPCR program involved 60 min reverse transcription of RNA at 55°C, fol-lowed by a 15 min denaturation step at 95°C, and lastly 45 cycles of 15 s at 95°C, 1 min at 60°C and 1 min at 65°C. Fluorescence was recorded by the apparatus at the end of the elongation steps (1 minute at 65°C) for each amplification cycle.
The Digital PCR Analysis software (Fluidigm) was used to count the number of positive chambers out of the total number of chambers per panel.
The Poisson distribution was used to estimate the average number of template copies per chamber in a panel [24,25]. All samples were characterised by a corresponding absolute quan-tity. No positive chambers were observed in negative samples.
RT-qPCR with the BioMark System
The 48.48 dynamic arrays were automatically loaded using an integrated fluidic circuit (IFC) controller (Fluidigm Corporation), and real-time reactions were performed and analyzed using Table 2. (Continued)
Virus Specificity Sequence (5’—3’) Location
Size
Target Reference
(+/-adapted for this study)
Mengovirus MC0 F—GCG GGT CCT GCC GAA AGT 5’NTR [55]
R—GAA GTA ACA TAT AGA CAG ACG CAC AC
/ [55]
P—FAM-ATC ACA TTA CTG GCC GAA GC-MGB
100bp [55]
a BioMark real-time PCR system and analysis software (Fluidigm Corporation), respectively. As a quality control, negative control samples were included on every array for each viral genome.
RT reactions were performed in a 25μL reaction mixture containing 1X of First-Strand Buffer, 10mM of DTT and 1μL of SuperScript1III RT enzyme, which are components of SuperScript1
III Reverse Transcriptase (Life technologies), 2 U RNAse inhibitor (Life technol-ogies), 2μM of Random hexamer (Life technologies), 200μM of dNTP (Life technologies), and 10μL of nucleic acids. A negative control containing all the reagents except the RNA template was included with each set of reaction mixtures. The RT program involved 5 min at 25°C, fol-lowed by 60 min at 55°C, and lastly 15 min at 70°C. Aliquots were kept frozen at -80°C for later use.
Preamplification reactions were performed in a 10μL reaction mixture containing 1X of SuperMix, a reagent of Perfecta Preamp SuperMix (Quanta), 0.2μl of 0.2X primer pool (1X = 500nM Forward and 900nM Reverse), and 5μL of cDNA. A negative control containing all the reagents except the cDNA template was included with each set of reaction mixtures. The preamplification program involved 10 min at 95°C, followed by 14 cycles of 15 s at 95°C and 4 min at 6°C. Immediately after the pre-amplification PCR, products were diluted (1:4) and stored at -80°C prior to use in qPCR.
For the qPCR array, 48 x 6μL reaction mixture containing 1X of RNA UltraSense™master mix, 1X of ROX reference dye and 0.27μL of RNA UltraSense™enzyme mix, which are compo-nents of the RNA UltraSense™One-Step Quantitative RT-PCR System (Life Technologies), 1X of 20X GE Sample Loading Reagent (Fluidigm) and 2.7μL of DNA extract were charged on the right part of the“48.48 Dynamic Array IFC”plate (BioMark). Negative controls containing all the reagents except the DNA template were included with each set of reaction mixtures. In addition, 48 x 5μl of a mix of 500 nM of forward primer, 900 nM of reverse primer and 250 nM of probe were deposited on the left part of the plate.
Nine nl of reaction volume mix were charged onto each of the 2304 chambers on the chip with the IFC controller MX.
The qPCR program involved a 15 min denaturation step at 95°C followed by 45 cycles of 15 s at 95°C, 1 min at 60°C and 1 min at 65°C. Fluorescence was recorded by the apparatus at the end of the elongation steps (1 minute at 65°C) for each amplification cycle. Negative samples gave no Ct value.
Results
Conventional RT-qPCR and nanofluidic PCR (RT-dPCR, RT-qPCR
array)
The sensitivity of conventional qPCR assays targeting 21 viral genomes was compared to the quantitative digital RT-PCR array and to the qualitative nanofluidic real-time PCR array per-formed on Fluidigm’s BioMark System.
Quantitative detection by conventional and digital real time RT-PCR
assays
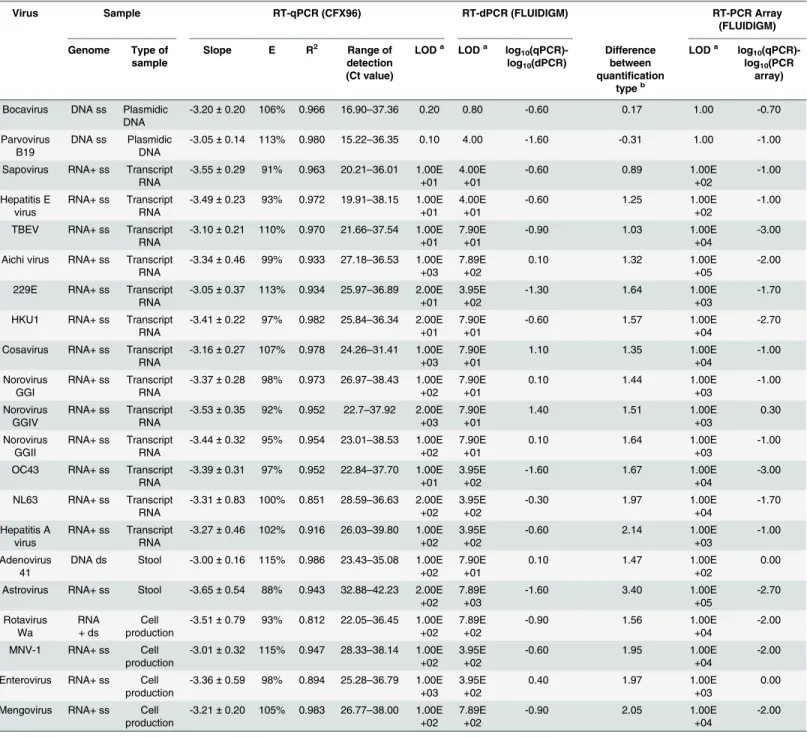
The expected numbers of genome copies calculatedviathe standard curve by RT-qPCR were close to the direct measurement of the target concentrations by RT-dPCR only by testing DNA from plasmids. By testing RNA transcripts, the numbers of genome copies as determined by direct RT-dPCR measurement of the target concentrations were 0.9 to 2.1 log10lower than Table 3. Comparison of RT-qPCR, RT-dPCR and RT-PCR array assays.Characteristics of standard curves based on the RT-qPCR assays and limit of detection (LOD) of viral targets by RT-qPCR, by RT-dPCR and RT-PCR array assays. The differences between relative quantification (by RT-qPCR) and absolute quantification (by RT-dPCR) were indicated.
Virus Sample RT-qPCR (CFX96) RT-dPCR (FLUIDIGM) RT-PCR Array
(FLUIDIGM)
Genome Type of sample
Slope E R2 Range of
detection (Ct value)
LODa LODa log 10
(qPCR)-log10(dPCR)
Difference between quantification
typeb
LODa log 10
(qPCR)-log10(PCR
array)
Bocavirus DNA ss Plasmidic DNA
-3.20±0.20 106% 0.966 16.90–37.36 0.20 0.80 -0.60 0.17 1.00 -0.70
Parvovirus B19
DNA ss Plasmidic DNA
-3.05±0.14 113% 0.980 15.22–36.35 0.10 4.00 -1.60 -0.31 1.00 -1.00
Sapovirus RNA+ ss Transcript RNA
-3.55±0.29 91% 0.963 20.21–36.01 1.00E +01
4.00E +01
-0.60 0.89 1.00E
+02
-1.00
Hepatitis E virus
RNA+ ss Transcript RNA
-3.49±0.23 93% 0.972 19.91–38.15 1.00E +01
4.00E +01
-0.60 1.25 1.00E
+02
-1.00
TBEV RNA+ ss Transcript RNA
-3.10±0.21 110% 0.970 21.66–37.54 1.00E +01
7.90E +01
-0.90 1.03 1.00E
+04
-3.00
Aichi virus RNA+ ss Transcript RNA
-3.34±0.46 99% 0.933 27.18–36.53 1.00E +03
7.89E +02
0.10 1.32 1.00E
+05
-2.00
229E RNA+ ss Transcript RNA
-3.05±0.37 113% 0.934 25.97–36.89 2.00E +01
3.95E +02
-1.30 1.64 1.00E
+03
-1.70
HKU1 RNA+ ss Transcript RNA
-3.41±0.22 97% 0.982 25.84–36.34 2.00E +01
7.90E +01
-0.60 1.57 1.00E
+04
-2.70
Cosavirus RNA+ ss Transcript RNA
-3.16±0.27 107% 0.978 24.26–31.41 1.00E +03
7.90E +01
1.10 1.35 1.00E
+04
-1.00
Norovirus GGI
RNA+ ss Transcript RNA
-3.37±0.28 98% 0.973 26.97–38.43 1.00E +02
7.90E +01
0.10 1.44 1.00E
+03
-1.00
Norovirus GGIV
RNA+ ss Transcript RNA
-3.53±0.35 92% 0.952 22.7–37.92 2.00E +03
7.90E +01
1.40 1.51 1.00E
+03
0.30
Norovirus GGII
RNA+ ss Transcript RNA
-3.44±0.32 95% 0.954 23.01–38.53 1.00E +02
7.90E +01
0.10 1.64 1.00E
+03
-1.00
OC43 RNA+ ss Transcript RNA
-3.39±0.31 97% 0.952 22.84–37.70 1.00E +01
3.95E +02
-1.60 1.67 1.00E
+04
-3.00
NL63 RNA+ ss Transcript RNA
-3.31±0.83 100% 0.851 28.59–36.63 2.00E +02
3.95E +02
-0.30 1.97 1.00E
+04
-1.70
Hepatitis A virus
RNA+ ss Transcript RNA
-3.27±0.46 102% 0.916 26.03–39.80 1.00E +02
3.95E +02
-0.60 2.14 1.00E
+03
-1.00
Adenovirus 41
DNA ds Stool -3.00±0.16 115% 0.986 23.43–35.08 1.00E +02
7.90E +01
0.10 1.47 1.00E
+02
0.00
Astrovirus RNA+ ss Stool -3.65±0.54 88% 0.943 32.88–42.23 2.00E +02
7.89E +03
-1.60 3.40 1.00E
+05 -2.70 Rotavirus Wa RNA + ds Cell production
-3.51±0.79 93% 0.812 22.05–36.45 1.00E +02
7.89E +02
-0.90 1.56 1.00E
+04
-2.00
MNV-1 RNA+ ss Cell production
-3.01±0.32 115% 0.947 28.33–38.14 1.00E +02
3.95E +02
-0.60 1.95 1.00E
+04
-2.00
Enterovirus RNA+ ss Cell production
-3.36±0.59 98% 0.894 25.28–36.79 1.00E +03
3.95E +02
0.40 1.97 1.00E
+03
0.00
Mengovirus RNA+ ss Cell production
-3.21±0.20 105% 0.983 26.77–38.00 1.00E +02
7.89E +02
-0.90 2.05 1.00E
+04
-2.00
aLOD expressed as number of genome copies/μl of nucleic acids. bformula = [log
10(OD)-log10(digital)].
the expected copy numbers calculatedviathe standard curve by RT-qPCR. Similarly, by testing genomes from viruses in stools and RNA from virus production in cells, the limit of detection (LOD) as determined by RT-dPCR was respectively 1.5 to 3.4 log10and 1.6 to 2.1 log10lower than the expected copy numbers calculatedviathe standard curve by RT-qPCR.
Sensitive and accurate detection by RT-qPCR array
The potential of the RT-PCR array for sensitive detection was assessed on a dilution series of 21 viral genomes (Table 3). The limits of detection obtained with RT-qPCR array assays ranged from 1 to 103genome copies /μl of RNA / DNA extracts for 11 viruses and from 104to 105 genome copies /μl of RNA extracts for the others. RT-qPCR array assays commonly showed a slightly lower sensitivity than conventional RT-qPCR. The sensitivity of both RT-qPCR and RT-qPCR array assays was found to be similar for two viruses (enterovirus, adenovirus 41), and was slightly better with the RT-qPCR than with the RT-qPCR array for 18 viruses by a fac-tor ranging from 0.7 to 3.0 log10. Conversely, sensitivity was only 0.3 log10higher with the RT-qPCR array than with conventional RT-RT-qPCR assays for norovirus GIV detection.
Viral screening by RT-qPCR array and quantitative detection of clinical
samples by RT-dPCR
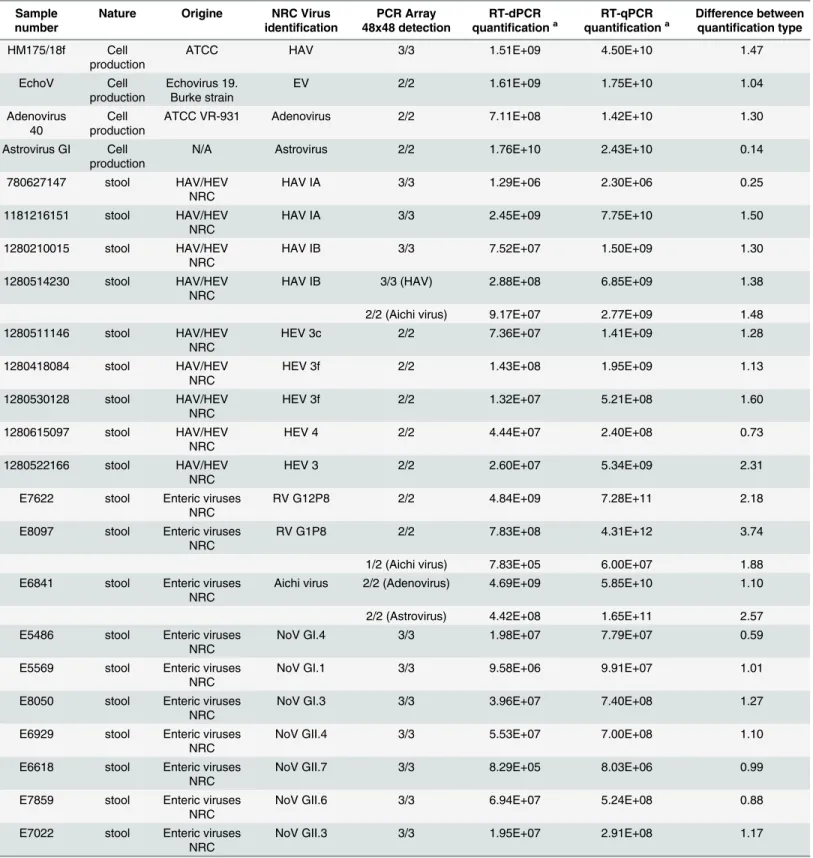
The nanofluid-based (RT)-PCR assays developed were applied to characterize 25 samples (4 culture supernatants and 21 clinical samples previously characterized by NRC) for detection of hepatitis (HAV, HEV) and enteric virus genomes. First, the samples were tested on the RT-PCR array to perform a qualitative screening of the 19 viral genomes. Then the viral-posi-tive samples were specifically quantified by RT-dPCR and by conventional RT-qPCR. Results are shown onTable 4.
RT-qPCR array assays detected the previously determined viruses in 100% of the samples. Furthermore, positivity for more than one virus was found in two clinical samples. A stool pre-viously identified as positive for HAV IB was found positive for HAV and Aichi virus and a stool identified as positive for Aichi virus was found positive for Aichi virus, adenovirus and astrovirus. The stool previously identified as co-infected by NoV GII.13 and NoV GIV was confirmed positive for both viruses.
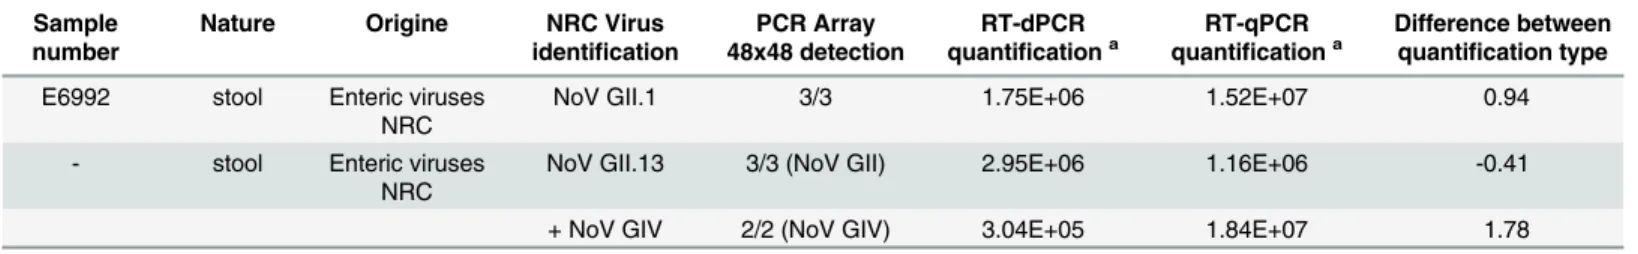
Following the viral screening of 25 samples, the 29 detected viral genomes were successfully quantified by both RT-qPCR and RT-dPCR. The number of genome copies determined for 28 viruses was lower by RT-dPCR with a difference of quantification comprised between 0 and 1 log10for 7 out of the 29 samples (24%), between 1 and 2 log10for 17 out of the 29 samples (59%) and higher than 2 log10for 4 out of the 29 samples (14%). So the numbers of genome copies calculated by absolute quantification (RT-dPCR) were lower than the expected numbers of genome copies calculated by using standard curve of RT-qPCR except in the sample co-infected with NoV GII and NoV GIV. In the latter sample, the NoV GII quantification was 0.4 log10higher by RT-dPCR than by the RT-qPCR assays (1 out of the 29 samples,i.e. 3%).
Discussion
Table 4. Screening and viral quantification in clinical samples (stools and viral supernatants from cell culture) by RT-qPCR and novel nanofuidic approaches (RT-qPCR and RT-dPCR).Samples were firstly screened by RT-PCR array and then quantified by RT-dPCR. Absolute viral quantification (by RT-dPCR) was compared to relative quantification (by RT-qPCR).
Sample number
Nature Origine NRC Virus
identification
PCR Array 48x48 detection
RT-dPCR quantificationa
RT-qPCR quantificationa
Difference between quantification type
HM175/18f Cell production
ATCC HAV 3/3 1.51E+09 4.50E+10 1.47
EchoV Cell
production
Echovirus 19. Burke strain
EV 2/2 1.61E+09 1.75E+10 1.04
Adenovirus 40
Cell production
ATCC VR-931 Adenovirus 2/2 7.11E+08 1.42E+10 1.30
Astrovirus GI Cell production
N/A Astrovirus 2/2 1.76E+10 2.43E+10 0.14
780627147 stool HAV/HEV
NRC
HAV IA 3/3 1.29E+06 2.30E+06 0.25
1181216151 stool HAV/HEV NRC
HAV IA 3/3 2.45E+09 7.75E+10 1.50
1280210015 stool HAV/HEV NRC
HAV IB 3/3 7.52E+07 1.50E+09 1.30
1280514230 stool HAV/HEV NRC
HAV IB 3/3 (HAV) 2.88E+08 6.85E+09 1.38
2/2 (Aichi virus) 9.17E+07 2.77E+09 1.48
1280511146 stool HAV/HEV NRC
HEV 3c 2/2 7.36E+07 1.41E+09 1.28
1280418084 stool HAV/HEV NRC
HEV 3f 2/2 1.43E+08 1.95E+09 1.13
1280530128 stool HAV/HEV NRC
HEV 3f 2/2 1.32E+07 5.21E+08 1.60
1280615097 stool HAV/HEV NRC
HEV 4 2/2 4.44E+07 2.40E+08 0.73
1280522166 stool HAV/HEV NRC
HEV 3 2/2 2.60E+07 5.34E+09 2.31
E7622 stool Enteric viruses NRC
RV G12P8 2/2 4.84E+09 7.28E+11 2.18
E8097 stool Enteric viruses NRC
RV G1P8 2/2 7.83E+08 4.31E+12 3.74
1/2 (Aichi virus) 7.83E+05 6.00E+07 1.88
E6841 stool Enteric viruses NRC
Aichi virus 2/2 (Adenovirus) 4.69E+09 5.85E+10 1.10
2/2 (Astrovirus) 4.42E+08 1.65E+11 2.57
E5486 stool Enteric viruses NRC
NoV GI.4 3/3 1.98E+07 7.79E+07 0.59
E5569 stool Enteric viruses NRC
NoV GI.1 3/3 9.58E+06 9.91E+07 1.01
E8050 stool Enteric viruses NRC
NoV GI.3 3/3 3.96E+07 7.40E+08 1.27
E6929 stool Enteric viruses NRC
NoV GII.4 3/3 5.53E+07 7.00E+08 1.10
E6618 stool Enteric viruses NRC
NoV GII.7 3/3 8.29E+05 8.03E+06 0.99
E7859 stool Enteric viruses NRC
NoV GII.6 3/3 6.94E+07 5.24E+08 0.88
E7022 stool Enteric viruses NRC
NoV GII.3 3/3 1.95E+07 2.91E+08 1.17
needed for their surveillance in the environment, food samples and for outbreak investigations [28].
Microfluidic digital PCR (RT-dPCR) is an accurate endpoint-sensitive absolute quantifica-tion approach that makes it possible to determine the number of target copies without a stan-dard curve. Digital PCR ((RT)-dPCR) was compared to real-time (RT)-PCR for quantifying 19 human enteric viruses and two control process viruses. For detecting viral RNA and cDNA, RT-dPCR assays were often found to be comparable in terms of sensitivity to RT-qPCR.
The number of RNA genome copies determined by digital RT-PCR was often lower than the number of copies expected using spectrophotometry. One potential cause of discrepancy between relative and absolute quantification could be errors introduced by spectrophotometric determination of the nucleic acid concentration, leading to an overestimation of the copy genome number [29,30]. This could explain why samples from viral stocks and stools poten-tially containing cellular genomes (non-target RNA) and degraded (non-amplified) targets were particularly affected by quantification discrepancies. Both quantification methods were close when DNA targets were tested. One other potential cause of discrepancy might be the RT step, which is not 100% effective, so that all the RNA may not be transcribed into cDNA and therefore is not quantified by the digital PCR.
Digital RT-PCR may provide more accurate measurements than RT-qPCR, as it is not dependent on amplification efficiency. Moreover, the advantage of this novel technology is that it is more tolerant to inhibitory substances and may reduce the difficulty of quantifying viruses when inhibitors linked to the matrix-type components analysed in food or environmental virology are present [31,32,33].
Recent innovations in PCR miniaturization made it possible to conduct high-throughput qPCR in which the reactional volumes are reduced to a nanolitre, leading to a decrease in the cost per assay per sample. Recently, a microfluidic quantitative PCR (MFQPCR) system was developed to simultaneously quantify 11 major human viral pathogens and two process con-trols (murine norovirus, mengovirus). This system included a specific target amplification (STA) reaction to increase the amount of target genes prior to MFQPCR [34]. In this study, the RT-qPCR array assays were developed and enabled simultaneous detection of 48 samples with 22 targeted virus assays. The preamplification step was also necessary because low amounts of target molecules had to be detected in very small volumes of reaction (9nl). Thus, RT-qPCR array assays involve three separate steps (RT, preamplification and PCR).
Nineteen enteric viruses and two control process viruses (MNV and mengovirus) were tar-geted. The sensitivity of the RT-qPCR array assays was lower (by 0.8 to 3.8 log10) than the lim-its of detection obtained with conventional RT-qPCR and RT-dPCR. However, all the clinical samples tested with the RT-qPCR array assays were identified and matched the NRC results. Table 4. (Continued)
Sample number
Nature Origine NRC Virus
identification
PCR Array 48x48 detection
RT-dPCR quantificationa
RT-qPCR quantificationa
Difference between quantification type
E6992 stool Enteric viruses NRC
NoV GII.1 3/3 1.75E+06 1.52E+07 0.94
- stool Enteric viruses NRC
NoV GII.13 3/3 (NoV GII) 2.95E+06 1.16E+06 -0.41
+ NoV GIV 2/2 (NoV GIV) 3.04E+05 1.84E+07 1.78
aexpressed as number of genome copies/g (stools) or genome copies/mL (cell production).
Moreover, two stools contained more than one viral genome, and these results completed the NRC analysis. This assay is therefore useful for rapid sample screening.
In conclusion, a combination of RT-qPCR array and RT-dPCR assays could be applied to screen contaminated samples and quantify pathogenic viruses in case of outbreaks investiga-tion and surveillance. The choice of techniques should take into account the aim of analysis, the number of targets involved and the analytical costs. To date, the RT-qPCR array includes enteric viruses frequently reported as the causes of foodborne outbreaks and some additional viruses of lesser epidemiologic importance. In future, this technology could be updated by extending the range of viral targets to gain information during epidemiological studies. For this purpose, BioMark real-time PCR system (Fluidigm) can be also used for high-throughput microfluidic real-time PCR amplification with 96.96 dynamic arrays (Fluidigm) leading to an increase of detected targets. Concerning RT-dPCR assays, it could be helpful for standardizing the quantification of enteric viruses in samples and might be extended to the quantification of other human microbiological pathogens in foods.
Acknowledgments
We thank AM Roque (NRC for hepatitis A virus, France) and P Pothier (NRC for Enteric Viruses, France) for providing contaminated stools. This work is part of the thesis by Coralie Coudray-Meunier, a PhD student who received financial support from ANSES.
Author Contributions
Conceived and designed the experiments: CCM AF SML SD PF SP. Performed the experi-ments: CCM AF SD. Analyzed the data: CCM AF SML SD PF SP. Contributed reagents/mate-rials/analysis tools: CCM AF SML SD PF SP. Wrote the paper: CCM AF SML SD PF SP.
References
1. Kotwal G, Cannon JL. Environmental persistence and transfer of enteric viruses. Curr Opin Virol. 2014; 4C: 37–43.
2. Gibson KE. Viral pathogens in water: occurrence, public health impact, and available control strategies. Curr Opin Virol. 2014; 4: 50–57. doi:10.1016/j.coviro.2013.12.005PMID:24440908
3. Koo HL, Ajami N, Atmar RL, DuPont HL. Noroviruses: The leading cause of gastroenteritis worldwide. Discov Med. 2010; 10: 61–70. PMID:20670600
4. Matthews JE, Dickey BW, Miller RD, Felzer JR, Dawson BP, Lee AS, et al. The epidemiology of pub-lished norovirus outbreaks: a review of risk factors associated with attack rate and genogroup. Epide-miol Infect. 2012; 140: 1161–1172. doi:10.1017/S0950268812000234PMID:22444943
5. Nainan OV, Xia G, Vaughan G, Margolis HS. Diagnosis of hepatitis a virus infection: a molecular approach. Clin Microbiol Rev. 2006; 19: 63–79. PMID:16418523
6. Van der Poel WHM. Food and environmental routes of Hepatitis E virus transmission. Curr Opin Virol. 2014; 4: 91–96. doi:10.1016/j.coviro.2014.01.006PMID:24513966
7. Vaughan G, Goncalves Rossi LM, Forbi JC, de Paula VS, Purdy MA, Xia G, et al. Hepatitis A virus: Host interactions, molecular epidemiology and evolution. Infect Genet Evol. 2014; 21C: 227–243.
8. Bibby K, Peccia J. Identification of viral pathogen diversity in sewage sludge by metagenome analysis. Environ Sci Technol. 2013; 47: 1945–1951. doi:10.1021/es305181xPMID:23346855
9. Lindquist L. Tick-borne encephalitis. Handb Clin Neurol. 2014; 123: 531–559. doi: 10.1016/B978-0-444-53488-0.00025-0PMID:25015503
10. Malik YS, Kumar N, Sharma K, Dhama K, Shabbir MZ, Ganesh B, et al. Epidemiology, phylogeny, and evolution of emerging enteric Picobirnaviruses of animal origin and their relationship to human strains. BioMed Res Int. 2014; 2014: 780752. doi:10.1155/2014/780752PMID:25136620
11. Oka T, Wang Q, Katayama K, Saif LJ. Comprehensive Review of Human Sapoviruses. Clin Microbiol Rev. 2015; 28: 32–53. doi:10.1128/CMR.00011-14PMID:25567221
13. Sánchez G, Bosch A, Pintó RM. Hepatitis A virus detection in food: current and future prospects. Lett Appl Microbiol. 2007; 45: 1–5. PMID:17594452
14. Lees D, CEN WG6 TAG4. International standardization of a method for detection of human pathogenic viruses in molluscan shellfish. Food Environ Virol. 2010; 2: 146–155.
15. ISO/TS 15216–1. Microbiology of food and animal feed—Horizontal method for determination of hepati-tis A virus and norovirus in food using real-time RT-PCR—Part 1: Method for quantification. Interna-tional Organization for Standardization, Geneva, Switzerland. 2013.
16. ISO/TS 15216–2. Microbiology of food and animal feed—Horizontal method for determination of hepati-tis A virus and norovirus in food using real-time RT-PCR—Part 2: Method for qualitative detection. Inter-national Organization for Standardization, Geneva, Switzerland. 2013.
17. Lemon SM, Murphy PC, Shields PA, Ping LH, Feinstone SM, Cromeans T, et al. Antigenic and genetic variation in cytopathic hepatitis A virus variants arising during persistent infection: evidence for genetic recombination. J Virol. 1991; 65: 2056–2065. PMID:1705995
18. Cromeans T, Sobsey MD, Fields HA. Development of a plaque assay for a cytopathic, rapidly replicat-ing isolate of hepatitis A virus. J Med Virol. 1987; 22: 45–56. PMID:3035079
19. Dubois E, Hennechart C, Deboosère N, Merle G, Legeay O, Burger C, et al. Intra-laboratory validation
of a concentration method adapted for the enumeration of infectious F-specific RNA coliphage, entero-virus, and hepatitis A virus from inoculated leaves of salad vegetables. Int J Food Microbiol. 2006; 108: 164–171. PMID:16387377
20. Cannon JL, Papafragkou E, Park GW, Osborne J, Jaykus LA, Vinjé J. Surrogates for the study of noro-virus stability and inactivation in the environment: a comparison of murine noronoro-virus and feline calici-virus. J Food Prot. 2006; 69: 2761–2765. PMID:17133824
21. Wobus CE, Karst SM, Thackray LB, Chang KO, Sosnovtsev SV, Belliot G, et al. Replication of Norovi-rus in cell culture reveals a tropism for dendritic cells and macrophages. PLoS Biol. 2004; 2: e432. PMID:15562321
22. Costafreda MI, Bosch A, Pinto RM. Development, evaluation and standardization of a real time TaqMan reverse transcription-PCR assay for quantification of hepatitis A virus in clinical and shellfish samples. App Environ Microbiol. 2006; 72: 3846–3855.
23. Coudray-Meunier C, Fraisse A, Martin-Latil S, Guillier L, Perelle S. Discrimination of infectious hepatitis A virus and rotavirus by combining dyes and surfactants with RT-qPCR. BMC Microbiol. 2013; 13: 216. doi:10.1186/1471-2180-13-216PMID:24083486
24. Dube S, Qin J, Ramakrishnan R. Mathematical analysis of copy number variation in a DNA sample using digital PCR on a nanofluidic device. PLoS One. 2008; 3(8):e2876. doi:10.1371/journal.pone. 0002876PMID:18682853
25. Bhat S, Herrmann J, Armishaw P, Corbisier P, Emslie KR. Single molecule detection in nanofluidic digi-tal array enables accurate measurement of DNA copy number. Anal Bioanal Chem. 2009; 394: 457– 467. doi:10.1007/s00216-009-2729-5PMID:19288230
26. Koopmans M, Duizer E. Foodborne viruses: an emerging problem. Int J Food Microbiol. 2004; 90: 23– 41. PMID:14672828
27. Griffin DW, Donaldson KA, Paul JH, Rose JB. Pathogenic human viruses in coastal waters. Clin Micro-biol Rev. 2003; 16: 129–143. PMID:12525429
28. Kocwa-Haluch R. Waterborne enteroviruses as a hazard for human health. PJoES. 2001; 10: 485– 487.
29. Henrich TJ, Gallien S, Li JZ, Pereyra F, Kuritzkes DR. Low-level detection and quantitation of cellular HIV-1 DNA and 2-LTR circles using droplet digital PCR. J Virol Methods. 2012; 186: 68–72. doi:10. 1016/j.jviromet.2012.08.019PMID:22974526
30. Sanders R, Mason DJ, Foy CA, Huggett JF. Evaluation of digital PCR for absolute RNA quantification. PLoS One. 2013; 8: e75296. doi:10.1371/journal.pone.0075296PMID:24073259
31. Coudray-Meunier C, Fraisse A, Martin-Latil S, Guillier L, Delannoy S, Fach P, et al. A comparative study of digital RT-PCR and RT-qPCR for quantification of Hepatitis A virus and Norovirus in lettuce and water samples. Int J Food Microbiol. 2015; 201:17–26. doi:10.1016/j.ijfoodmicro.2015.02.006
PMID:25725459
32. Rački N, Morisset D, Gutierrez-Aguirre I, Ravnikar M. One-step RT-droplet digital PCR: a breakthrough in the quantification of waterborne RNA viruses. Anal Bioanal Chem. 2014; 406: 661–667. doi:10. 1007/s00216-013-7476-yPMID:24276251
34. Ishii S, Kitamura G, Segawa T, Kobayashi A, Miura T, Sano D, et al. Microfluidic quantitative PCR for simultaneous quantification of multiple viruses in environmental water samples. Appl Environ Microbiol. 2014; 80: 7505–7511. doi:10.1128/AEM.02578-14PMID:25261510
35. Martin-Latil S, Hennechart Collette C, Guillier L, Perelle S. Duplex RT-qPCR for the detection of hepati-tis E virus in water, using a process control. Int J Food Microbiol. 2012; 157: 167–73. doi:10.1016/j. ijfoodmicro.2012.05.001PMID:22633799
36. Pang XL, Cao M, Zhang M, Lee B. Increased sensitivity for various rotavirus genotypes in stool speci-mens by amending three mismatched nucleotides in the forward primer of a real-time RT-PCR assay. J Virol Methods. 2010; 172: 85–87. doi:10.1016/j.jviromet.2010.12.013PMID:21185331
37. Pang XL, Lee B, Boroumand N, Leblanc B, Preiksaitis JK, Yu Ip CC. Increased detection of rotavirus using a real time reverse transcription-polymerase chain reaction (RT-PCR) assay in stool specimens from children with diarrhea. J Med Virol. 2004; 72: 496–501. PMID:14748075
38. da Silva AK, Le Saux JC, Parnaudeau S, Pommepuy M, Elimelech M, Le Guyader FS. Evaluation of removal of noroviruses during wastewater treatment, using real-time reverse transcription-PCR: differ-ent behaviors of genogroups I and II. Appl Environ Microbiol. 2007; 73: 7891–7897. PMID:17933913 39. Svraka S, Duizer E, Vennema H, de Bruin E, van der Veer B, Dorresteijn B, et al. Etiological role of
viruses in outbreaks of acute gastroenteritis in The Netherlands from 1994 through 2005. J Clin Micro-biol. 2007; 45: 1389–1394. PMID:17360839
40. Loisy F, Atmar RL, Guillon P, Le Cann P, Pommepuy M, Le Guyader FS. Real-time RT-PCR for norovi-rus screening in shellfish. J Virol Methods. 2005; 123: 1–7. PMID:15582692
41. Kageyama T, Kojima S, Shinohara M, Uchida K, Fukushi S, Hoshino FB, et al. Broadly reactive and highly sensitive assay for Norwalk-like viruses based on real-time quantitative reverse transcription-PCR. J Clin Microbiol. 2003; 41: 1548–1557. PMID:12682144
42. Trujillo AA, McCaustland KA, Zheng DP, Hadley LA, Vaughn G, Adams SM, et al. Use of TaqMan real-Time Reverse transcription-PCR for rapid detection, quantification, and typing of norovirus. J Clin Microbiol. 2006; 44: 1405–1412. PMID:16597869
43. Chan MC, Sung JJ, Lam RK, Chan PK, Lai RW, Leung WK. Sapovirus detection by quantitative real-time RT-PCR in clinical stool specimens. J Virol Methods. 2006; 134:146–153. PMID:16427707 44. Drexler J, Baumgarte S, de Souza Luna LK, Eschbach-Bludau M, Lukashev AN, Drosten C. Aichi Virus
Shedding in High Concentrations in Patients with Acute Diarrhea. Emerg Infect Dis. 2011; 17: 1544– 1548. doi:10.3201/eid1708.101556PMID:21801647
45. van Maarseveen NM, Wessels E, de Brouwer CS, Vossen AC, Claas EC. Diagnosis of viral gastroen-teritis by simultaneous detection of Adenovirus group F, Astrovirus, Rotavirus group A, Norovirus gen-ogroups I and II, and Sapovirus in two internally controlled multiplex real-time PCR assays. J Clin Virol. 2010; 49: 205–210. doi:10.1016/j.jcv.2010.07.019PMID:20829103
46. Gaunt ER, Hardie A, Claas EC, Simmonds P, Templeton KE. Epidemiology and clinical presentations of the four human coronaviruses 229E, HKU1, NL63, and OC43 detected over 3 years using a novel multiplex real-time PCR method. J Clin Microbiol. 2010; 48: 2940–2947. doi:10.1128/JCM.00636-10PMID:20554810 47. Zlateva KT, Crusio KM, Leontovich AM, Lauber C, Claas E, Kravchenko AA, et al. Design and
valida-tion of consensus-degenerate hybrid oligonucleotide primers for broad and sensitive detecvalida-tion of corona- and toroviruses. J Virol Methods. 2011; 77: 174–83.
48. Schwaiger M, Cassinotti P. Development of a quantitative real-time RT-PCR assay with internal control for the laboratory detection of tick borne encephalitis virus (TBEV) RNA. J Clin Virol. 2003; 27: 136– 145. PMID:12829035
49. Kaida A, Kubo H, Sekiguchi J, Ohyama M, Goto K, Hase A, et al. Detection of Five Rash-Associated Viruses Using Multiplex Real-Time PCR during 2006–2011. Jpn J Infect Dis. 2012; 65: 430–432. PMID:22996218
50. Mohamed N, Elfaitouri A, Fohlman J, Friman G, Blomberg J. A sensitive and quantitative single-tube real-time reverse transcriptase-PCR for detection of enteroviral RNA. J Clin Virol. 2004; 30: 150–156. PMID:15125871
51. Monpoeho S, Dehee A, Mignotte B, Schwartzbrod L, Marechal V, Nicolas JC, et al. Quantification of enterovirus RNA in sludge samples using single tube real-time RT-PCR. Biotechniques. 2000; 29: 88– 93. PMID:10907082
52. Stöcker A, Souza BF, Ribeiro TC, Netto EM, Araujo LO, Corrêa JI, et al. Cosavirus infection in persons with and without gastroenteritis, Brazil. Emerg Infect Dis. 2012; 18: 656–659. doi:10.3201/eid1804. 111415PMID:22469070
54. Martin-Latil S, Hennechart Collette C, Guillier L, Perelle S. Comparison of two extraction methods for the detection of hepatitis A virus in semi-dried tomatoes and murine norovirus as a process control by duplex RT-qPCR. Food Microbiol. 2012; 31: 246–253. PMID:22608230