Adaptive Resistance in Bacteria Requires
Epigenetic Inheritance, Genetic Noise, and
Cost of Efflux Pumps
Santiago Sandoval Motta1, Philippe Cluzel2, Maximino Aldana1*
1Instituto de Ciencias Físicas, UNAM, Cuernavaca, Morelos, Mexico,2FAS Center for Systems Biology, Harvard University, Cambridge, Massachusetts, United States of America
*max@fis.unam.mx
Abstract
Adaptive resistance emerges when populations of bacteria are subjected to gradual in-creases of antibiotics. It is characterized by a rapid emergence of resistance and fast re-versibility to the non-resistant phenotype when the antibiotic is removed from the medium. Recent work shows that adaptive resistance requires epigenetic inheritance and heteroge-neity of gene expression patterns that are, in particular, associated with the production of porins and efflux pumps. However, the precise mechanisms by which inheritance and vari-ability govern adaptive resistance, and what processes cause its reversibility remain un-clear. Here, using an efflux pump regulatory network (EPRN) model, we show that the following three mechanisms are essential to obtain adaptive resistance in a bacterial popu-lation: 1) intrinsic variability in the expression of the EPRN transcription factors; 2) epigenet-ic inheritance of the transcription rate of EPRN associated genes; and 3) energetepigenet-ic cost of the efflux pumps activity that slows down cell growth. While the first two mechanisms acting together are responsible for the emergence and gradual increase of the resistance, the third one accounts for its reversibility. In contrast with the standard assumption, our model pre-dicts that adaptive resistance cannot be explained by increased mutation rates. Our results identify the molecular mechanism of epigenetic inheritance as the main target for therapeu-tic treatments against the emergence of adaptive resistance. Finally, our theoretherapeu-tical frame-work unifies known and newly identified determinants such as the burden of efflux pumps that underlie bacterial adaptive resistance to antibiotics.
Introduction
It has been well-established that various species of bacteria, includingE.coli,S.entericaand
P.aeruginosa, exhibit resistance when they are exposed to successive steps of increasing con-centration of antibiotics [1–9]. This procedure, repeated several times, very quickly yields pop-ulations with high levels of resistance [1,3–8,9]. Another important observation is that this resistance is highly reversible. When the antibiotic is removed from the environment, the
OPEN ACCESS
Citation:Motta SS, Cluzel P, Aldana M (2015) Adaptive Resistance in Bacteria Requires Epigenetic Inheritance, Genetic Noise, and Cost of Efflux Pumps. PLoS ONE 10(3): e0118464. doi:10.1371/ journal.pone.0118464
Academic Editor:Choong-Min Ryu, KRIBB, KOREA, REPUBLIC OF
Received:July 15, 2014
Accepted:January 18, 2015
Published:March 17, 2015
Copyright:© 2015 Motta et al. This is an open access article distributed under the terms of the Creative Commons Attribution License, which permits unrestricted use, distribution, and reproduction in any medium, provided the original author and source are credited.
Data Availability Statement:All relevant data are within the paper and its Supporting Information files.
population becomes sensitive again after a few generations [1,3–8,9]. Although the field re-mains significantly unexplored, this temporal ability to cope with antibiotics is often referred to as adaptive resistance [10]. As there is no universally accepted definition of adaptive resis-tance, we will use the one given by Fernandez & Hancock:“a temporary increase in the ability of a bacterium to survive an antibiotic insult due to alterations in gene and/or protein expres-sion as a result of an exposure to an environmental trigger [. . .] and usually reverts upon the removal of the inducing condition.”[10].
Experimental observations indicate that high phenotypic variability, in an isogenic popula-tion, can often be used as a bet-hedging strategy that permits the selection of resistant cells even at low antibiotic concentrations [1,3,11]. This observation was recently corroborated by experiments showing that variability in expression of the Mar/AcrAB efflux pump system in
E.coliis correlated with the appearance of adaptive resistance to some antibiotics such as nali-dixic acid [1,3,5,9,10,11].
This variability cannot be governed by mutations alone, as the survival rates observed in these experiments are too high compared to what would be expected by mutations. For in-stance, it is estimated that the probability to find aP.aeruginosamutant with stable resistance to low-level Quinolone is about 1.2×10⁻⁶to 4×10⁻¹⁰, whereas Adam et al. found survival rates as large as 20% of the population after the first antibiotic exposure [1].
Moreover, the reversion rates to the sensitive phenotype are also very high. Once the bacte-ria have become resistant, when the antibiotic is removed from the medium, a fraction as large as 95% of the population becomes susceptible again“almost immediately”according to Adam. et al [1], or in less than 100 generations according to George and Levy [3]. These results are in-compatible with the hypothesis that genetic mutation is the sole cause of adaptive resistance, as otherwise i) the emergence of the resistant phenotype would be a sudden (or step wise discon-tinuous) event instead of appearing gradually [8]; and also ii) the resistant phenotype would not be easily reversible. For this to happen, back mutations would be required in the originally altered bases (or a compensatory mutation somewhere else), which is estimated to occur with an extremely low probability (10−9or less) [12].
It has been suggested that a combination of epigenetic processes such as methylation and stochastic gene expression, may be driving the emergence of adaptive resistance [1,5,13]. Spe-cifically, it has been proposed that DNA methylation by the DAM methylase could be responsi-ble for: i) the presence and inheritance of different gene expression profiles [13–18] and ii) the variability in expression observed for methylated genes.
The activity of the DAM methylase gene has been found correlated with the emergence of adaptive resistance. In fact, high expression of the DAM methylase gene, increases the survival rate by a factor of five in cells treated with nalidixic acid [1]. Furthermore, this heightened re-sistance is consistent with a two fold increase in the expression of efflux pumps [1]. Therefore, DNA methylation affecting the activity of efflux pumps, could be a very likely explanation of the increased resistance observed experimentally, along with the fact that it will produce enough heterogeneity in the population for antibiotic selection to act on [1,13,15,16].
In the light of these experimental observations, we propose a theoretical model to quantita-tively determine what specific elements are essential for the emergence of reversible resistance. One key hypothesis of the model is that the Efflux Pump Regulatory Network (EPRN from now on) is a target of epigenetic modifications. Specifically, these modifications will produce variability in the gene expression patterns of the EPRN transcription factors. After cell division, such gene expression patterns will be inherited from mother to daughter and will consequently impose correlations in the dynamics of the EPRN across generations. Our results indicate that this mechanism is central for the emergence of adaptive resistance.
partly supported by a Consejo Nacional de Ciencia y Tecnologia grant, number 129471. The funders had no role in study design, data collection and analysis, decision to publish, or preparation of the manuscript.
Our model also predicts that epigenetic variability and mother-daughter correlations are not sufficient to explain reversibility of resistance. Here, we demonstrate that reversibility is a consequence of a trade-off between the benefit of efflux pumps, keeping the antibiotic below le-thal levels, and a cost associated with their activity, as they are known to pump out essential metabolites and therefore slow down cell growth [18].
Our theoretical framework aims at identifying and deciphering the role of each phenomeno-logical observation in the emergence of adaptive resistance in order to provide a comprehensive and quantitative picture of this reversible phenomenon.
Results
Single Cell Efflux Pump Model.
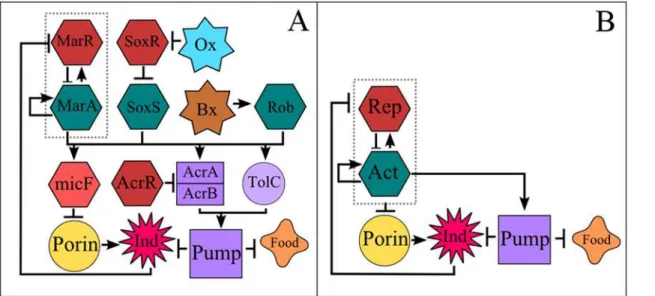
There are several EPRNs present in bacteria, and most of them share a number of prototypic characteristics that make them qualitatively similar to each other. We have constructed a sin-gle-cell model based on the acrAB-tolC system present inEscherichia coli, since it has been his-torically the most widely studied and well characterized system [19–28].Fig. 1Ashows a complete version of the acrAB-tolC regulatory network ofEscherichia coliaccording to refer-ence [9], whereasFig. 1Bshows a simplified version of it. This simplified version includes the main components of the acrAB-tolC system which are present not only inE.colibut also in other gram negative bacteria [9]. Note that the network depicted inFig. 1Bcan be embedded into the larger network shown inFig. 1A. For the reduced network we have chosen only the most dynamically important elements. This choice was not arbitrary but based on extensive numerical simulations that identified the essential components of the network, and eliminated the ones that did not provide additional information or present significant changes in the dy-namics when removed (seeS1 TextandS1 Fig.). For instance, we found that AcrR only reduces the expression of AcrA and AcrB linearly, and its role could be accounted for, by just changing the transcription rate of the AcrAB operon. This result is in agreement with previous research that indicates that AcrR only fine-tunes the expression of AcrAB to prevent unwanted expres-sion [29], a scenario that becomes irrelevant when the antibiotic is introduced. All the results presented in this work were obtained with the simplified network. Nonetheless, the simplified network gives essentially the same results as the more complete version of this system (see
S1 Fig.). Therefore, without loss of generality or biological realism, we use generic names such asActivator,Repressor, etc., to refer to the components of the network under study instead of
marAormarR, etc. It is worth mentioning that the acrAB-tolC system responds to several anti-biotics and also to non-lethal chemicals (such as salicylate), some of which were used in the adaptive resistance experiments mentioned earlier [20–22]. We will use the termsantibiotic
We use a system of stochastic differential equations (seeSupporting Information) to model the single-cell dynamics of the EPRN shown inFig. 1B. Validation and parameter calibration for this system were done by comparing our simulations with experimental data fromE.coli
wild-type cells andΔtolC mutant strains [30] (seeS1 Text,S1andS2Tables andS2andS3
Figs.). The efflux of antibiotics depends on two main parameters: the transcription rateβ0of
the EPRN operon, which ultimately affects the amount of available pumps, and the pump effi-ciencyεIthat controls how much antibiotic the pumps can expel at a certain time. We will see later that by introducing cell-to-cell variability and mother-daughter correlations in these two parameters, highly resistant populations can arise.
Importantly, due to the large size of the parameter space, we do not perform an exhaustive parameter search to determine the complete regions over which our results hold. Rather, in
S1 Tablewe present a set of parameters that qualitatively reproduce the experimental observa-tions. Nonetheless, in the Supporting Information we provide a sampling of a wide region of the parameter space for which our results hold (seeS1 TextandS4andS5Figs.).
Population model: Variability and inheritance.
The population consists of a set of replicating cells, each one represented by a copy of the sys-tem of equations governing the dynamics of the EPRN (formally presented in the SI). Each cell runs internally its own system of equations independently from other cells. These cells will grow or die depending on their internal concentration of nutrients and
antibiotics, respectively.
Cell-to-cell variability is implemented by slightly changing the two parameters that most af-fect the capability of the pumps to reduce the internal concentration of antibiotics. One such parameter is the efficiencyεIof the efflux pumps. A high efficiency will correspond to a de-creased toxicity of the antibiotic, which is due to pumps operating more rapidly or with greater
Fig 1. Efflux Pump Regulatory Network.Arrows indicate positive regulation. Blunt arrows indicate repression. A) Literature base reconstruction of the AcrAB-TolC efflux pump regulatory network ofEscherichia colias reported on [9]. B) Simplified version of the AcrAB-TolC efflux pump regulatory network (EPRN). The activator (Act) and repressor (Rep) are two Transcriptional Factors that belong to the same transcriptional unit (EPRN operon, indicated by the dashed line). When the repressor occupies its DNA binding site, the expression of the operon is restrained. Nonetheless, when the antibiotic (or inducer,Ind) enters the cell, it inactivates the repressor by binding to it, allowing the operon to be actively transcribed, promoting the production of pumps and decreasing the synthesis of porins (this last process is known to occur through an intermediary). Both food and inducer are expelled by the efflux pump system. In the population model, a reduction in food concentration implies an increase in the division time.
specificity. We assume that changes inεIare caused by genetic mutations. However, since mu-tations alone cannot account for the rapid emergence of adaptive resistance [1,3,4,6], we also implement variability in the transcription rateβ0of the EPRN operon. As stated in the
intro-duction, we assume that cell-to-cell variations of this parameter are caused by epigenetic pro-cesses, most likely methylation [1,14–17].
It is known that different methylation patterns can produce different transcription rates by changing the DNA binding affinity of some transcription factors [14–17]. We found 12 DAM methylation sites (GATC) in the regulatory operon of the AcrAB-TolC efflux pump system in
E.coli(seeSI). Each site can be in two states: either it is methylated or it is not. Therefore, there are 212= 4086 possible methylation patterns in this operon. As there are several possible pat-terns, we will assume thatβ0(the transcription rate) changes as a continuous variable.
Howev-er, this assumption is not crucial. In fact, even if only 1% of these 212possible methylation patterns were attainable and capable of producing different transcription rates, we would still have about 40 different patterns. We will see later that even under this scenario in which the values ofβ0are discrete and finite, the same qualitative results are obtained. (See the section
en-titled“Emergence of the highly resistant phenotype”below.) Cells with different values ofβ0 will produce pumps at different rates, which in turn affect their survival. Variability in the pop-ulation is then introduced by selecting, for each cell, the parametersβ0andεIfrom Gaussian distributions G(μβ,σβ) and G(με,σε), respectively (in each caseμis the mean andσ2is the vari-ance). On the other hand, inheritance is implemented by correlating the mean values of these Gaussians across generations.
To illustrate the inheritance mechanism in our model, let us consider theithcell at genera-tiont, which has a transcription rateβ0(i,t). Then, the transcription ratesβ0(i1,t+ 1) and
β0(i2,t+ 1) of its two daughter cellsi1andi2at generationt+ 1 will be drawn from the
Gauss-ian G(β0(i,t),σβ), which has averageμβ=β0(i,t). In other words, at each generation and for
each cell,β0is drawn from a Gaussian distribution G (μβ,σβ) whose averageμβis the value of β0previously owned by the corresponding mother. This mechanism, which clearly correlates
the parametersβ0along cell lineages, models the fact that methylation patterns that affect gene expression can be inherited with certain variability [14–17].
Inheritance in the pump efficiencyεIis implemented in an analogous way, but using the corresponding Gaussian distribution G (με,σε). However, since we are assuming that changes inβ0are epigenetic whereas those inεIare genetic, the time-scales at which significant modifi-cations in these parameters occur, are very different. For it is known that phenotypic modifica-tions due to epigenetic changes happen at rates at least one order of magnitude faster than those due to genetic changes [31]. Therefore, we have setσβ= 20σεin all our simulations, with
σβ= 0.1 andσε= 0.005. Among the implications of using such small variances are that the changes in gene expression and pump efficiency between mother and daughter cells occur gradually. We also implemented forσβa uniform distribution between 0 and 10, which allows abrupt changes in gene expression between the mother and daughter cells. However, when this type of abrupt changes are allowed inσβ, adaptive resistance is not observed (seeS1 Textand
S6 Fig.). We do not know, based on experimental measurements, which of the two mechanisms mentioned above (i.e. uniform vs Gaussian randomness) is more compatible with the effect caused by methylation. But, as we will see in the next section, our model predicts that when Gaussian distributions with small variances are used, adaptive resistance emerges, which is not the case for uniform distributions (seeS1 TextandS6 Fig.). Additionally, we also testedσβ= Cσεwhere 10C50 with no significant changes in the results.
1. Control simulation: There is no inheritance, only variability. The distributions G (μβ,σβ) and G (με,σε) remain the same for all the cells in the population and
throughout generations.
2. Genetic inheritance: Mother-daughter correlations are implemented only in the pump effi-ciencyεIbut not in the transcription rateβ0.
3. Epigenetic inheritance: Mother-daughter correlations are implemented only in the tran-scription rateβ0but not in the pump efficiencyεI.
4. Mixed inheritance: Mother-daughter correlations are implemented in both the transcription rateβ0and the pump efficiencyεI.
Population model: Cell duplication and death.
The synthesis and functioning of efflux pumps are associated with an energetic cost that must be taken into account. First, the pumps are very unspecific on its substrates [21,32,33]. Thus, in addition to antibiotics, they expel metabolites necessary for cell growth and division [34]. For instance, the acrAB-tolC efflux pump, is known to recognize a broad spectrum of chemi-cals. It also has a biased affinity towards phenolic rings, which are not only constituents of in-ducers of the system such as salicylic acid, but also of amino acids such as tyrosine [32,35]. Second, the synthesis of the pumps themselves (large protein complexes) and their functioning consume energy [9,32,35]. Therefore, it is reasonable to assume that the production and func-tioning of the pumps will slow down cell growth. This assumption is supported by experimen-tal observations indicating that over-expression of efflux pumps is correlated with both high levels of resistance and decreased growth [18,36,37]. In our model we set this cost by making the internal concentration of nutrient in each cell depend inversely on the amount of pumps (see Eq. (6) inS1 Text). The net result is a slowdown of the cell division rate, because a mini-mum internal nutrient concentration is required for division to happen. Thus, when the inter-nal concentration of nutrients reaches a certain threshold (θF), the cell divides consuming the nutrient load,F. The two daughter cells start anew with a food loadF= 0 and will have to accu-mulate resources again in order to divide. Clearly, the division time (the time it takes to reach the thresholdθF) depends on the amount of pumps, which in turn depends on the transcrip-tion rateβ0and the concentration of inducer (seeS1 TextandS7 Fig.).
We have also included cell death in our population model. In order for the cell to survive, the efflux pumps need to keep the internal antibiotic concentration below the lethal levelθI. Whenever this threshold is reached, the cell dies and it is removed from the population.
Emergence of the highly resistant phenotype.
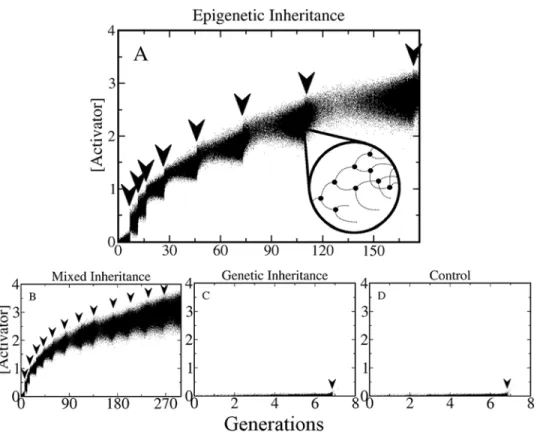
Fig. 2shows typical tracking plots of the activator concentration for the four scenarios men-tioned above (control, genetic inheritance, etc.). As in the experiments reported in Refs. [1,3,
6–8,37], we subject the population to successive antibiotic shocks, each one gradually increas-ing the external concentration of antibiotic by an amountΔIn. Thus, afterMshocks the exter-nal antibiotic concentration will beIext ¼S
M
n¼1DIn. After each antibiotic shock, indicated by
population dies after the first shock. The above results show that in our model variability alone is not enough for the emergence of adaptive resistance (Fig. 2D). Analogously, genetic inheri-tance, which essentially consists of mother-daughter correlations occurring at long time scales, cannot give rise by itself to adaptive resistance either (Fig. 2C).
For such adaptive resistance to emerge, short-term mother-daughter correlations in the tran-scription rateβ0of the EPRN operon need to be implemented in the model. Note that when both
genetic and epigenetic inheritance are present (Fig. 2B) the population tolerates a higher number of antibiotic shocks in the same time interval than when only epigenetic inheritance is present.
Fig. 2Aalso shows that the more resistant the cells become, the slower their division rates get. In-deed, the time it takes for the population to reach a size of N = 5000 in order to apply the next anti-biotic shock, (indicated by the separation of the arrows), becomes longer as the population survives in higher antibiotic concentrations (this effect can also be seen inS7 Fig.). It is important to men-tion that if the antibiotic shocks occur at high frequencies (for instance less than 10 generamen-tions
Fig 2. Emergence of the high resistance phenotype.This figure shows tracking plots of populations growing in successively increasing concentrations of antibiotic. For each cell the concentration of Activator is plotted at constant time intervals (dots). The arrows indicate the times at which antibiotic shocks were applied, which happened every time the population reached a maximum size of N = 5000. The four panels correspond to the four different inheritance scenarios mentioned in the main text. (A) Only epigenetic inheritance is implemented. (B) Mixed Inheritance. (C) Only genetic inheritance and (D) control (no inheritance). The inset in (A) shows a zoomed in representation of the tracking plot, where one cell lineage is followed as it goes through several cell divisions and deaths. Since dead cells are removed immediately from the population, their expression is no longer visible and their curves terminate abruptly (causing a step-like structure). Note that high levels of resistance can be achieved only when there is epigenetic inheritance (A and B). Otherwise, the entire population dies after the first shock (C and D). The unit of time corresponds to one cell cycle forβ0= 1 and with no antibiotic (seeS6 Fig.).
between two successive shocks), or if each antibiotic shock is much more intense (e.g. twice or more) than the previous one, we observe no surviving cells whatsoever in any of the four scenarios.
It is also worth noting that if a discrete distribution forβ0with 40 different values is used
in-stead of a continuous Gaussian, the same qualitative results are obtained, as can be seen in
S8 Fig. Therefore, adaptive resistance occurs even in the presence of moderate variability in gene expression, as long as there are mother-daughter correlations in such variability.
Reversibility.
So far, the difference between genetic and epigenetic inheritance consists on one hand, in the time scales at which these two processes produce phenotypic changes in the population, and on the other hand in the parameters they affect. Genetic inheritance affects the pump efficiencyεIwhereas epigenetic inheritance affects the transcription rateβ0. Another important difference is that changes caused by genetic mutations are very unlikely to be reversible whereas epigenetic changes are much more likely to be reversible [31,38]. To test if our model can reproduce the experimentally observed reversibility, we replicate the simulations described in the previous section (where levels of resis-tance are ramped higher) for the mixed scenario. But now, after several rounds of selection, we re-move the external antibiotic and allow the cells to grow and divide without stress. (The antibiotic is removed by settingIext= 0 in Eq.(5) of the SI.)Fig. 3Ashows that the concentration of the activator
abruptly decreases when the antibiotic is removed (indicated by a big black arrow), eventually reaching its basal level of expression.Fig. 3Bshows the size of the population as a function of time across the successive antibiotic shocks, and then in the free medium. The population size decreases exponentially each time an antibiotic shock is applied. However, after some time, the surviving cells grow and divide restoring the population size to the maximum size N = 5000. Note that when the antibiotic is removed the population growth returns to its wild-type behavior. These results are qualitatively similar to those observed experimentally [1,3–8,9]. However, this fact does not neces-sarily mean that the cells return to their wild type levels of susceptibility. For the cells that have re-versed back to a sensitive phenotype could still have very high values of transcription rate,β0, and
this high rate would imply that as soon as the antibiotic is applied again, the activator and the efflux pumps will be produced rapidly and at high concentrations. At this stage, most of the cells would be able to survive easily almost any antibiotic shock making the system non-reversible.
The only way for the population to truly reverse to its wild-type condition and become sus-ceptible again is to return to their initial distribution G (μβ,σβ), which is centered at low values ofβ0. We expect this to happen because cells with a smallβ0duplicate faster than cells with
largeβ0(seeS1 TextandS7 Fig.). Since the values ofβ0are correlated across generations, cells with faster division rates (lowβ0) will eventually dominate the population, shifting the
distribu-tion G (μβ,σβ) towards the lowβ0region. Indeed, the population averageμβ=hβ0iof the
tran-scription rate as a function of time is reported inFig. 3C. Note thatμβincreases as the antibiotic concentration is ramped higher. Then, when the external antibiotic is removed the average transcription rate across the populationμβdecreases gradually, reaching the same value as in the original wild-type population. The lower panels inFig. 3Cshow the distribution G (μβ,σβ) at three different time points throughout the simulation. We start with a distribution centered at low values ofβ0(μβ0.5). Then, after several rounds of selection the distribution G (μβ,σβ) is shifted to relatively high numbers (μβ10). But then again, when the antibiotic is removed, the distribution eventually returns to its initial configuration.
Genetic Assimilation.
Fig 3. Reversibility of the resistance phenotype.(A) This tracking plot shows that the expression of the activator increases while the antibiotic shocks are applied as inFig. 2. Then, when the antibiotic is removed (indicated by the tilted black arrow), the expression of the activator decreases abruptly and eventually reaches its basal level. (B) Size of the population as a function of time for the same simulation as in A. After each antibiotic shock (small black arrows) the population size decreases exponentially and the recovery time becomes longer with each shock. After the antibiotic is removed (tilted black arrow) the population comes back again to its wild-type (WT) growth rate. To carry out the simulations in the antibiotic-free phase, every time the population reached the maximum size N = 5000, we took a random sample of 10% of the cells and made them grow without antibiotic, until the population reached again this maximum size, and so on. (C) Average transcription rateμβ=hβ0iin the population as a function of time. Note that the average increases while the shocks are applied and then gradually comes back to small values when the antibiotic is removed. Error bars indicate the standard deviation. It can be observed that the standard deviation increases with the antibiotic stress. The panels below show the full distribution G (μβ,σβ) at three different times: before any
antibiotic is introduced (circle); after several antibiotic shocks (star); after a long period of time without antibiotic (line). Time is measured generations, being one generation the time it takes for a cell withβ0= 1 to reachθFstarting from F = 0.
modifications. Thus, to observe any significant increase in resistance produced by changes in the pump efficiency we need to run the simulation for a longer time. Interestingly, by doing this we obtain a nonreversible resistance, first driven by our mechanism of epigenetic inheri-tance (which is reversible), and then fixed by genetic variation and inheriinheri-tance of the pump ef-ficiency. To observe this phenomenon, which can be considered analogous to genetic
assimilation [39,40,41], we performed numerical experiments similar to the ones presented in the previous sections, where the population is first induced withMantibiotic shocks. The dif-ference now is that we will let the population be in contact with the antibiotic for a very long time before removing it. To measure the level of resistance of the population throughout this process we define the Resistance Index (RI) as the maximum concentration of antibiotic that the population can endure with at least 10% of survival. (A similar measure was used in [3].)
Fig. 4reports the evolution of the RI for different populations subjected to a different number
Mof antibiotic shocks. In each case, the arrows indicate the time at which the antibiotic is re-moved. The results depicted inFig. 4show that the final stationary value of the resistance index (the one reached when the antibiotic is removed) depends on how long the population remains in contact with the antibiotic. The blue curve deserves special attention. In this case,
M= 15 antibiotic shocks were applied, with the last shock occurring at the time indicated by the blue star. After this, the antibiotic concentration was kept constant until the time indicated by the blue arrow, at which the antibiotic was removed. Note that the RI keeps increasing even during the interval of steady antibiotic concentration. Note also that the final RI stationary value reached after the antibiotic is removed is five times larger for the blue curve than for all the other curves. It is worth noting that the black curve, corresponding to a control population growing in the absence of antibiotic, remains close to the initial low basal level throughout the entire simulation. Therefore, in our model antibiotic resistance occurs only as a response to the selective pressure imposed by the antibiotic and not by random genetic drift.
It is important to mention that the increase in the basal level of the RI shown inFig. 4A
when the population is kept in a high antibiotic concentration for a long time is non reversible. Indeed,Fig. 4Dshows the evolution across generations of the average pump efficiencyμεand the average transcription rateμβfor the population corresponding to the blue curve ofFig. 4A. FromFig. 4Dit is apparent thatμβincreases only when antibiotic shocks are applied, namely, when the antibiotic concentration in the environment also increases. However, as soon as the antibiotic concentration is kept constant, even at a high value, the average transcription rateμβ starts decreasing and reaches its initial low value at the end of the simulation. Contrary to this, the average pump efficiencyμεkeeps rising as long as there is antibiotic in the environment, reaching a steady value only when the antibiotic is removed. Thus, exposing the population to a high antibiotic concentration for a long time produces a non-reversible shift in the pump effi-ciency distribution P(ε), permanently increasing the level of resistance of the population.
It is also important to emphasize the difference between the survival rate (SR) and the resis-tance index RI. The former is defined as the fraction of cells that survive an induction, and this fraction ranges from 0 (if no cell survives) to 1 (if all cells survive). On the other hand, the RI is the value of the antibiotic concentration at which the SR is 0.1 (i.e., the concentration of the an-tibiotic at which only 10% of the cells survive). Therefore, the RI does not have to be between 0 and 1. Actually, its value depends on the units used to measure the antibiotic concentration (in our case we use arbitrary units) and the capability of the population to resist the antibiotic. This capability, in turn, depends on the wayβ0andεIare distributed across the population. In each cell, these parameters determine the fixed points of the system (only one fixed point exists for a given combination ofβ0andεIin the range of concentrations explored in this work, see
Fig 4. Genetic Assimilation occurs at longer time scales.(A) Resistance Index (RI) as a function of time for populations induced withMantibiotic shocks.
The different curves correspond to different values ofM, except by the black one which corresponds to a control population growing with no antibiotic. (B) Blow up showing the first 500 generations. For each curve, the corresponding arrow indicates the time at which the antibiotic is removed. In the case of the blue curve, the asterisk indicates the time at which the last antibiotic shock is applied, after which the antibiotic concentration is kept constant. (C) Blow up of the last part of the simulation showing the point at which the antibiotic is removed from the population corresponding to the blue curve. It can be observed that in this case the final stationary value of the RI is about five times higher than that of the control population. (D) Evolution of the average transcription rateμβ
and the average pump efficiencyμεfor the population corresponding to the blue curve. Notice that as soon as the antibiotic concentration is kept constant,μβ
starts decreasing whereasμεkeeps rising until the antibiotic is completely removed. This shows that the evolutionary process does not reach a stationary
state (or fixed point) in the presence of antibiotic.
the fact that the unique fixed point of each cell moves throughout the evolution of the population.
Discussion
Adaptive resistance in bacteria is observed after subjecting a population to gradual increments of antibiotic concentration. Regardless of the level of resistance reached through this process, (which can be very high), the resistance disappears after a few generations in the absence of an-tibiotic. Previous studies have independently identified epigenetic inheritance and phenotypic heterogeneity as important components involved in the emergence of adaptive resistance [1,3,
4,6,7,8,11], but their role has never been evaluated quantitatively. Additionally, the molecular origin of reversibility observed in adaptive resistance has remained unclear.
In this study we present a theoretical framework that identifies the essential mechanisms for the emergence, evolution and reversibility of adaptive resistance. We constructed a single-cell dynamic model of a prototypic efflux pump regulatory network (EPRN) that incorporates the most updated information available in the literature. We calibrated this model with experimen-tal observations for wild type and mutantE.colistrains. We then grew a population of such sin-gle cells with growth dynamics obeying simple rules such as division, death, variability and inheritance of gene expression patterns. For each cell in the population we compute their EPRN temporal dynamics. Through this model we demonstrate that heterogeneity and moth-er-daughter correlations affecting transcription rates, specifically those of the EPRN main regu-lators, can explain the gradual amplification of the multidrug resistant phenotype. By contrast, mother-daughter correlations implemented in the pump efficiency, and developing at longer timescales, were not sufficient to make the population adapt and survive to successive antibiot-ic shocks (but had a role in fixing resistance when the population had contact with antibiotantibiot-ics for a very long time). We also found that introducing a cost associated with the functioning of the EPRN was enough to explain the observed reversibility to the susceptible
(non-resistant) phenotype.
A previous report [11] proposed that adaptive resistance developed as a consequence of het-erogeneity in gene expression because cells that randomly have a high production of efflux pumps survive, and those that did not, die. Through our model, we were able to show that al-though heterogeneity in gene expression is necessary, it is not sufficient to explain the emer-gence of resistance, nor its gradual response, as epigenetic inheritance of gene expression patterns is also necessary. Epigenetic modifications can change gene expression patterns at short time scales, providing a mechanism by which cells can adapt to changing environments quickly. At the same time, it allows for enough flexibility: if the environment returns to its earli-er state, a population whose fitness is compromised by the new gene expression pattearli-erns can return to its previous state in a short time.
Based on several experimental observations, another report [1] suggested that DNA methyl-ation is a plausible mechanism driving this epigenetic inheritance. Methylmethyl-ation can indeed pro-duce both the heterogeneity and epigenetic inheritance of gene expression patterns required for adaptive resistance to occur. Our results support this idea and specifically identify the regulatory regions of the main regulators of the EPRN as the most probable targets for the methylation process, as amplification of the antibiotic resistance do not occur without the mother-daughter correlations in gene transcription rates (seeFig. 2). Consequently, the process of DNA methylation in bacteria is potentially an important target for the development of thera-peutic treatments in preventing the emergence of adaptive resistance.
feature that it has to be inherited. Whether or not this variability is caused by methylation is not the central point. Nonetheless we propose DNA methylation of the marRAB operon as the possible cause of this variability because: (i) it can be inherited; (ii) mutant cells in which meth-ylation is lacking are much more susceptible to antibiotics [1]; (iii) it provides the necessary variability in short periods of time required for adaptive resistance to emerge [1]. However, re-gardless of the precise mechanism behind this variability, the important point in our model is the existence of inheritable variability that can be quickly developed. For our results show that some heritable mechanism modifying the transcription rates of an efflux pump regulatory net-work must be present in order to observe adaptive resistance.
Another interesting observation is the emergence of a stable form of resistance when the population is left in a medium with high concentrations of antibiotic for very long times. In our model this non-reversible resistance is produced by changes effectively improving the pump efficiencyεI,meaning that the pumps become better at distinguishing antibiotics from
nutrients, so that they can pump out the former at a higher rate than the latter. Although these genetic modifications are rare and insufficient to save the population initially, they become im-portant at longer times, transforming into an alternate source of resistance without adverse ef-fects. Therefore, this heritable trait will, at longer time scales, permanently increase the basal levels of resistance of the population when it is under selective pressure (seeFig. 4A). In our model genetic changes at each generation are small and increase the pump efficiency gradually (Fig. 4D). In reality, genetic changes, although rare, may produce abrupt changes in the level of resistance of the population. The important point is that the fast epigenetic changes occurring in the transcription rate allow the population to survive long enough as to develop more stable and efficient forms of resistance. This behavior is consistent with experimental observations, showing that bacterial populations that have been continuously exposed to antibiotics are per-manently much more resistant than populations that have been not [1].
We have based our simulations on the regulatory scheme of the widely known acrAB-tolC efflux pump system, for which many of the kinetic parameters are still unknown. In our study, we aimed to identify the essential mechanisms that could explain and reproduce adaptive resis-tance and our results hold in a significant region of the parameter space and not only for the particular values presented inS1 Table(seeS4andS5Figs.). However, performing a deep search in the parameter space of the equations could reveal important constraints; such as the timescales at which epigenetic inheritance or genetic mutations must occur; or even the amount of pumps that the cell needs to produce (which is to our current knowledge an un-known variable). We also explored alternative mechanisms that could yield resistance, such as uneven pump distribution in each cell division (one daughter cells takes the majority of the pumps) and increased mutation rates (which increases the variabilityσεin the efficiency of the efflux pumps). The results, presented in the SI (seeS1 Text,S10andS11Figs.) show that nei-ther of these two mechanisms is able to produce adaptive resistance.
Our model provides an explanation for the emergence of adaptive resistance based on the cost and benefit of the biological characteristics of an efflux pump system. It does not only pre-dict the behavior of populations subjected to different antibiotic shocks and at different time, but also a number of different phenomena observed experimentally in bacterial populations, such as phenotypic reversibility, genetic assimilation, and even the survival rates of populations that have been pre-induced with non-lethal antibiotic concentrations (seeS1 TextandS12 Fig.).
Supporting Information
simplified network) and the pumps (AcrAB-TolC in the complete network and Pumps in the simplified network). Two external inducer concentrations are presented (I = 0 black curves, and I = 7 red curves) as well as two different values of the transcription rateβ0, (β0= 0 andβ0=
5). It can be observed that the curves for the complete and simplified networks are extremely similar in all cases.
(TIF)
S2 Fig. Dynamical behavior of the SC-EPRN.We report the ratioГX= Xa/Xwof expression
levels of the network element X with antibiotic (Xa) and without antibiotic (Xw). Black bars
in-dicate an increase in concentration in the antibiotic medium (Гx>1) whereas red bars indicate
lower expression when the antibiotic is present (Гx<1). It can be observed that the presence of
antibiotic triggers an overexpression of the activator operon (A and R), a reduction of the por-ins (Q), an increase in the production of pumps (P), and a reduction in the active form of the repressor (R), as it has been reported in [1].
(TIF)
S3 Fig. Behavior of the SC-EPRN for wild-type and mutant strains.The plot shows the con-centration of the activator A as a function of time for wild type (P+, black circles) and pump de-ficient (P−, red squares) strains. Approximately, a twofold increase in the concentration of the activator in the mutant versus the wild type strains is observed in our simulations, which corre-spond to the experiments reported in [2]. In fact, this twofold increase was used to calibrate some of the parameters in the numerical simulation.
(TIF)
S4 Fig. Parameters producing equivalent dynamics.By moving the values of the degradation ratesγAandγRof the activator and the repressor, respectively, along the curve, we obtain the
same qualitative results for the induction experiments as the one shown inFig. 2of the main text. The triangles show the particular values used to generate the plots inS4 Fig. The numbers between parentheses indicate the average increase of the antibiotic between two successive shocks. These results suggest that the conclusions of our model hold for a wide region in the parameter space and not just for the one particular point reported inS1 Table.
(TIF)
S5 Fig. Adaptive resistance for equivalent parameters.Tracking plots for the activator corre-sponding to the 1st(A), 2nd(B), 3rd(C) and 5th(D) points inS3 Fig. Note that these plots are qualitatively similar to the one shown in the main text (Fig. 2), even though the plots here were obtain with different parameter values changing in almost one order of magnitude.
(TIF)
S6 Fig. Uniform distribution forβ0with no correlations.This plot shows the size of the pop-ulation as a function of time for the case in which the value ofβ0for each cell in the population and for each generation is taken randomly with uniform probability from the interval [0,10]. The upper arrow indicates the time at which the first antibiotic shock is applied, whereas the lower arrow indicates the application of the second antibiotic shock. Note that in this case in which there is no mother-daughter correlation in the value ofβ0, the population is not able to survive the second antibiotic induction, even though there is a relatively high variability in the population.
(TIF)
an antibiotic-free environment, while the red and green curves correspond to cells growing in antibiotic concentrations [Iext] = 1 and [Iext] = 3, respectively. Note that the division time
in-creases with both the concentration of external inducer Iextand the transcription rate (β0).
(TIF)
S8 Fig. Discrete distribution forβ0.Tracking plot for the activator in the case in whichβ0
takes 40 different discrete values (which represent about 1% of the theoretically possible 212 dif-ferent methylation patterns). In this case, in each replication the daughter cells can either ac-quire the same value ofβ0than the mother with probability 0.5, of any of the two adjacent values with the same probability 0.25. The inset shows the distribution P(β) at the beginning of the simulation (blue histogram) and after several antibiotic shocks (red histogram). Note that the behavior of the system is essentially the same as inFig. 2of the main text, which indicates that a large number of methylation patterns is not necessary to obtain adaptive
antibiotic resistance. (TIF)
S9 Fig. Fixed Points of the EPRN.A) Fixed point of the activator as a function ofβ0for a
fixed concentration of external inducer. B)-D) Stream plots on the Activator-Repressor plane for different values ofβ0showing that there is only one fixed point in the range of parameters
explored in this work. (TIF)
S10 Fig. Changing the epigenetic/genetic variability rate.(A) Increased mutation rates. Pop-ulation size for a mixed model where the genetic variability was made equal to that of the epige-netic variability,σε=σβ= 1. We can observe that the population can endure a lot more antibiotic shocks (occurring at each peak) than the mixed model where the variance in the pump efficiency was much lower 20σε=σβ(seeFig. 3B). Also, cell death is significantly re-duced (approx 15% after the first induction), which is at odds with the behavior observed ex-perimentally, where cell death is much higher [4,5]. (B) Inverted time-scales. Population size for a mixed model where the genetic variability was interchanged with the epigenetic variabili-ty;σε= 0.1 andσβ= 0.005. We can observe that the population dies immediately after the first antibiotic shock, which supports the idea that mutations alone cannot explain adaptive resis-tance. Time is measured in generations.
(TIF)
S11 Fig. Uneven pump segregation and persistent cells.Plot of the population size as a func-tion of time when random pump segregafunc-tion is implemented without genetic or epigenetic in-heritance. Each antibiotic shock is indicated by a change in color and by an arrow. Note that after the first shock just a few cells survive. These surviving cells are highly resistant because they can survive further antibiotic shocks. However, these cells cannot divide (the population size remains constant). This behavior is similar to the one observed experimentally in persis-tent cells [6].
(TIF)
S12 Fig. Pre-induction increases survival rates.Survival ratio SR as a function of the antibiot-ic shock concentration Iextfor different pre-induction levels: Ipre= 0 (i.e. no pre-induction,
black curve), Ipre= 0.25 (red curve), and Ipre= 0.5 (green curve). Note that the survival ratio
in-creases with the pre-induction concentration Ipre.
(TIF)
second column shows the values used to obtain the results presented in the main text, while the third column shows the values used for the alternative scenarios (presented in theSI). In the latter case the values that are different from those in the original model are shaded in gray. (DOC)
S2 Table. Meaning and interpretation of parameters.This table lists all the parameters of the model and gives their biological interpretation.
(DOC)
S3 Table. Parameters for the complete network.Values of the parameters used for the nu-merical simulations of the complete Mar system depicted inFig. 1Aof the main text. (DOC)
S1 Text. Supporting Information for the main text and supplementary figures. (DOC)
Author Contributions
Conceived and designed the experiments: SSM PC MA. Performed the experiments: SSM. Ana-lyzed the data: SSM PC MA. Contributed reagents/materials/analysis tools: SSM. Wrote the paper: SSM PC MA. Contributed to frame the work within the right biological context: PC.
References
1. Adam M, Murali B, Glenn NO, Potter SS. Epigenetic inheritance based evolution of antibiotic resistance in bacteria. BMC Evol Biol. 2008 Nov.
2. Cohen SP, McMurry LM, Hooper DC, Wolfson JS, Levy SB. Cross-resistance to fluoroquinolones in multiple-antibiotic-resistant (Mar) Escherichia coli selected by tetracycline or chloramphenicol: de-creased drug accumulation associated with membrane changes in addition to OmpF reduction. Antimi-crob Agents Chemother 1989 May.
3. George AM, Levy SB. Amplifiable resistance to tetracycline, chloramphenicol, and other antibiotics in Escherichia coli: involvement of a non-plasmid-determined efflux of tetracycline. J Bacteriol 1983, Aug Vol. 155 No. 2 p. 531–540 PMID:6348022
4. Braoudaki M, Hilton AC. Adaptive resistance to biocides in Salmonella enterica and Escherichia coli O157 and cross-resistance to antimicrobial agents. J Clin Microbiol 2004 Jan.
5. Mazzariol A, Tokue Y, Kanegawa TM, Cornaglia G, Nikaido H. High-Level Fluoroquinolone-Resistant Clinical Isolates of Escherichia coli Overproduce Multidrug Efflux Protein AcrA. Antimicrob. Agents Chemother. 2000 Dic.
6. Viveiros M, Portugal I, Bettencourt R, Victor TC, Jordaan AM, et al. Isoniazid-induced transient high-level resistance in Mycobacterium tuberculosis. Antimicrob Agents Chemother. 2002, 46(9):2804. PMID:12183232
7. Barclay ML, Begg EJ, Chambers ST. Adaptive resistance following single doses of gentamicin in a dy-namic in vitro model. Antimicrob Agents Chemother. 1992 Sept.
8. Toprak E, Veres A, Michel J-B, Chait R, Hartl DL, et al. Evolutionary paths to antibiotic resistance under dynamically sustained drug selection. Nat Genet 2011 Jan.
9. Li XZ and Nikaido H. Efflux-Mediated Drug Resistance in Bacteria An update. Drugs. 2009, Volume: 69, Issue: 12, Pages: 1555–1623 doi:10.2165/11317030-000000000-00000PMID:19678712
10. Fernández L, Hancock REW. Adaptive and Mutational Resistance: Role of Porins and Efflux Pumps in Drug Resistance. Clinical Microbiology Reviews 2012 Oct.
11. Sánchez-Romero MA, Casadesús J. Contribution of phenotypic heterogeneity to adaptive antibiotic re-sistance. Proc Natl Acad Sci USA 2014 Jan.
12. Levin BR, Perrot V, Walker N. Compensatory mutations, antibiotic resistance and the population genet-ics of adaptive evolution in bacteria. Genetgenet-ics 2000 March. 154–3: 985–997.
14. Bradley W, Marjan W, David L. Analysis of Nonmethylated GATC Sites in the Escherichia coli Chromo-some and Identification of Sites That Are Differentially Methylated in Response to Environmental Sti-muli. Journal of Bacteriology 1994 p. 3438–3441 Vol. 176, No. 11 PMID:8195106
15. Low DA, Weyand NJ, Mahan MJ. Roles of DNA Adenine Methylation in Regulating Bacterial Gene Ex-pression and Virulence. Infect. Immun. 2001.
16. Løbner-Olesen A, Marinus GM, Hansen FG. Role of SeqA and Dam in expression: A global/microarray analysis Escherichia coli gene. PNAS 2003 Sept.
17. Løbner-Olesen A, Skovgaard O, Marinus MG. Dam methylation: coordinating cellular processes. Cur-rent Opinion in Microbiology. 2005.
18. Wood KB, Cluzel P. Trade-offs between drug toxicity and benefit in the multi-antibiotic resistance sys-tem underlie optimal growth of E. coli. BMC Syssys-tems Biology. 2012.
19. Nikaido H. Multidrug efflux pumps of gram-negative bacteria. J Bacteriology. 1996 vol. 178 no. 20 5853–5859 PMID:8830678
20. Seoane AS, Levy SB (1995) Characterization of MarR, the repressor of the multiple antibiotic resis-tance (mar) operon in Escherichia coli. J Bacteriol. 1995 June, p. 3414–3419. Vol. 177, No. 12 PMID: 7768850
21. Yu EW, Aires JR, Nikaido H. (2003) AcrB multidrug efflux pump of Escherichia coli: Composite sub-strate-binding cavity of exceptional flexibility generates its extremely wide substrate specificity. J Bac-teriol. 2003 Oct.
22. Okusu H, Ma D, Nikaido H. AcrAB efflux pump plays a major role in the antibiotic resistance phenotype of Escherichia coli multiple-antibiotic-resistance (Mar) mutants. J Bacteriol. 1996 January. vol. 178 no. 1 306–308 PMID:8550435
23. Sulavik MC, Gambino LF, Miller PF. The MarR repressor of the multiple antibiotic resistance (mar) oper-on in Escherichia coli: prototypic member of a family of bacterial regulatory proteins involved in sensing phenolic compounds. Molecular Medicine 1995; 1(4):436–446. PMID:8521301
24. Alekshun MN, Levy SB. Alteration of the Repressor Activity of MarR, the Negative Regulator of the Escherichia coli marRAB Locus, by Multiple Chemicals In Vitro. Journal of Bacteriology 1999; 181 (15):4669–4672. PMID:10419969
25. Martin RG, Jair KW, Wolf RE, Rosner JL. Autoactivation of the marRAB multiple antibiotic resistance operon by the MarA transcriptional activator in Escherichia coli. Journal of Bacteriology 1996; 178 (8):2216–2223. PMID:8636021
26. Alekshun MN, Levy SB. Regulation of chromosomally mediated multiple antibiotic resistance: the mar regulon. Antimicrobial Agents and Chemotherapy 1997; 41(10):2067–2075. PMID:9333027
27. Alekshun MN, Levy SB. The mar regulon: Multiple resistance to antibiotics and other toxic chemicals. Trends Microbiol. 1999. 7: 410–413. PMID:10498949
28. Oethinger M, Podglajen I, Kern WV, Levy SB. Overexpression of the marA or soxS Regulatory Gene in Clinical Topoisomerase Mutants of Escherichia coli. Antimicrobial Agents and Chemotherapy 1998; 42 (8):2089–2094. PMID:9687412
29. Ma D, Alberti M, Lynch C, Nikaido H, Hearst JE. The local repressor AcrR plays a modulating role in the regulation of acrAB genes of Escherichia coli by global stress signals. Mol Microbiol 1996.
30. Rosner JL, Martin RG. An Excretory Function for the Escherichia coli Outer Membrane Pore TolC: Upregulation of marA and soxS Transcription and Rob Activity Due to Metabolites Accumulated in tolC Mutants. Journal of Bacteriology 2009; 191(16):5283–5292. doi:10.1128/JB.00507-09PMID: 19502391
31. Rando OJ, Verstrepen KJ. Timescales of Genetic and Epigenetic Inheritance. Cell. 2007;.
32. Takatsuka Y, Chen C, Nikaido H. Mechanism of recognition of compounds of diverse structures by the multidrug efflux pump AcrB of Escherichia coli. Proceedings of the National Academy of Sciences of the United States of America 2010; 107(15):6559–6565. doi:10.1073/pnas.1001460107PMID: 20212112
33. Nikaido H, Pagès J-M. Broad Specificity Efflux pumps and Their Role in Multidrug Resistance of Gram Negative Bacteria. FEMS microbiology reviews 2012; 36(2):340–363. doi:10.1111/j.1574-6976.2011. 00290.xPMID:21707670
34. Webber MA, Piddock LJV. The importance of efflux pumps in bacterial antibiotic resistance J. Antimi-crob. Chemother. 2003 Dec..
36. Klaas M. Pos. Drug transport mechanism of the AcrB efflux pump. Biochimica et Biophysica Acta. 2009;
37. Andersson DI. The biological cost of mutational antibiotic resistance: any practical conclusions? Curr Opin Microbiol. 2006; 9:461–465. PMID:16890008
38. Hermsen R, Deris JB, Hwa T. On the rapidity of antibiotic resistance evolution facilitated by a concen-tration gradient. Proc Natl Acad Sci. 2012; 109:10775–10780. doi:10.1073/pnas.1117716109PMID: 22711808
39. Lancaster AK, Masel J. The evolution of reversible switches in the presence of irreversible mimics. Evo-lution (N Y). 2009; 63:2350–2362. doi:10.1111/j.1558-5646.2009.00729.xPMID:19486147
40. Pigliucci M, Murren CJ. Perspective: Genetic assimilation and a possible evolutionary paradox: can macroevolution sometimes be so fast as to pass us by? Evolution. 2003; 57:1455–1464. PMID: 12940351