Advances in Mechanical Engineering 2016, Vol. 8(4) 1–16
ÓThe Author(s) 2016 DOI: 10.1177/1687814016642715 aime.sagepub.com
An intuitionistic fuzzy set–based hybrid
approach to the innovative design
evaluation mode for green products
Ching-Hsin Wang
Abstract
As technology vigorously develops and the awareness of environmental protection rises, green industry has been gradu-ally valued by government and consumers. Customers’ needs can be satisfied with effective resource strategies as well as innovative technology of green products. Importance–performance analysis is a method incorporating the voices of customers and resource strategies of green design into the product development as well as management performance assessment by means of ‘‘importance’’ and ‘‘performance.’’ Quality function deployment can turn the voices of customers into product development and technical requirement, in order to ensure that the product can meet customers’ satisfac-tion. The present companies take not only customers’ demand but also their own technical limits into account. Hence, data envelopment analysis can offer firms the priority order when they carry out their improvement in the green prod-uct design. Nevertheless, many uncertainties and semantic ambiguity appear in the process of information collection for the product design. Consequently, this study comes up with importance–performance analysis, analytical network pro-cess, quality function deployment, and data envelopment analysis, to construct an evaluation mode of innovative design for green products based on intuitionistic fuzzy sets offering enterprises a practical reference for their green product design.
Keywords
Green innovation, intuitionist fuzzy sets, importance–performance analysis, quality function deployment, data envelop-ment analysis
Date received: 15 November 2015; accepted: 8 March 2016
Academic Editor: Stephen D Prior
Introduction
In recent years, with the rise of environmental protec-tion awareness as well as the concept of sustainable earth, a large number of companies actively use the environmental management as their strategic policy. Thus, green product innovation has become an extremely important issue regarding modern business operation and management. According to Kammerer1 and Qi et al.,2 apart from the pursuit of economic development, enterprises can develop sustainable green products by means of green innovation. Alternatively, they can reduce the use of poisonous substances or
materials during the manufacturing process, control energy consumption and emission of waste gas, and prolong the expiration date for product use, so that
Institute of Project Management, National Chin-Yi University of Technology, Taichung, Taiwan, R.O.C.
Corresponding author:
Ching-Hsin Wang, Institute of Project Management, National Chin-Yi University of Technology, No. 35, Lane 215, Section 1, Chung Shan Road, Taiping, Taichung 411, Taiwan, R.O.C.
Email: thomas_6701@yahoo.com.tw
they can carry out the idea of enterprise environmental protection strategy to better their image.
In addition, Pujari,3 Gouda et al.,4 and Coskun et al.5thought that green innovation could bring indus-tries and enterprises environmental performance as well as economic performance. Also, Elkington6and Nehrt7 considered ‘‘green design’’ as a kind of ‘‘recyclable, low-pollution, and energy-saving’’ design; through the improvement of hardware (equipment, apparatus, and manufacturing process) as well as operation methods (material recycling and product design), environmental risk and pollution can be reduced, and the negative effects on the use of resource and energy can be dimin-ished as well. In short, the concept of green innovation contains the following five perspectives: (1) to prolong the life cycle of the product, (2) to save energy, (3) to recycle and reuse, (4) to avoid or reduce the amount of waste and lessen its treatment problems, and (5) to cut down the use of hazardous materials, which are benefi-cial to the environmental protection and keep the eco-system balanced.
In general, during the product design process, custom-ers’ demand must be effectively adopted into the product development and design as well as the management per-formance evaluation, so that the customers’ demand can be met. Tseng,8 Tseng et al.,9 and Lin et al.10 pointed out that importance–performance analysis (IPA) is not only a technique which can compare relative positions for specific evaluation items based on two-dimensional (2D) matrixes, ‘‘importance’’ and ‘‘performance,’’ but also a method which can transfer the voices of customers into product development and management perfor-mance. Hollenhorst et al.,11 Gale,12 Garver,13 Deng et al.,14Lee et al.,15and Pan16all proposed the upgraded IPA method, which showed better judgment in the distri-bution of quality attributes. Also, Lin et al.10suggested that analytical network process (ANP) should be applied in IPA to solve the complicated problems of mutual reli-ance or feedback existing in goals of requirement, eva-luation dimensions, and evaeva-luation criteria.
Besides, according to Jia and Bai,17Wu,18 and Liu and Tsai,19 quality function deployment (QFD) can turn the voices of customers into product development as well as technical requirements to ensure that the product can meet customers’ satisfaction. Therefore, Lam,20 Lam and Lai,21 and Lin et al.22 ever incorpo-rated ANP and QFD into the green product innova-tion. To strengthen their entire competitiveness and consider their cost and effect, today’s enterprises will take their own technical limits into account while con-sidering customers’ demand. Consequently, Farrell,23 Charnes et al.,24Banker et al.,25Charnes and Cooper,26 Dobos and Vo¨ro¨smarty,27 and Song et al.28 came up with data envelopment analysis (DEA), able to offer enterprises the priority order of improvement in green product design.
Nevertheless, there are a lot of uncertainties and fac-tors of semantic ambiguity during the process of infor-mation collection of product design. Thus, Zadeh29 proposed a fuzzy theory using the mathematical model to describe some fuzzy concepts which cannot be defined, especially the fuzzy characteristics possessed by humans. Later, many scholars, such as Hun et al.,30 Li et al.,31and Wai et al.,32came up with another fuzzy theory combining the above method to deal with the problems of product design; however, the traditional fuzzy theory still cannot explain ‘‘uncertainty’’ of the human logic thinking, so Atanassov33 brought up the concept of intuitionistic fuzzy sets (IFS), changing the way of expressing membership by means of numbers resulted from the traditional fuzzy theory into the pro-portional way of expressions, like ‘‘agree,’’ ‘‘disagree,’’ and ‘‘neutrality.’’ Therefore, the IFS in the aspect of semantic scale expressions can better meet the mode of human thinking logic and are frequently used in uncer-tainties or inaccurate information.34–36
As a result, this study applies IPA, analytic network process (ANP), QFD, and DEA to construct an IFS-based evaluation mode for green product innovation design, which can effectively control the green innova-tive required items advantaging enterprises and more accurately transfer customers’ voices into technical
requirements; meanwhile, considering the limited
resources which enterprises are confronting, we offer references for the prioritization and intensification of the resources required by products’ green innovative technical features. Finally, this study takes the fuel bat-tery as an example explaining the application of this model, in order to offer enterprises a more precise prac-tical evaluation mode for their green product design.
Literature review
Green innovation
According to Bar37 (2015), green innovation means that enterprises adopt innovative products, new manu-facturing processes, new services, and innovative man-agement as well as business methods to prevent and sustainably reduce environmental risk as well as pollu-tion and to decrease the negative effect upon the use of resource and energy. Pujari3and Gouda et al.4 consid-ered that green innovation could help industries and enterprises bring both environmental and economic achievements. The needs of environmental achieve-ments often encourage enterprises to carry out green innovation; likewise, green innovation brings enter-prises economic achievements.
pollution included hardware (equipment, apparatuses, and manufacturing process) and operating methods (material recycling and product design). Kammerer1 and Qi et al.2suggested that enterprises should consider how to reduce the influence of the green product on the entire life cycle, reduce the use of poisonous substances and materials, control energy depletion and exhaust gas emission, prolong the expiration of product use, and so on.
To conclude, the concept of green innovation includes the following five perspectives: (1) to prolong the life span of the product; (2) to save energy; (3) to recycle, reuse; and protect the limited mineral resources on Earth, in order to reasonably sustain and use them; (4) to avoid the production of waste in use and reduce the amount of waste to decrease its treatment prob-lems; and (5) to minimize the use of hazardous materi-als, beneficial to the environmental protection and the maintenance of ecosystem balance.
IFS
In order to solve the problems of human thinking mode which involve subjectivity as well as ambiguity, Zadeh29 proposed Fuzzy Theory, which adopts the membership function of different degrees from 0 to 1 via fuzzy sets and is also a type of classification which can accept ambiguity.
Besides, IFS proposed by Atanassov33develops the method solving the membership problem—‘‘uncer-tainty’’—existing in the fuzzy theory, which can express ‘‘agree,’’ ‘‘disagree,’’ and ‘‘uncertainty.’’ Hence, IFS can better match human thinking logic in terms of semantic expression. Based on the concepts of Atanassov33and Gau and Buehrer,38 IFS is defined as a whole set, U=fx1,x2, . . .,xng; above U, an IFS, A, is A=
fx,huA(x),vA(x)ijx2Ug, in which uA(x):X ! ½0,1 means agree membership grade whileuA(x):X ! ½0,1
means disagree membership grade. When
uA(x) +vA(x)1, 1uA(x)vA(x) means uncertainty membership grade, as shown in a geometric diagram of Figure 1.
Wan and Li,39 Xu and Liao,40 and Das et al.41 pointed out that the IFS have been widely used, whose
advantages can objectively express human real
thoughts, and they can offer better performance in the aspects of dealing with uncertain information and sol-ving multiple attribute decision-making problems.
IPA
The structure of IPA was first submitted by Martilla and James42whose main concept was to put the average score of importance and performance levels into a 2D matrix; after using the 2D matrix to differentiate the relative positions of different average score attributes,
practical suggestions and strategic applications of spe-cific quality attributes were further proposed. Then, Hollenhorst et al.,11Gale,12Garver,13Deng et al.,14Lee et al.,15 and Pan16 all came up with the modified IPA method, which empowered the distribution status of quality attributes with more judgment power, as pre-sented in Figure 2.
Because the IPA method has its advantages, such as fast and easy to use, it is widely applied in various industries, including automobile industry, tourism, hos-pitality industry, real estate industry, educational indus-try, environmental protection, and medical care.8,42–48
ANP
ANP, proposed by Saaty,49 can solve the problems of mutual reliance and feedback existing among dimen-sions or criteria in the traditional analytic hierarchy process (AHP). Chung et al.50considered that based on AHP, ANP’s decision-making procedure could be divided into five steps:
1. Establish the network hierarchy structure of assessment.
2. Build pairwise comparison matrixes. Figure 1. IFS geometric diagram.
3. Compute the relative weight of each matrix. In this step, the relative weight of each matrix is computed to form unweighted supermatrix,M0.
4. Compute the supermatrix. In the computing process of ANP’s supermatrix, three matrixes are included: unweighted supermatrix—M0,
weighted supermatrix—M, and limit superma-trix—M. A supermatrix is composed of several
sub-matrixes; therefore, if the sum of line values is not 1, formula (1) will be used to multiplyM
to the power of k (k is a subjective decision value) for limiting, and then limit superma-trix—M*—can be thus obtained49
M= lim
k!‘M
k; k2power ð1Þ
5. Select the best plan. Decision-makers can employ the received limit value afterMis mul-tiplied several times as the selection standard of the best plan.
QFD
QFD was first applied in the shipbuilding industry and electronic industry. Through the feature links of prod-ucts or services, it can transfer customers’ voices and expectations into parameters of product design, so that the quality of the product can be enhanced and the cost of product development can be lowered.51According to Liu and Tsai,19 house of quality (HOQ) comprises six major factors—demand for quality, element of quality, relationship matrix, competitive performance, weight of quality element, and correlation matrix. Applying the QFD computing process can gradually change custom-ers’ demand into technical requirement, which can help enterprises shorten the cycle of product development and reduce the times of engineering change. Moreover, it can help decrease the cost of production effectively.
Furthermore, many scholars use fuzzy quality func-tion deployment (fuzzy-QFD) as an assistant decision-making tool which can convert ambiguous semantics into more definite market demand or customers’ demand.17–19,52However, because a lot of factors, such as uncertainties and semantic ambiguity, exist in the process of information collection for the product design, and the traditional fuzzy theory cannot explain the part of ‘‘uncertainty’’ of human logic and thinking, this study develops fuzzy-QFD to more objectively consider customers’ needs during the decision-making process of product design and development and then to achieve the goal of advancing customers’ satisfaction.
DEA
DEA originated in an assessment measurement of rela-tive efficiency developed by Farrell23 considering the
notion of efficiency frontier, which divided the zone of over efficiency (OE) into technical efficiency (TE) and allocation efficiency (AE). OE is the product of OE and TE. By the appropriate allocation of production ele-ments, the relationship between the lowest input cost and performance can be perceived.
On the basis of Farrell’s theory, the Charnes, Cooper and Rhodes (CCR) mode presented by Charnes et al.24is a general mode which measures multiple inputs and out-puts built under constant returns to scale (CRS). Besides, the concept of variable returns to scale (VRS) introduced by Banker et al.25replaces the mathematic planning mode of CRS in the original CCR mode to match practical applications under different circumstances. This is called Banker, Charnes and Cooper (BCC) mode. These two modes are commonly recognized as the most influential modes in the field of DEA by the academia.53
Due to DEA’s advantages in use, its excellent flexi-bility and its assessment on inputs and outputs of a sin-gle item or multiple items, it is widely used by many scholars to evaluate the operation performance in each professional field, including government departments, military, life insurance industry, banking industry, and environmental protection.26–28,54
Methodology
Green product innovation has become not only a criti-cal issue for modern business operation and manage-ment decision-making but also one of the important bases of enterprise competition advantages. This study considers benchmark enterprises’ competitiveness and enterprise resource allocations, applies the intuitionistic fuzzy theory, and integrates IPA, ANP, QFD, and DEA into a mode, to construct an evaluation mode of intuitionistic fuzzy–based innovation design which can effectively control the green innovative required items advantaging enterprises and more accurately transfer customers’ voices into technical requirements; mean-while, considering the limited resources which enter-prises are confronting, we offer references for the prioritization and intensification of the resources required by products’ green innovative technical fea-tures. Its detailed procedures are described as follows:
Step 1. Develop the green innovative objective hierar-chy dimension of the product. Identify the decision-making objective hierarchy structure of the study and establish the selection dimensions as well as selection criteria of the green product innovation by means of the literature collection, combining profes-sional opinions with industrial characteristics, and customers’ demand for the green product design.
dimension and selection criteria is received and regarded as the lateral axis (Axis X) of the IPA eva-luation matrix.This study considers that the compli-cated relationships of mutual reliance and feedback may exist in each hierarchy objective selection dimension and selection criterion, so that it is unsui-table to use the traditional AHP method for compu-tation. Thus, it is suggested that IFS-ANP be used as the foundation to deal with the importance weight of the decision-making, of which the relevant procedures are made as below:
Step 2.1.The expert team converts the intuitionistic fuzzy semantic rating list into intuitionistic fuzzy inter-val inter-values, referring to the nine-point intuitionistic fuzzy semantic scale transfer list of Zhang and Liu,55 as shown in Table 1. The necessary selection dimen-sionASi, selection criterionCij, and each intuitionistic fuzzy pairwise comparison matrixDe of feedback or mutual reliance between selection dimensions and selection criteria for developing green product innova-tion are separately set up and then the weight of every element is calculated. This study refers to the method proposed by Abdullan et al.56 and the AHP theory, combines them and then extends their applications, so that formula (2) is received
A11 A12 A13 A1n
De= A11
A21
A31
.. .
Am1
1 A12 A13 A1n A21 1 A23 A2n A31
.. .
A32
.. .
1
.. .
. . .
A3n
.. .
Am1 Am2 Am3 1
2
6 6 6 6 6 6 4
3
7 7 7 7 7 7 5
)
1 ½m12,1n12 ½m13,1n13 ½m1n,1n1n
m21,1n21
½ 1 ½m23,1n23 ½m2n,1n2n
m31,1n31
½
.. .
m32,1n32
½
.. .
1
.. .
. . .
m3n,1n3n
½
.. .
mm1,1nm1
½ ½mm1,1nm2 ½mm3,1nm3 1
2
6 6 6 6 6 6 4
3
7 7 7 7 7 7 5
ð2Þ
in which, the total score of each selection plan is Aij=½Smj=1uij, Smj=1(1vij), i=1,2. . .,m, j=1, 2. . .,n. After the selection plan is normalized, the weightW~ijof the necessary selection plan for each green product innovation can thus be received and displayed in formula (3) as below
~
Wij= Aij Pn i=1
Aij =
Pm j=1
uij, P m j=1
(1vij)
" #
Pn i=1
Pm j=1
uij, P n i=1
Pm j=1
(1vij)
" #
=
Pm j=1
uij
Pn i=1
Pm j=1
(1vij) ,
Pm j=1
(1vij)
Pn i=1
Pm j=1
uij 2
6 6 6 4
3
7 7 7 5
ð3Þ
In addition, in the process of group decision-mak-ing, many experts usually get together for discussions. Therefore, this study adopts the fuzzy set average com-putation of Klir and Yuan,57which unifies intuitionis-tic fuzzy rating values of various experts into one single intuitionistic fuzzy rating value by geometric mean, as indicated in formulas (4) and (5), in which the gathered group intuitionistic fuzzy rating values are ~Sij(u) and
~
Sij(v)
Table 1. Intuitionist fuzzy ANP semantic scale.
ANP ratings Semantics Intuitionist fuzzy value (m,n)
9 Relatively extremely important (0.95, 0.05)
7 Relatively largely important (0.85, 0.10)
5 Relatively important (0.75, 0.15)
3 Relatively slightly important (0.65, 0.25)
1 Equally important (0.50, 0.40)
1/3 Relatively slightly unimportant (0.35, 0.55)
1/5 Relatively unimportant (0.25, 0.65)
1/7 Relatively largely unimportant (0.15, 0.80)
1/9 Relatively extremely unimportant (0.05, 0.95)
~
Sij(u) =
ffiffiffiffiffiffiffiffiffiffiffiffiffiffiffiffiffiffiffiffiffiffiffiffiffiffiffiffiffiffiffiffiffiffiffiffiffiffiffiffiffiffiffiffiffiffiffiffiffiffiffiffiffiffiffi S1
ij(u)3S2ij(u)3 3Shij(u)
1 h q
;
i=1,. . .,m; j=1,. . .,n; h=1,. . .,p
ð4Þ
~
Sij(v) =
ffiffiffiffiffiffiffiffiffiffiffiffiffiffiffiffiffiffiffiffiffiffiffiffiffiffiffiffiffiffiffiffiffiffiffiffiffiffiffiffiffiffiffiffiffiffiffiffiffiffiffiffiffiffi S1
ij(v)3Sij2(v)3 3Sijh(v)
1 h q
;
i=1,. . .,m; j=1,. . .,n; h=1,. . .,p
ð5Þ
In the formulas, S~ij(u) and ~Sij(v) individually repre-sent the gathered agree and disagree intuitionist fuzzy rating values of the group decision-making (there arep
experts) based on the ratings of selection dimensionASi and selection criterionCij.
Step 2.2.After introducing the method of fication, this study refers to and expands the defuzzi-fication method of Hung et al.,58 assuming that personal decision-making act will be influenced by the public preference. That means when the crowd mostly tends to agreement, the people who first have no idea will have more willingness of agreement. This concept can allocate the people who have no idea into ‘‘agree’’ and ‘‘disagree’’ in proportion. The proportions of ‘‘agree’’ and ‘‘disagree’’ for each item separately representS~ij(u) and~Sij(v), as shown in for-mula (6), and then the definite rating weight wij is received based on each selection dimension ASiand selection criterionCij
wij=
~
Sij(u)
~
Sij(u) +~Sij(v)
; i=1,. . .,m; j=1,. . .,n ð6Þ
Step 2.3. Compute the consistency of each pair-wise matrix and its identical indexes CI as well as
CR, as indicated in formulas (7) and (8). According to Saaty,59the value ofCI\0.1 is better
CI=lmaxn
n1 ð7Þ
CR=CI
RI ð8Þ
lmaxrepresents the maximum eigenvalue, ‘‘n’’
repre-sents the exponent number of the matrix,RImeans ran-dom index, and a differentCIresulted from a different exponent number. Thus, observed from the exponent number of matrix, the correspondent RIcan be found (as displayed in Table 2).
Step 2.4. After the definite rating weight wij of each selection dimension (ASi) and selection criterion (Cij) for each sub-matrix received in Step 2.2 are inte-grated and introduced, the unweighted supermatrix
M#can be obtained. Then, considering the line value of the matrix may not fit in the line random rule, we have to convert it into weighted supermatrix, repre-sented as M here. Also, formula (9) is applied, in which the weighted supermatrixMto thekth power is multiplied, so that the limit supermatrix M* can be retrieved and the importance Iof each selection dimension (ASi) as well as selection criterion (Cij) for green product innovation can be obtained
M= lim
k!‘M
k; k2power ð9Þ
In the formula, krepresents the power of exponent number;k=2729.
Step 3. Separately compute their performance and their performance ratio of the green product innova-tion selecinnova-tion dimension and selecinnova-tion criterion among the case-study enterprises and best competitors as to ratify the ordinate axis (Axis Y) of the IPA evalua-tion matrix.
Step 3.1. The expert team uses Table 1 to give the case-study enterprises and best competitors their performance grading values of green innovative product selection dimensions and selection criteria. Also, they apply formulas (4) and (5) to gather all experts’ interval fuzzy ratings as the group perfor-mance value,~P.
Step 3.2. Introducing the defuzzification method, this study adopts the defuzzification method pro-posed by Hung et al.,58as indicated in formula (6), to receive the definite performance value, P, for each selection dimension and selection criterion.
This study applies the modified IPA mode to calcu-late the satisfactory mean of each service item for the case-study enterprises and the performance ratio (PR) value of the satisfactory mean for the best competitors, as shown in formula (10). The PR value replaces the traditional IPA evaluation matrix performance stan-dard value (AxisY)
Table 2. Random index.
Exponent number 1 2 3 4 5 6 7 8 9 10
RI 0.00 0.00 0.58 0.90 1.12 1.24 1.32 1.41 1.45 1.49
Performance ratioðPRÞ=
Quality satisfactory mean of the case-study enterprise Quality satisfactory mean of the best competitors
ð10Þ
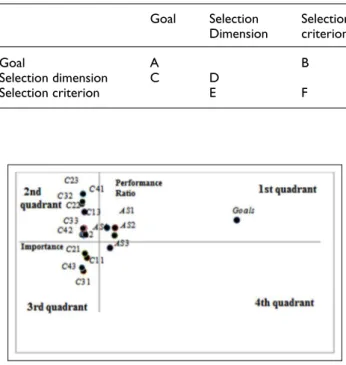
Step 4. Draw the evaluation matrix of IFS-IPA. Through Steps 2 and 3, valuesIand PR of the selec-tion dimension ASi and selection criterion Cij for green product innovation are received as the lateral axis (AxisX) and the ordinate axis (AxisY) of the IFS-IPA evaluation matrix, displaying the attribute evaluation result in the IFS-IPA performance eva-luation matrix.
Step 5. Conduct the advantage and disadvantage anal-ysis of the IFS-IPA evaluation matrix.Based on the IFS-IPA evaluation matrix graph of green product innovation in Step 4, the advantage and disadvan-tage analysis of the green product innovation
strat-egy and the management connotation are
conducted, in order to provide enterprises with references of the efficient business operation.
Step 6. Based on the importance rating of the IFS-IPA evaluation matrix, extract the quality attribute of the first 60% of green product innovation design as the items of CRs in HOQ.
Step 7. Through experts’ interviews, intuitionistic fuzzy semantic grading, and grade collecting, the intuitionistic fuzzy weight of each CRs is computed. According to the obtained items of CRs in Step 6, the importance weight is computed. Then, grading is conducted by means of experts’ questionnaires and the introduc-tion of intuiintroduc-tionistic fuzzy concept. As to the grad-ing standards, they can be referred to Table 1. The grading weightwh
CRs for each item of CRs is given by each expert applying formula (11) to aggregate the CRs group IFS into the weight,w~CRs
~
wCRs(u) =
ffiffiffiffiffiffiffiffiffiffiffiffiffiffiffiffiffiffiffiffiffiffiffiffiffiffiffiffiffiffiffiffiffiffiffiffiffiffiffiffiffiffiffiffiffiffiffiffiffiffiffiffiffiffiffiffiffiffiffiffiffiffiffiffiffiffiffiffi w1
CRs(u)3w 2
CRs(u)3 3w h CRs(u) 1
h q
;
s=1,. . .,z; h=1,. . .,p
ð11Þ
In the formula, whCRs represents the intuitionistic fuzzy weight of thesth item of CRs evaluated by the
hth expert.
Step 8. Induce the required item DRtfor the technical
importance of the green product development.
Step 9. Set up the intuitionistic fuzzy quality house, in which the expert team conducts their intuitionistic fuzzy semantic grading of the central relationship matrix. After confirming customers’ demand and technical requirements in Steps 7 and 8, the expert team conducts their intuitionistic fuzzy semantic grading of the central relationship matrix in the HOQ. This study defines that in HOQ there are z items for CRs and g items for DRt. As to the central
relationship matrix of HOQ, Table 1 is adopted to convert definite values into intuitionistic fuzzy val-ues. Subsequently, the relevant data Rk
st of the cen-tral relationship matrix is thus received, as shown in formula (12)
Rhst= x, (mRh
st,1vRhst)
n o
;
s=1,. . .,z; t=1,. . .,g; h=1, . . .,p
ð12Þ
In the formula, uRh
st(x) and vRhst(x) individually
indi-cate the ‘‘agree’’ membership grade and the ‘‘disagree’’ membership grade among the central relationship IFS of the relevant grading for thesth item of CRs and the
tth item ofDRtevaluated by thehth expert.
Step 10. Compute the IFS value for each DRtweight.
Step 10.1. In the dimension of satisfying custom-ers’ need, the importance technique weight for the technical requirement, whDRt,of each product can be received via formula (13), which displays the central relationship matrix value for each line,Rhct, multiply-ing its correspondmultiply-ing importance,w~CRs, for each item of CRs
whDRt= X z
s=1
~
wCRs3Rhst; s=1,. . .,z;
t=1,. . .,g; h=1,. . .,p
ð13Þ
In the formula, Rk
ct indicates the IFS values of the central relationship matrix for thesth item of CRs and thetth item of DRtin the HOQ evaluated by the hth expert.w~CRs represents the IFS value of the importance weight for thesth item of CRs whilewk
DRt indicates the
IFS value of the technical importance rating for tth item ofDRtgraded by thehth expert.
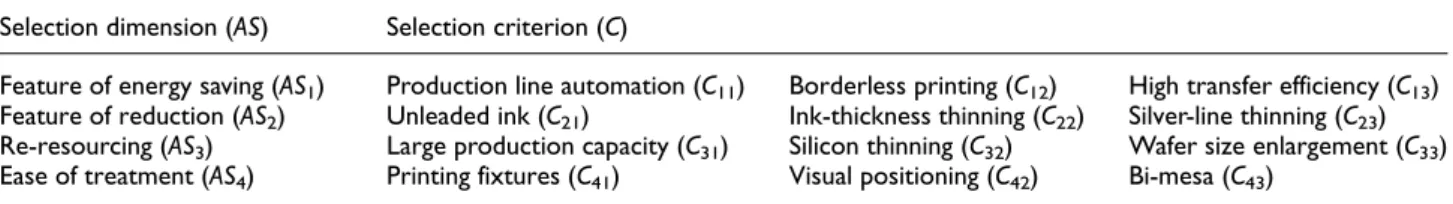
Table 3. Hierarchy of innovative demand for green products.
Selection dimension (AS) Selection criterion (C)
Feature of energy saving (AS1) Production line automation (C11) Borderless printing (C12) High transfer efficiency (C13)
Feature of reduction (AS2) Unleaded ink (C21) Ink-thickness thinning (C22) Silver-line thinning (C23)
Re-resourcing (AS3) Large production capacity (C31) Silicon thinning (C32) Wafer size enlargement (C33)
Step 10.2. According to the weightwhDRt obtained from each expert’s important technical grading in Step 10.1 and the weight aggregated by group sets through formula (14), the weightw~DRt of group
tech-nical importance ratings can be received
~
wDRt(u) =
ffiffiffiffiffiffiffiffiffiffiffiffiffiffiffiffiffiffiffiffiffiffiffiffiffiffiffiffiffiffiffiffiffiffiffiffiffiffiffiffiffiffiffiffiffiffiffiffiffiffiffiffiffiffiffiffiffiffiffiffiffiffiffiffiffiffiffiffi w1
DRt(u)3w 2
DRt(u)3 3w h DRt(u) 1
h q
;
t=1,. . .,g; h=1,. . .,p
ð14Þ
Step 11. Select the DEA mode, and define the value of IFSs for the weight of each DRs as DMU. This study introduces DEA and regards each item of DRs as each decision making unit (DMU) in the mode of DEA-CCR-I. In the established importance weight of CRs, it is expected that the minimum of the input item can effectively enhance the relevant efficiency of DMU. Therefore, this study adopts the performance evalua-tion mode of w~DRt measuring the importance grading
of green product innovative design and technology.
Step 12. Determine the input and output items of the DEA mode. The related settings for the input and out-put items of the DEA mode in this study are described as below. The system featureDRtfor the product design and technology is set as DMU. Cost and executing diffi-culty are input items while the weightw~DRt for technical
importance ratings is the output item:
1. Input items: Use experts’ questionnaires and introduce the intuitionistic fuzzy concept to con-duct grading. The grading standards are referred to Table 1. Regarding two items—enterprises’
cost and executing difficulty for the green prod-uct innovation—each expert in the project team will grade them.
2. Output item: The weight w~DRt for technical
importance ratings is regarded as an output item.
Step 13. Select the analysis of the DEA mode and the technical importance rating for each item’s order, DRt. According to the enterprises’ project evalua-tion stage, usually in the fixed aim, enterprises use their resources to design green products. As a result, the input-oriented fixed scale reward CCR mode is employed to compute the corresponding efficiency value of each DMU by each input item and output item and to prioritize the valid degree of use for the resource of each DMU based on its efficiency value.
Empirical analysis
This study takes some Taiwanese listed company’s tech-nical development requirements for the green fuel bat-tery modularization as an empirical example. When using the items required by the green product innova-tion development, 4 major dimensions and 12 criteria are proposed through documentary reviews and experts’ interviews, in order to assess the innovative design and demand for the new generation fuel battery module, as illustrated in Table 3.
IPA of IFS
innovation selection dimensions and selection criteria as the lateral axis (Axis X) of the IPA evaluation matrix. First, the assessment criteria can be obtained through experts’ interviews, expressed in the relation-ship diagram of reliance and feedback between dimen-sions and criteria, as shown in Figure 3.
Subsequently, based on Figure 3, this study con-structs the corresponding position of each sub-matrix in the supermatrix and develops the pairwise compara-tive matrix of the selection dimensionASi(i= 1, 2, 3, 4) and selection criterionCij(i= 1, 2, 3, 4; j= 1, 2, 3) for green product innovation, as described in Table 4.
Next, the definite weightwijobtained from each sub-matrix is introduced into the supersub-matrix for calcula-tion and then sub-matrixes A, B, C, D, E, and F are integrated to receive the unweighted supermatrix M#, as shown in Table 5.
This study discovers that the line values in M# do not match the line random principle, so they need to be transferred into weighted supermatrixM. Also, the lim-iting supermatrixM* will be received using formula (9), and the importance weightIof the selection dimension
ASias well as the selection criterionCijfor green prod-uct innovation will be obtained, as shown in Table 6.
Following formulas (6) and (10) in Step 3, the indi-vidual performance standard values P and PR of the selection dimensionASi and the selection criterion Cij for the green product innovation design carried out by the case-study enterprises and benchmarking competi-tors will be calculated, as seen in Table 7.
Last, this study organizes the data of importance I
and performance ratio PR obtained from Step 2 and Step 3 and displays them in Table 8. Based on the data, the IFS-IPA evaluation matrix is drawn (as illustrate in Figure 4) to analyze how the case-study enterprises carry out their present innovative design for green products.
QFD of IFS
Extract customers’ demand and technical requirements. To effectively provide companies with references for their resource adjustment, in the abovementioned impor-tance of the IFS-IPA evaluation matrix for the innova-tive green-product design, 12 items for green product innovation extracted from the first 60% of quality attri-bute items as important customers’ demand items in the HOQ, as displayed in Table 9.
This study refers to the related researches of Pujari3 and asks the project team for their opinions. As a result, this study sorts out nine items of green product design and technical requirements, such as ‘‘To simplify the product and reduce waste material’’ (DR1), as shown in Table 10.
Build the intuitionistic fuzzy HOQ. The project team con-ducts the intuitionistic fuzzy semantic grading based on the intensity of HOQ relationship between the 12 items of customers’ demand and the 9 items of technical requirements. By means of formula (12), which gathers each expert’s intuitionistic fuzzy grading value Rh
st of the central relationship matrix, integrated with the intuitionistic fuzzy importance of the group CRs—
~
wCRs—extracted from IFSs-IPA, and via the calcula-tions of formulas (13) and (14), the intuitionistic fuzzy HOQ for this group of experts is completed to finally calculate the intuitionistic fuzzy valuew~DRt of eachDRt
for the group technical importance grading, as shown in Table 11.
According to Table 11, the result shows that in terms of green product innovation features, ‘‘To simplify the product and reduce waste material,’’ ‘‘Easy-to-disas-semble spare part design,’’ and ‘‘To reduce unnecessary paint coating’’ are the three items that are quite impor-tant technical features for design, so that enterprises should try to maintain these three critical technical items, in order to raise customers’ satisfaction.
DEA of IFS
Determine the input (output) items of the DEA mode. This study sets up nine items of design technical features as DMU based on the concept of incorporating the IFS with DEA. Meanwhile, through experts’ question-naires, cost and execution difficulty set as two input Table 4. The corresponding position of each sub-matrix in the
supermatrix.
Goal Selection
Dimension
Selection criterion
Goal A B
Selection dimension C D
Selection criterion E F
Goals AS1 AS2 AS3 AS4 C11 C12 C13 C21 C22 C23 C31 C32 C33 C41 C42 C43
Goals 1.0000 0.0000 0.0000 0.0000 0.0000 1.0000 1.0000 1.0000 1.0000 1.0000 1.0000 1.0000 1.0000 1.0000 1.0000 1.0000 1.0000
AS1 0.2498 0.3021 0.2764 0.3089 0.2742 0.0000 0.0000 0.0000 0.0000 0.0000 0.0000 0.0000 0.0000 0.0000 0.0000 0.0000 0.0000 AS2 0.2725 0.2542 0.2764 0.2375 0.2737 0.0000 0.0000 0.0000 0.0000 0.0000 0.0000 0.0000 0.0000 0.0000 0.0000 0.0000 0.0000 AS3 0.2496 0.2323 0.2515 0.2375 0.2085 0.0000 0.0000 0.0000 0.0000 0.0000 0.0000 0.0000 0.0000 0.0000 0.0000 0.0000 0.0000 AS4 0.2281 0.2114 0.1958 0.2161 0.2435 0.0000 0.0000 0.0000 0.0000 0.0000 0.0000 0.0000 0.0000 0.0000 0.0000 0.0000 0.0000
C11 0.0000 0.3987 0.0000 0.0000 0.0000 0.1216 0.1019 0.0925 0.1023 0.1037 0.0877 0.1006 0.0716 0.0903 0.0927 0.1019 0.1145 C12 0.0000 0.3006 0.0000 0.0000 0.0000 0.1016 0.1019 0.0839 0.0771 0.0790 0.0877 0.0842 0.0716 0.0903 0.0927 0.0768 0.1049 C13 0.0000 0.3006 0.0000 0.0000 0.0000 0.0839 0.0768 0.0925 0.0771 0.0868 0.1163 0.0842 0.0716 0.0903 0.0765 0.0768 0.0791
C21 0.0000 0.0000 0.3321 0.0000 0.0000 0.1016 0.0768 0.0925 0.1023 0.0950 0.0877 0.0842 0.0950 0.0903 0.0844 0.1019 0.0872 C22 0.0000 0.0000 0.3586 0.0000 0.0000 0.0839 0.0768 0.0925 0.0771 0.0868 0.0416 0.0842 0.0950 0.0903 0.0844 0.0768 0.0791 C23 0.0000 0.0000 0.3093 0.0000 0.0000 0.0794 0.1019 0.0563 0.0365 0.0950 0.0416 0.0921 0.0716 0.0428 0.0927 0.0406 0.1049
C31 0.0000 0.0000 0.0000 0.3178 0.0000 0.0794 0.0768 0.0563 0.1319 0.0950 0.0416 0.0921 0.0950 0.0428 0.0844 0.1314 0.0872 C32 0.0000 0.0000 0.0000 0.2960 0.0000 0.0839 0.0364 0.0839 0.0771 0.0717 0.0877 0.0695 0.0950 0.0903 0.0513 0.0768 0.0479 C33 0.0000 0.0000 0.0000 0.3862 0.0000 0.0651 0.0406 0.0621 0.0365 0.1039 0.0877 0.1007 0.0950 0.0428 0.0513 0.0364 0.0479
C41 0.0000 0.0000 0.0000 0.0000 0.3078 0.0508 0.1314 0.0839 0.0771 0.0556 0.0877 0.0695 0.0950 0.0903 0.1205 0.0768 0.0901 C42 0.0000 0.0000 0.0000 0.0000 0.4083 0.0925 0.1019 0.1017 0.1023 0.0717 0.1163 0.0695 0.0716 0.1198 0.0927 0.1019 0.0958 C43 0.0000 0.0000 0.0000 0.0000 0.2839 0.0563 0.0768 0.1017 0.1023 0.0556 0.1163 0.0695 0.0716 0.1198 0.0765 0.1019 0.0614
Not randomized super matrix is called the unweighted Super matrix (unweighted super-matrix).
Adv
anc
es
in
Mechan
ic
al
Eng
ine
Table 6. Limiting supermatrixM*.
Goals AS1 AS2 AS3 AS4 C11 C12 C13 C21 C22 C23 C31 C32 C33 C41 C42 C43
Goals 0.333 0.333 0.333 0.333 0.333 0.333 0.333 0.333 0.333 0.333 0.333 0.333 0.333 0.333 0.333 0.333 0.333
AS1 0.09 0.09 0.09 0.09 0.09 0.09 0.09 0.09 0.09 0.09 0.09 0.09 0.09 0.09 0.09 0.09 0.09
AS2 0.089 0.089 0.089 0.089 0.089 0.089 0.089 0.089 0.089 0.089 0.089 0.089 0.089 0.089 0.089 0.089 0.089
AS3 0.08 0.08 0.08 0.08 0.08 0.08 0.08 0.08 0.08 0.08 0.08 0.08 0.08 0.08 0.08 0.08 0.08
AS4 0.074 0.074 0.074 0.074 0.074 0.074 0.074 0.074 0.074 0.074 0.074 0.074 0.074 0.074 0.074 0.074 0.074 C11 0.034 0.034 0.034 0.034 0.034 0.034 0.034 0.034 0.034 0.034 0.034 0.034 0.034 0.034 0.034 0.034 0.034 C12 0.028 0.028 0.028 0.028 0.028 0.028 0.028 0.028 0.028 0.028 0.028 0.028 0.028 0.028 0.028 0.028 0.028 C13 0.028 0.028 0.028 0.028 0.028 0.028 0.028 0.028 0.028 0.028 0.028 0.028 0.028 0.028 0.028 0.028 0.028
C21 0.03 0.03 0.03 0.03 0.03 0.03 0.03 0.03 0.03 0.03 0.03 0.03 0.03 0.03 0.03 0.03 0.03
C22 0.029 0.029 0.029 0.029 0.029 0.029 0.029 0.029 0.029 0.029 0.029 0.029 0.029 0.029 0.029 0.029 0.029 C23 0.026 0.026 0.026 0.026 0.026 0.026 0.026 0.026 0.026 0.026 0.026 0.026 0.026 0.026 0.026 0.026 0.026 C31 0.027 0.027 0.027 0.027 0.027 0.027 0.027 0.027 0.027 0.027 0.027 0.027 0.027 0.027 0.027 0.027 0.027 C32 0.024 0.024 0.024 0.024 0.024 0.024 0.024 0.024 0.024 0.024 0.024 0.024 0.024 0.024 0.024 0.024 0.024 C33 0.026 0.026 0.026 0.026 0.026 0.026 0.026 0.026 0.026 0.026 0.026 0.026 0.026 0.026 0.026 0.026 0.026 C41 0.025 0.025 0.025 0.025 0.025 0.025 0.025 0.025 0.025 0.025 0.025 0.025 0.025 0.025 0.025 0.025 0.025 C42 0.031 0.031 0.031 0.031 0.031 0.031 0.031 0.031 0.031 0.031 0.031 0.031 0.031 0.031 0.031 0.031 0.031 C43 0.024 0.024 0.024 0.024 0.024 0.024 0.024 0.024 0.024 0.024 0.024 0.024 0.024 0.024 0.024 0.024 0.024
After randomization weighting matrix is called super matrix (weighted super-matrix).
Table 7. Performance table for the green product innovation of the case-study enterprises and benchmarking competitors.
Performance Goals AS1 AS2 AS3 AS4 C11 C12 C13 C21 C22 C23 C31 C32 C33 C41 C42 C43
Company 0.8015 0.7368 0.7368 0.7339 0.7339 0.7368 0.6732 0.8000 0.6732 0.8716 0.8015 0.5556 0.9430 0.8015 0.8716 0.6126 0.5556 Competitor 0.6126 0.6126 0.6692 0.8015 0.6126 0.9474 0.6126 0.6732 0.8015 0.6126 0.4769 0.9474 0.6126 0.6732 0.5556 0.5556 0.8716 PRvalue 1.3083 1.2027 1.1011 0.9167 1.1980 0.7778 1.0989 1.1884 0.8399 1.4226 1.6807 0.5864 1.5393 1.1906 1.5688 1.1027 0.6374
PR: performance ratio.
Table 8. Importance and performance of the green product innovation.
Evaluation item Goals AS1 AS2 AS3 AS4 C11 C12 C13 C21 C22 C23 C31 C32 C33 C41 C42 C43 Mean
I 0.3330 0.09 0.089 0.08 0.074 0.034 0.028 0.028 0.03 0.029 0.026 0.027 0.024 0.026 0.025 0.031 0.024 0.0587 PRvalue 1.3129 1.2027 1.0946 0.9167 1.2037 0.7756 1.0989 1.1969 0.8369 1.4291 1.6867 0.5848 1.5424 1.1948 1.5760 1.1027 0.6345 1.0000
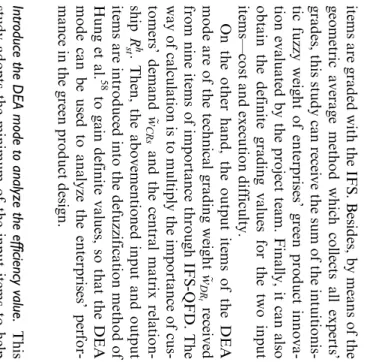
are gra ded wit h th e IFS . Besi des , by mea ns of the ric ave rag e met hod whic h col lec ts all exp erts ’ , th is stu dy ca n re cei ve the sum of the in tuit io nis -zy weig ht of ent er pri se s’ gre en pro duct inno va-eval uat ed by the pr oje ct tea m. Fi nal ly, it can als o the def init e gra din g va lue s fo r the two inp ut cost and exec ut ion diff icu lt y. th e ot her hand , the outp ut ite ms of the DEA are of th e tec hni ca l gr adi ng wei ght ~ w DR t rec eiv ed ni ne item s of imp or tan ce th rou gh IFS -QF D. The of cal cul ati on is to mul tip ly the imp or tan ce of cus -s’ dem and ~ w CRs and the cen tral mat rix rela tion -R h st . The n, the abov eme ntio ned inp ut and out put ar e in tro duce d in to th e def uzz ifi cat io n met hod of et al. 58 to gai n def in ite val ues , so th at th e DEA can be use d to ana lyz e th e ent erp ris es’ per for -ce in th e gre en pro duct desi gn. ce the DEA mod e to an alyz e th e eff ic iency valu e. This adop ts the min imu m of the inp ut it ems to hel p nce th e cor res pon di ng effi cie ncy val ue of the on-maki ng uni t. Thu s, the DEA ana lysi s mode is
Table 11. Group experts’ intuitionistic fuzzy house of quality.
Customers’ demand Importance Green product design technical features
DR1 DR2 DR3 DR4 DR5 DR6 DR7 DR8 DR9
u v u v u v u v u v u v u v u v u v u v
CR1 0.8581 0.0855 0.9500 0.0500 0.5000 0.4000 0.0500 0.9500 0.9500 0.0500 0.9500 0.0500 0.5000 0.4000 0.5000 0.4000 0.0500 0.9500 0.2874 0.2668 CR2 0.6928 0.1710 0.7670 0.1000 0.3560 0.1334 0.2321 0.5337 0.3560 0.1334 0.5000 0.4000 0.5000 0.4000 0.9500 0.0500 0.0500 0.9500 0.5000 0.4000 CR3 0.6928 0.1710 0.7670 0.1000 0.3560 0.1334 0.2874 0.2668 0.2321 0.5337 0.5000 0.4000 0.2321 0.5337 0.9500 0.0500 0.5000 0.4000 0.6193 0.2000 CR4 0.7000 0.2500 0.7670 0.1000 0.5000 0.4000 0.7670 0.1000 0.5000 0.4000 0.0500 0.9500 0.2321 0.5337 0.2874 0.2668 0.5000 0.4000 0.1334 0.3560 CR5 0.6928 0.1710 0.7670 0.1000 0.9500 0.0500 0.5000 0.4000 0.5000 0.4000 0.2321 0.5337 0.5000 0.4000 0.2874 0.2668 0.0500 0.9500 0.1334 0.3560 CR6 0.5593 0.3420 0.0500 0.9500 0.5000 0.4000 0.2321 0.5337 0.1334 0.3560 0.5000 0.4000 0.0500 0.9500 0.0500 0.9500 0.0500 0.9500 0.5000 0.4000 CR7 0.6257 0.2924 0.0500 0.9500 0.7670 0.1000 0.1334 0.3560 0.1077 0.7120 0.2321 0.5337 0.0500 0.9500 0.0500 0.9500 0.2874 0.2668 0.2321 0.5337 CR8 0.5593 0.3420 0.5000 0.4000 0.2321 0.5337 0.5000 0.4000 0.6193 0.2000 0.1077 0.7120 0.1334 0.3560 0.5000 0.4000 0.2874 0.2668 0.2321 0.5337 CR9 0.4966 0.3524 0.5000 0.4000 0.1077 0.7120 0.6193 0.2000 0.5000 0.4000 0.2321 0.5337 0.1334 0.3560 0.5000 0.4000 0.1334 0.3560 0.5000 0.4000 CR10 0.3969 0.4820 0.9500 0.0500 0.0500 0.9500 0.1077 0.7120 0.0500 0.9500 0.1077 0.7120 0.6193 0.2000 0.1077 0.7120 0.5000 0.4000 0.5000 0.4000 CR11 0.3150 0.5809 0.9500 0.0500 0.5000 0.4000 0.0500 0.9500 0.0500 0.9500 0.1077 0.7120 0.0500 0.9500 0.1077 0.7120 0.0500 0.9500 0.5000 0.4000 CR12 0.3150 0.5809 0.1077 0.7120 0.5000 0.4000 0.0500 0.9500 0.5000 0.4000 0.1077 0.7120 0.0500 0.9500 0.0500 0.9500 0.0500 0.9500 0.1077 0.7120 Technical importance grading 4.2436 0.0001 3.2082 0.0003 2.1609 0.0034 2.8488 0.0006 2.4147 0.0030 1.9225 0.0080 2.8253 0.0009 1.4734 0.0225 2.4008 0.0010
Technical importance ranking 1 2 7 3 6 8 4 9 5
The main objective is to obtain the sort of design requirements (show in bold).
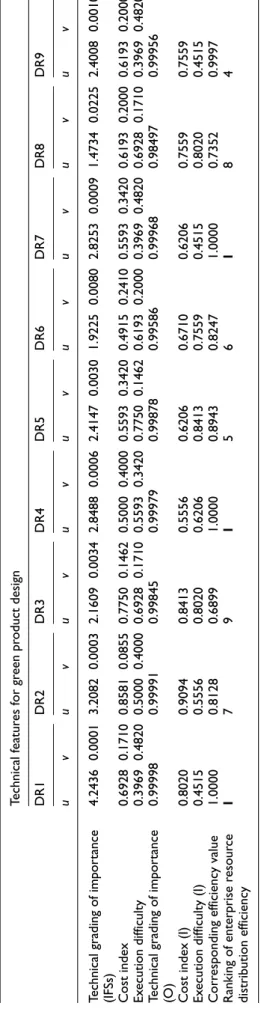
set as the CCR mode of input orientation and fixed rewards. After determining the decision-making unit, input and output items, and selecting the DEA analysis mode, this study introduces the software of DEA-Solver Pro 6.0 version into the personal computer for execution, and the entire computing result is presented in Table 12.
According to the corresponding efficiency value revealed in Table 12, the efficiency value is 1, whose three technical requirements are ‘‘To simplify the prod-uct and reduce waste material’’ (DR1), ‘‘To reduce
unnecessary paint coating’’ (DR4), and ‘‘Recycling
equipment of the waste’’ (DR7).
To sum up, this study analyzes and compares the importance ranking of the two modes, as demonstrated in Table 13. If a company considers the importance of the customers, the first three important items of techni-cal requirements will be seen as DR1, DR2, and DR4 through the computation of IFSs-QFD. By contrast, under the fixed condition of customers’ demand, cost and execution difficulty are input as measuring factors; as a result, the first three important items of technical requirements will become DR1, DR4, and DR7 after the computation of IFSs-QFD + DEA is introduced. Additionally, comparing the total ranking in these two different modes, only DR1 and DR4 are listed in top three in each mode, and the ranking differences of DR2 and DR7 are obvious whereas those of the others are minor. T able 12. The computing result list of IFS-QFD + DEA. Technical featur es for gr een pr oduct design DR1 DR2 DR3 DR4 DR5 DR6 DR7 DR8 DR9 uv u v uv uv u v uv uv u v uv Technical grading of impor tance (IFSs) 4.2436 0.0001 3.2082 0.0003 2.1609 0.003 4 2.8488 0.0006 2.414 7 0.0030 1.9225 0.008 0 2.8253 0.0009 1.473 4 0.0225 2.4008 0.001 0 Cost index 0.6928 0.1710 0.8581 0.0855 0.7750 0.146 2 0.5000 0.4000 0.559 3 0.3420 0.4915 0.241 0 0.5593 0.3420 0.619 3 0.2000 0.6193 0.200 0 Ex ecution d ifficulty 0.3969 0.4820 0.5000 0.4000 0.6928 0.171 0 0.5593 0.3420 0.775 0 0.1462 0.6193 0.200 0 0.3969 0.4820 0.692 8 0.1710 0.3969 0.482 0 Technical grading of impor tance (O) 0.99998 0.99991 0.99845 0.99979 0.998 78 0.99586 0.99968 0.984 97 0.99956 Cost index (I) 0.8020 0.9094 0.8413 0.5556 0.620 6 0.6710 0.6206 0.755 9 0.7559 Ex ecution d ifficulty (I) 0.4515 0.5556 0.8020 0.6206 0.841 3 0.7559 0.4515 0.802 0 0.4515 Corr esponding efficiency value 1.0000 0.8128 0.6899 1.0000 0.894 3 0.8247 1.0000 0.735 2 0.9997 Ran king of enterprise resour ce distribution efficiency 1 79 1 56 1 84 IFS s: intu ition istic fuzzy set s. The ma in objecti ve is to con sider the cost and corr espon ding efficiency va lue to obtain the final so rt of design re quir eme nts (show in bold ).
Table 13. Comparison list of the computation and ranking
results of IFSs-QFD and IFSs-QFD+DEA.
Technical features for green product design
IFSs-QFD IFSs-QFD
+DEA
DR1: To simplify the product and reduce waste material
1 1
DR2: Easy-to-disassemble spare part design
2 7
DR3: To use recyclable material
7 9
DR4: To reduce unnecessary paint coating
3 1
DR5: To use the packing material which can lower the environmental cost
6 5
DR6: Sortable degree of product spare parts
8 6
DR7: Recycling equipment of the waste
4 1
DR8: Normal temperature recycling technology for plastic spare parts
9 8
DR9: Waste water treatment technology
5 4
It can be seen from the above empirical analysis results that the IFS proposed by this study combines the innovative mathematical modes of IPA, QFD, as well as DEA to explore the green product innovation. Not only can it help enterprises more effectively control the required items of green innovation at an advantage, but it can transfer the voices of customers into technical requirements, in order to meet the expectations of the consumers toward the green product innovation. At the same time, it can also more systematically provide enterprises with references of advantages and strength of the necessary resources for the product of green innovation technical features in the face of effective internal resources.
Conclusion
As the environmental protection awareness rises around the world, green innovation of the product as well as satisfying customers’ need has become extremely highlighted issues concerned by enterprises. Nowadays, present enterprises not only take how to enhance their competiveness and cost-effect into account but also measure their own technical limits while considering customers’ demand. However, mostly owing to the limit on the design stage of the green product, a lot of uncer-tainties and semantic ambiguity exist in the process of information collecting. Thus, decision makers always face non-quantification and uncertain data, so that they can hardly receive objective selection outcomes.
Therefore, this study constructs the evaluation mode of intuitionistic fuzzy green innovative design with the intuitionistic fuzzy semantic concepts—‘‘agree,’’ ‘‘dis-agree,’’ and ‘‘uncertainty’’—developing into intuitionis-tic fussy set-importance performance analysis (IFS-IPA), which converts performance ratings into intuitio-nistic semantic values, so that not only can the better performance be made when dealing with uncertain information and solving the problem of multiple attri-bute decision-making, but all of the customers’ demand as well as technical requirement rating values can be obtained more objectively. In addition, integrating ANP, QFD, and DEA methods can more accurately convert customers’ voices into technical requirement; meanwhile, considering that enterprises are facing lim-ited resources, we can offer the references for the rela-tive weight and prioritization of the resources required by the products’ green innovative technical features.
In the experimental stage, this study takes the prod-uct design of the green fuel battery modularization manufacturing process as an example explaining the application of this evaluation mode. In terms of prod-uct design innovation characteristics of the green fuel battery, ‘‘to simplify the product and reduce waste material,’’ ‘‘easy-to-disassemble spare part design,’’ and
‘‘to reduce unnecessary paint coating’’ are three impor-tant design technical features. To sum up, the proposed green innovation design evaluation mode can effec-tively consider enterprises’ own resource allocation, find out critical technical requirements to meet custom-ers’ ultimate demand, strengthen enterprises’ entire competiveness, and offer enterprises references for the green product design.
Declaration of conflicting interests
The author(s) declared no potential conflicts of interest with respect to the research, authorship, and/or publication of this article.
Funding
The author(s) disclosed receipt of the following financial sup-port for the research, authorship, and/or publication of this article: The authors would like to thank the Ministry of Science and Technology of the Republic of China (MOST 104-2410-H-167-004 and MOST 103-2410-H-167-002) for financially supporting this research.
References
1. Kammerer D. The effects of customer benefit and regula-tion on environmental product innovaregula-tion. Empirical evi-dence from appliance manufacturers in Germany. Ecol Econ2009; 68: 2285–2295.
2. Qi GY, Shen LY, Zeng SX, et al. The drivers for con-tractors’ green innovation: an industry perspective. J Clean Prod2010; 18: 1358–1365.
3. Pujari D. Eco-innovation and new product development: understanding the influences on market performance.
Technovation2006; 26: 76–85.
4. Gouda SK, Jonnalagedda S and Saranga H. Design for the environment: impact of regulatory policies on prod-uct development.Eur J Oper Res2016; 248: 558–570. 5. Coskun S, Ozgur L, Polat O, et al. A model proposal for
green supply chain network design based on consumer segmentation.J Clean Prod2016; 110: 149–157.
6. Elkington J.The green designer. London: Design Council of Great Britain, 1986.
7. Nehrt C. Maintainability of first mover advantages when environmental regulations differ between countries.Acad Manage Rev1998; 23: 77–97.
8. Tseng ML. Importance–performance analysis of munici-pal solid waste management in uncertainty. Environ Monit Assess2011; 172: 171–187.
9. Tseng ML, Lan LW, Wang R, et al. Using hybrid method to evaluate the green performance in uncertainty.
Environ Monit Assess2011; 175: 367–385.
12. Gale B. Managing customer value: creating quality and service that customers can see. New York: Free Press, 1994.
13. Garver MS. Best practices in identifying customer-driven improvement opportunities.Ind Market Manag2003; 33: 455–466.
14. Deng WJ, Chen WC and Pei W. Back-propagation neural network based importance–performance analysis for determining critical service attributes. Expert Syst Appl
2008; 34: 1115–1125.
15. Lee YC, Yen TM and Tsai CH. Modify IPA for quality improvement: Taguchi’s signal-to-noise ratio approach.
TQM J2008; 20: 488–501.
16. Pan FC. Practical application of importance-performance analysis in determining critical job satisfaction factors of a tourist hotel.Tourism Manage2015; 46: 84–91.
17. Jia GZ and Bai M. An approach for manufacturing strat-egy development based on fuzzy-QFD.Comput Ind Eng
2011; 64: 445–454.
18. Wu Q. Fuzzy measurable house of quality and quality function deployment for fuzzy regression estimation problem.Expert Syst Appl2011; 38: 14398–14406. 19. Liu HT and Tsai YL. A fuzzy risk assessment approach
for occupational hazards in the construction industry.
Safety Sci2012; 50: 1067–1078.
20. Lam JSL. Designing a sustainable maritime supply chain: a hybrid QFD–ANP approach. Transport Res E: Log
2015; 78: 70–81.
21. Lam JSL and Lai KH. Developing environmental sus-tainability by ANP-QFD approach: the case of shipping operations.J Clean Prod2015; 105: 275–284.
22. Lin CY, Lee AHI and Kang HY. An integrated new product development framework—an application on green and low-carbon products.Int J Syst Sci2015; 46: 733–753.
23. Farrell MJ. The measurement of productive efficiency.J R Stat Soc1957; 120: 253–290.
24. Charnes A, Cooper WW and Rhodes E. Measuring the efficiency of decision making units.Eur J Oper Res1978; 2: 429–444.
25. Banker RD, Charnes A and Cooper WW. Some modes for estimating technical and scale inefficiencies in data envelopment analysis.Manage Sci1984; 30: 1078–1092. 26. Charnes A and Cooper WW. The non-Archimedean
CCR ratio for efficiency analysis: a rejoinder Boyd and Fare.Eur J Oper Res1984; 15: 333–334.
27. Dobos I and Vo¨ro¨smarty G. Green supplier selection and evaluation using DEA-type composite indicators. Int J Prod Econ2014; 157: 273–278.
28. Song M, Tao J and Wang SH. FDI, technology spillovers and green innovation in China: analysis based on data envelopment analysis.Ann Oper Res2015; 228: 47–64. 29. Zadeh LA. Fuzzy sets.Inform Control1965; 8: 338–353. 30. Hun SL, Yue D, Peng C, et al. Event-triggered controller
design of nonlinear discrete-time networked control sys-tems in T-S fuzzy model. Appl Soft Comput 2015; 30: 400–411.
31. Li HY, Sun XJ, Shi P, et al. Control design of interval type-2 fuzzy systems with actuator fault: sampled-data control approach.Inform Sciences2015; 302: 1–13.
32. Wai RJ, Ze Y, Chen MW, et al. Design of adaptive con-trol and fuzzy neural network concon-trol for single-stage boost inverter.IEEE T Ind Electron2015; 62: 5434–5445. 33. Atanassov KT. Intuitionistic fuzzy sets. Fuzzy Set Syst
1986; 20: 87–96.
34. Liang D and Liu D. Deriving three-way decisions from intuitionistic fuzzy decision-theoretic rough sets. Inform Sciences2015; 300: 28–48.
35. Liao H, Xu Z, Zeng XJ, et al. An enhanced consensus reaching process in group decision making with intuitio-nistic fuzzy preference relations. Inform Sciences 2016; 329: 274–286.
36. Ouyang Y and Pedrycz W. A new model for intuitionistic fuzzy multi-attributes decision making. Eur J Oper Res
2016; 249: 677–682.
37. Bar ES. A case study of obstacles and enablers for green innovation within the fish processing equipment industry.
J Clean Prod2015; 90: 234–243.
38. Gau WL and Buehrer DJ. Vague sets.IEEE T Syst Man Cyb1993; 23: 610–614.
39. Wan SP and Li DF. Atanassov’s intuitionistic fuzzy pro-gramming method for heterogeneous multiattribute group decision making with Atanassov’s intuitionistic fuzzy truth degrees. IEEE T Fuzzy Syst 2014; 22: 749–761.
40. Xu Z and Liao H. Intuitionistic fuzzy analytic hierarchy process.IEEE T Fuzzy Syst2014; 22: 749–761.
41. Das S, Dutta B and Guha D. Weight computation of cri-teria in a decision-making problem by knowledge mea-sure with intuitionistic fuzzy set and interval-valued intuitionistic fuzzy set.Soft Comput. Epub ahead of print 5 August 2015. DOI: 10.1007/s00500-015-1813-3. 42. Martilla JA and James JC. Importance-performance
analysis.J Marketing1977; 41: 77–79.
43. Sethna BN. Extensions and testing of importance-performance analysis.Bus Econ1982; 20: 28–31.
44. Cunningham MA and Gaeth GJ. Using importance-performance analysis to assess patients’ decisions to seek care in a dental school.J Dent Educ1989; 53: 584–586. 45. Dolinsky AL. Considering the competition in strategy
development: an extension of importance-performance analysis.J Health Care Market1991; 11: 31–36.
46. Wu HH, Shieh JI and Pan WR. Applying importance-performance analysis to analyze service quality: a case of two coach companies. J Inform Optim Sci 2008; 29: 1203–1214.
47. Shieh JI and Wu HH. Applying importance-performance analysis to compare the changes of a convenient store.
Qual Quant2009; 43: 391–400.
48. Coghlan A. Facilitating reef tourism management through an innovative importance-performance analysis method.Tourism Manage2012; 33: 767–775.
49. Saaty TL.Decision making with dependence and feedback: the analytic network process. Pittsburgh, PA: RWS, 1996. 50. Chung SH, Lee HI and Pearn WL. Analytical network
process (ANP) approach for product mix planning in semiconductor fabricator. Int J Prod Econ 2005; 96: 15–36.
52. Bu¨yu¨ko¨zkan G, Feyziog˘lu OK and Ruan D. Fuzzy group decision-making to multiple preference formats in quality function deployment.Comput Ind2007; 58: 392–406. 53. Seiford LM. Data envelopment analysis: the evolution of
the state of the art (1978–1995). J Prod Anal 1996; 7: 99–137.
54. Kao C and Liu ST. Data envelopment analysis with miss-ing data an application to university libraries in Taiwan.
J Oper Res Soc2000; 51: 897–905.
55. Zhang SF and Liu SY. A GRA-based intuitionistic fuzzy multi-criteria group decision making method for person-nel selection.Expert Syst Appl2011; 38: 11401–11405.
56. Abdullan ML, Jaafar SZ and Taib I. A new analytic hier-archy process in multi-attribute group decision making.
Int J Soft Comput2009; 4: 208–214.
57. Klir GJ and Yuan B. Fuzzy sets and fuzzy logic-theory and applications. Upper Saddle River, NJ: Prentice Hall, 1995.
58. Hung KC, Yang GK, Chu P, et al. An enhanced method and its application for fuzzy multi-criteria decision mak-ing based on vague sets.Comput Aided Design2008; 40: 447–454.