* Corresponding author. Tel: +989124864291. E-mail addresses: [email protected] (M. Hamidi Hedayat) © 2012 Growing Science Ltd. All rights reserved. doi: 10.5267/j.msl.2011.10.007
Contents lists available atGrowingScience
Management Science Letters
homepage: www.GrowingScience.com/mslA two level DEA in project based organizations
Mehrdad Hamidi Hedayata*and Morteza Bagherpourb
a
Department of Industrial Engineering, Qazvin Branch, Islamic Azad University, Qazvin, Iran b
Department of Industrial Engineering, Iran University of Science & Technology, Tehran, Iran
A R T I C L E I N F O A B S T R A C T
Article history: Received July 20, 2011 Accepted 7 October 2011 Available online 10 October 2011
This paper presents a systematic approach for evaluating the performance of a project based organization using a two-level fuzzy data envelopment analysis (DEA) technique in project based organizations. In order to determine the required inputs and outputs, important indicators are selected using both expert judgments and statistical analysis and a two-level DEA model is adapted. In this model, by considering different inputs and outputs through a hierarchical process, a large number of sub indicators are provided and rolled up to a higher level. Since inputs and outputs are combinations of qualitative and quantitative indicators, fuzzy logic is also included through the modeling procedure. In addition, since the exact amount cannot be attributed to the indicators, the proposed model uses interval values for the project life cycle. Finally, some of the projects are evaluated throughout the approach proposed in this paper.
© 2012 Growing Science Ltd. All rights reserved. Keywords:
Two level DEA Fuzzy
Project based organization Performance evaluation
1. Introduction
Various aspects of project performance can be evaluated altogether. Project managers, have a normal range of key performance indicators for project evaluation. Prior project management research has identified a wide variety of measures, which describe the outcomes of a project and the input characteristics that impact outcomes (Ling et al. 2009; Prabhakar, 2008; Thomas & Fernandez, 2008). Time, costs and technical performance are important factors in project performance evaluation. However, using these factors individually does not mean the project is implemented as planned.
of quantitative and qualitative indicators to assess accurately the performance of the project and it seems to be essential requirements for a project based organization. In this paper, by using a two-level DEA technique, we present an approach for evaluating the performance of different projects and characterize the inputs and the outputs of the fuzzy model based on interval DEA technique.
2. Literature review
2.1. Project performance evaluation
A project is unique and limited activities over time with unique scope. Different project definitions might warrant different success criteria (Lauras et al., 2010). A project manager defines a range of key performanceindicators,for a project. Critical success factors can be described as characteristics, conditions, or variables, which could have significant impact on the success of the project when properly sustained, maintained or managed (Milosevic & Patanakul, 2005). Research shows the triangle of time, cost and performance cannot be considered as optimal option (Atkinson, 1999). Applying these criteria alone does not make the project go as it is planned. Using a risk assessment report helps complete a project performance management system. This report provides the information needed to start any actions for the correction of potential problems (Lauras et al., 2010). Other research shows that project management activities using only time, cost or quality measures may fall through the gaps (Dweiri & Kablan, 2005). Therefore, the areas covering the project management should be more extensive and complete. Nine areas are presented in the project management body of knowledge, which could interpret various aspects of project management. Also, many performance measurement tools will focus on the financial aspects of projects, including return on investment and profit per unit, but measuring these items are not always an east task(Cheung et al., 2004). When the project manager use more indicators for measuring project performance, one of the main problems is comparison and aggregation of the performance expressions. However, providing a comprehensive approach, which would consider different aspects of the project and measuring and integrating quantitative and qualitative indicators, which evaluate accurately the performance of the project, seems to be necessary. DEA has the capability of such techniques that can apply the criteria with different units and by defining appropriate outputs calculating the performance of each project. If the inputs and outputs in this method are hierarchically, the two-level DEA model can be used. Since the output selectedin this study arehierarchically usingsuch a model would be useful. In the next part, we will discuss the project performance assessment literature.
2.2 Data envelopment analysis (DEA)
DEA is a nonparametric method for measuring and evaluating the relative performance of units set to decide on the basis of input and output indicators. The classical DEA model assumes that all inputs and outputs are determined and we do not have any inaccurate data. However, because of the uncertainty condition, the DEA sometimes faces with no precise data. This especially happens when theDMUhaslostormissingdata, judgmentaldata, dataqualityor datacan bepredicted. Non-secure data or inaccurate data can be expressed as fuzzy numbers or intervals. Most of the times there is a need to investigate and fuzzy and interval models are really needed.
2.2.1. Fuzzy DEA
M. Hamidi Hedayat and M. Bagherpour/ Management Science Letters 2 (2012)
13
set approach was also used and defined the fuzzy CCR model in planning and turned it to programmable intervals by using different levels of α. This was expanded by Saati et al. (2002) in which all decision maker units can be evaluated by using the weight of the public following an α level. Soleimani et al. (2006) cleared some bugs of the fuzzy DEA and computer theory, and presented a fuzzy DEA model to obtain the final performance of the fuzzy input and output units. Also Soleimani et al. (2006) developed a measurement on some DEA models for the fuzzy concept. The non-linear DEA model had two objectives for the decision maker units with fuzzy input and output data.
2.2.2. Interval analysis of DEA
In this situation, the inputs and outputs are in a range. Depotis and Smirlis (2002) used constant return to scale (CRS) DEA model for the interval data. In this way the optimistic and pessimistic cases are examined and the results of the efficiency are described as θ ,θ . The decision maker usually has
three classes that are categorized as follows:
, … , │ , (1)
, … , │ , (2)
, … , │ . (3)
When there are many outputs and inputs in the system, more than one DMU is classified as strong efficiency, and thus we need some additional ranking techniques.
3. Determining a model for data envelopment analysis
3.1. Research methodology
The proposed DEA model of this paper uses various input/output indicators gathered from the literature. To determine the most important indicators and related topics, experts' judgments were used and with the help of analytical methods, the most important indicators are detected. We have also used correlation tests to see whether there is any dependency among indicators. Therefore, if there is inverse relationship between two indicators, according toVitner et al. (2006) one of them can be eliminated. Two-level model of DEA with regard to hierarchical inputs and outputs has the ability to aggregate sub indicators to higher levels into a more generalize form. Therefore, the use of this method could lead to consider more agents in the performance evaluation project and with regard to hierarchical output and aggregating into higher levels theperformance levelof each project will be determined. Since the input and output indicators are combinations of qualitative and quantitative indicators, we first solve the model with definitive data, and then by transforming the qualitative into fuzzy numbers, the fuzzy model will be determined. In order to classify the research, a generalize form is shown in Fig. 1.
3.2. Determining the inputs and outputs
Several factorsin evaluating thesuccessandperformance ofthe project areconsidered. Inone of the models, the key factors in theperformance weredivided into twoprimary and secondary categories.
performed (i.e. in terms of people - time) in the projects as important inputs (Cao & Hoffman, 2010; Vitner et al., 2006). The technical complexity as a factor input is taken into consideration (Cao & Hoffman, 2010; Vitner et al., 2006). The amount of financial resources allocated to the project inputs necessary to achieve to outputs (Vitner et al., 2006). In some studies of human resource experts, is mentionedasan importantinput(Cao & Hoffman, 2010).
Human resources education and familiarity with theconcepts of project management, experience in theprojectareimportant factors.
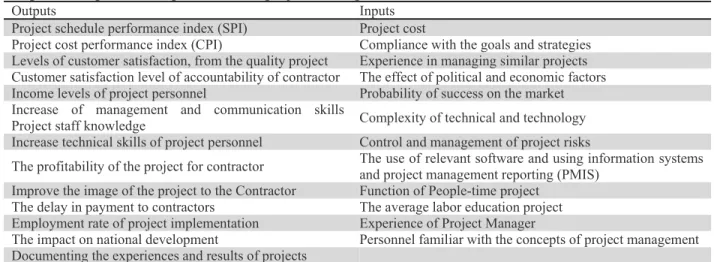
Table 1
Important input and output factors in project management
Inputs Outputs
Project cost Project schedule performance index (SPI)
Compliance with the goals and strategies Project cost performance index (CPI)
Experience in managing similar projects Levels of customer satisfaction, from the quality project
The effect of political and economic factors Customer satisfaction level of accountability of contractor
Probability of success on the market Income levels of project personnel
Complexity of technical and technology Increase of management and communication skills
Project staff knowledge
Control and management of project risks Increase technical skills of project personnel
The use of relevant software and using information systems and project management reporting (PMIS)
The profitability of the project for contractor
Function of People-time project Improve the image of the project to the Contractor
The average labor education project The delay in payment to contractors
Experience of Project Manager Employment rate of project implementation
Personnel familiar with the concepts of project management The impact on national development
Documenting the experiences and results of projects
Determining inputs and outputs
Select important inputs & outputs by using expert judgment and statistical analysis
Grouping the selected inputs and outputs
Using a two-level DEA model
Fuzzy DEA model development
Interval DEA model development & determine best projects Eliminating the inputs/outputs with high correlation
M. Hamidi Hedayat and M. Bagherpour/ Management Science Letters 2 (2012)
15
Communication betweendifferent parts of theproject through the planning and delivery ofaccurate and timely reports to project stakeholders and the general use of project management information system as an important factor in achieving the project objectives are also important factors. The literaturereviewconductedinrelation toprojectinputsandoutputs, and critical success factors, were the following factors most frequently in the papers, important factors in evaluating the performance of projects were selected (Table 1).
It is obvious that, most indicatorson the performanceimpact of the project were notidentical, and some of the most important indicators in evaluating performance are considered more important. Other than that, because of the large number of indicators, the use of all of them in this technique requires the application of numerousprojectsas aDMU. Otherwise, TheDEAdeclined torecognize the powerful and efficient project. For this reason, with the use of experts the best indicators are chosen. Then principle component analysis (PCA) is applied using data obtained from the experts and well-known indicators.
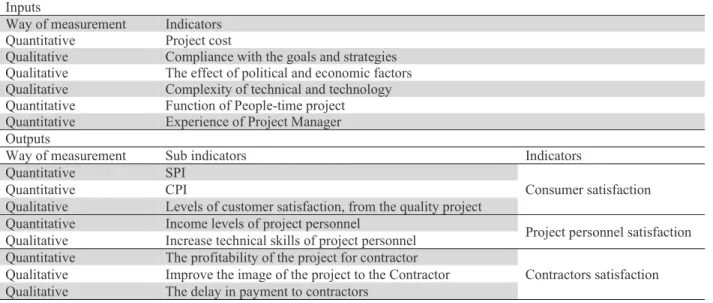
Table 2 shows the results. By examining the selected outputs, we can conclude that the outputs show the amount of customer, project personnel and contractors satisfaction. In other words, the first three outputs, “SPI”, “CPI” and “consumer satisfaction of the project quality” are indicators that will measure customer satisfaction. The next two indicators, “project personal income " and " technical skills of project personnel," measure the project staff satisfaction. The next three indicators, “The profitability of the project for contractor”, “Improve the image of the project to the contractor” and “the delay in payment to contractors” assesses the contractor satisfaction. Thus, output indicators can be grouped hierarchically, and be showed (Table 2).
3.3. Using a two-level DEA model
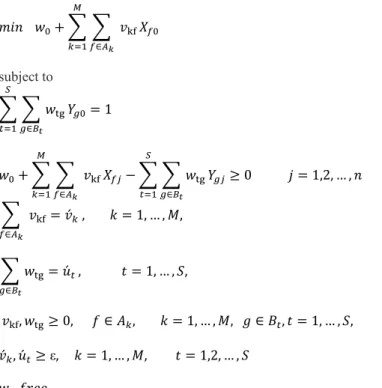
One way to determinethetechnicalefficiency is to use DEA. Inthatcase,thehierarchical structureof input and output indicatorsareprovided, it is the two-level DEA model (Kao, 2008). The main idea of two level DEA proportional to the classical DEA is the aggregation of input and output factors using a weighted average of the groups (Meng et al., 2008). Thereby, several inputs and outputs belong to a group, and such groups as high-level inputs and outputs are used in the model. In this paper,theDEAtwo-level linear model is used as follows (Kao, 2008).
Table 2
Selected inputs and out puts and their groups
Inputs
Indicators Way of measurement
Project cost Quantitative
Compliance with the goals and strategies Qualitative
The effect of political and economic factors Qualitative
Complexity of technical and technology Qualitative
Function of People-time project Quantitative
Experience of Project Manager Quantitative
Outputs
Indicators Sub indicators
Way of measurement
Consumer satisfaction SPI
Quantitative
CPI Quantitative
Levels of customer satisfaction, from the quality project Qualitative
Project personnel satisfaction Income levels of project personnel
Quantitative
Increase technical skills of project personnel Qualitative
Contractors satisfaction The profitability of the project for contractor
Quantitative
Improve the image of the project to the Contractor Qualitative
subject to
, , … ,
́ , , … , , (4)
́ , , … , ,
, , , , … , , , , … , ,
́ , ́ ε, , … , , , , … ,
This model is exactly like the one-level DEA model, except thattwo setsweightlimits∑ v v́ , ∑ w ú are added and v and w aretheinputand outputcoefficients. In other words, we haveamodelwith weightrestrictions. The only differences is that w and v are bigger or equal to zero (Kao, 2008).
3.4. Fuzzy DEA model development
In this research, some qualitative judgments as inputs and outputs are not the exact amount to be determined, therefore, the use of linguistic variables is more appropriate to express. With the appropriate allocation of fuzzy numbers, these variables can be equivalent to a fuzzy number. Therefore, qualitative indicators in Table 2 with linguistic variables as "very high", "high", "medium", "low", "very low", are equivalent with appropriate fuzzy numbers. Since the triangular fuzzy numbers, is used more, so in this study, triangular fuzzy numbers in use as well:
The use of different α levels causes the upper and lower confidence limits of a fuzzy gain.In many ways of programming where possible, linear α-cut method is used. The answer is achieved by comparing the left and right limits. In this research, α-cut are used for the amount of inputs and outputs. By the use of α-cut and its act on fuzzy numbers, the fuzzy issue and based on the performance of each project is obtained in various conditions.
1
very low
low medium high very high
4 6 8
M. Hamidi Hedayat and M. Bagherpour/ Management Science Letters 2 (2012)
17
3.5.Interval DEA model development
All together non-exact data or inaccurate data can be expressed as fuzzy numbers or intervals. Most of the time there is a need to investigate and interval or fuzzy models are very necessary. Especially, the best decision maker unit MPS1is also one of the main problems in this area.In this part, the use of an appropriate techniquefor evaluating and obtaining the most preferred solution as intervals, is presented, which is simple and useful. In this technique, all inputs and outputs are considered as interval.
Interval DEA model originally proposed by Depotis and Smirlis (2002) calculates all DMU performance, and DMU is put to its class. In most cases, when DMUs is less than three times the number of inputs and output, most DMUs are classified in E++ and we will not have a full rank of DMUs, so we cannot obtain MPS. Most of the time, we need to determine the MPS. To solve this problem we use an ideal and virtual DMU. This DMU will be built based on these inputs and outputs of class E + + projects.
Lower bound inputs of this virtual DMU are made by the minimum lower bound inputs and the higher bound inputs are made by the minimum higher bound inputs of this class. Therefore, lower bound of outputs of this virtual DMU are made based on minimu lower bound of outputs andupper bound of outputs of this virtual DMU are made based on the maximum of higher bound of outputs of this class. Thus only by the virtual DMU and DMUs in class E + +, the Depotis model will be run and efficiency of this DMUs will be obtained. As a result, we have a full rankingand we can calculate the MPS.
4. The discussion on implementation and results
For this propose of the project completed, 17 projects in an organization was selected. Note that all projects have been implemented by the EPC. This makesit possibleto compare the performanceof them together. In this section, based on the selected input and output data were collected for the project. The model presented in the previous section, inversely related indicators between the input/outputprovided were used.
According to Vitner et al. (2006) we examined the correlation amongeach pair of input/output and they all were less than 0.8. According to this method, no indicator was removed and all the selected indicatorswere usedintheperformanceof projects. By using model 4, values of the performance of each project were obtained.
Table 3
The results of the efficiencies of different projects
Projects 1 2 3 4 5 6 7 8 9 10 11 12 13 14 15 16 17
Efficiency 1 0.85 0.60 0.64 0.78 0.56 0.70 0.44 0.31 0.49 0.26 0.16 0.30 0.28 0.67 1.00 0.66
According to the results, only projects 1 and 16 were efficient. The efficiencies of the projects are properly distributed in the range of zero to one. Therefore, this feature is good in the performance of projects.
4.1. Solving thefuzzymodel
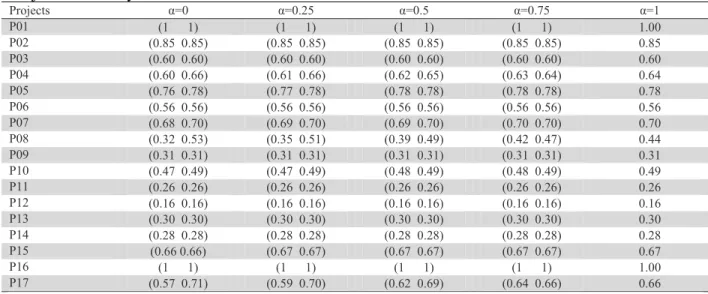
As it was due to the qualitative variables as inputs and outputs in the DEA, these variables can be expressed with appropriate fuzzy numbers. For this purpose, different α-cut forms wereused and for each α-cut lowand high level of performance were determined and the results are given in Table 4.
1
Projects efficiency with different α-cut α=1 α=0.75 α=0.5 α=0.25 α=0 Projects 1.00 (1 1)
(1 1) (1 1)
(1 1) P01
0.85 (0.85 0.85)
(0.85 0.85) (0.85 0.85)
(0.85 0.85) P02
0.60 (0.60 0.60)
(0.60 0.60) (0.60 0.60)
(0.60 0.60) P03
0.64 (0.63 0.64)
(0.62 0.65) (0.61 0.66)
(0.60 0.66) P04
0.78 (0.78 0.78)
(0.78 0.78) (0.77 0.78)
(0.76 0.78) P05
0.56 (0.56 0.56)
(0.56 0.56) (0.56 0.56)
(0.56 0.56) P06
0.70 (0.70 0.70)
(0.69 0.70) (0.69 0.70)
(0.68 0.70) P07
0.44 (0.42 0.47)
(0.39 0.49) (0.35 0.51)
(0.32 0.53) P08
0.31 (0.31 0.31)
(0.31 0.31) (0.31 0.31)
(0.31 0.31) P09
0.49 (0.48 0.49)
(0.48 0.49) (0.47 0.49)
(0.47 0.49) P10
0.26 (0.26 0.26)
(0.26 0.26) (0.26 0.26)
(0.26 0.26) P11
0.16 (0.16 0.16)
(0.16 0.16) (0.16 0.16)
(0.16 0.16) P12
0.30 (0.30 0.30)
(0.30 0.30) (0.30 0.30)
(0.30 0.30) P13
0.28 (0.28 0.28)
(0.28 0.28) (0.28 0.28)
(0.28 0.28) P14
0.67 (0.67 0.67)
(0.67 0.67) (0.67 0.67)
(0.66 0.66) P15
1.00 (1 1)
(1 1) (1 1)
(1 1) P16
0.66 (0.64 0.66)
(0.62 0.69) (0.59 0.70)
(0.57 0.71) P17
Therefore, the following performancegraphs are plotted for different projectsper α-cut. Fig. 3 and Fig. 4show theperformance ofhighandlow, respectively.
Fig. 3. projects efficiency with different α-cut (low) Fig. 4. projects efficiency with different α-cut (high)
4.2. solving an interval model and determining the best performance of the project
Here, all the inputs and outputs, both quantitative and qualitative inputs to the interval are considered. Table 5 shows the results of the implementation of the interval DEA method for the case study of this paper.
Table 5
Efficiency and ranking of projects
Projects Efficiency
hj
L,
hj
u ranking Projects
Efficiency
hj
L,
hj
u ranking Projects
Efficiency
hj
L,
hj
u ranking
P01 [1,1] 1 P07 [0.70,0.98] - P13 [0.29,0.44] -
P02 [0.85,1] 2 P08 [0.32,1] 6 P14 [0.26,0.41] -
P03 [0.58,0.77] - P09 [0.29,0.46] - P15 [0.66,0.1] 4
P04 [0.66,0.82] - P10 [0.49,0.71] - P16 [1,1] 1
P05 [0.76,1] 3 P11 [0.26,0.38] - P17 [0.56,1] 5
P06 [0.57,0.78] - P12 [0.16,0.22] -
M. Hamidi Hedayat and M. Bagherpour/ Management Science Letters 2 (2012)
19
Table 6
Classification of projects
Class E++ E+ E
Projects P16,P1 P2,P5,P8,P15,P17 P3,P4,P6,P7,P9,P10,P11,P12,P13,P14
As we can see the projects 1 and 16 are in the strong efficient class (E++). According to the proposed solution, an ideal virtual project is added to the strong efficient class and run the model with strong efficient class projects and the ideal virtual project. Therefore, new inputs and outputs are defined for virtual project. The virtual project is as shown by PD and the ranking of a new efficient power class is
as shown in Table 7.
Table 7
Acompleteranking ofefficientprojects
The projects 1 and 16 are strong and efficient projects, other words, both of these projects are on the efficiency border.
5. Results and conclusion
This paper presented a systematic method for evaluating the performance of a project using a two-level DEA model. In this model by considering the inputs and outputs hierarchically, a large number of sub indicators provided and then rolled up to the higher level. Therefore, applying this method could result in considering more indicators in the performance evaluation of the project.
The input and the output indicators are combinations of qualitative and quantitative indicators. By solving the model with actual data, with a quality index for the fuzzy numbers, fuzzy model problem was studied. The next method, we assumed all inputs and outputs are inaccurate. This makes it possible for indicators change becauseof changes in project scopeduring the project. On the other hand, some of the indicators are qualitative. For solving this problem, we used data from a range of performance that we get an interval. In DEA model, when DMUs is less than three times the number of inputs and output, the use of ranking technique is required to determine the most preferred solution. In this paper a virtual DMU was used which was fully capable of ranking the units. This method helps quantify the project performance evaluation, therefore in comparison with qualitative performance evaluation methods are reliable self-assessment results. This structure provides simple and practical approach and their results can apply to be simplified for management that may not be advanced computer programming skills. So project based organization can apply this method for evaluating their projects and create a competitive atmosphere among the projects. For future research in addition to outputs, the inputs can be considered hierarchical.
Acknowledgment
The authors would like to thank the anonymous referee for constructive comments on earlier version of this paper.
References
Atkinson, R. (1999). Project management: cost, time and quality, two best guesses and a phenomenon, its time to accept other success criteria. International Journal of Project Management, 17(6), 337–342.
Projects Efficiency hj
L ,hj
u
Ranking
PD [1,1] 1
P1 [1,1] 2
evaluation system. International Journal of Project Management, 29, 155-164.
Cheung, S.O., Suen Henry, C.H., & Cheung, K.W. (2004). PPMS: a web based construction project performance monitoring system. Automation in construction, 13, 361–376.
Depotis, D.K., & Smirlis, Y.G. (2002). Data envelopment analysis with imprecise data. European Journal of Operational Research, 140, 24–36.
Dweiri, F.T., & Kablan, M.M. (2005). Using fuzzy decision-making for the evaluation of the project management internal efficiency. Decision Support System, 42(2), 712–726.
Kao, C. (2008). A linear formulation of the two-level DEA model. Omega, 36, 958–962.
Kao, C., & Liu, S.T. (2003). A mathematical programming approach to fuzzy efficiency ranking.
International Journal of Production Economics, 86, 45-54.
Kao, C., & Liu, S.T. (2005). Data envelopment analysis with imprecise data: An application of Tiwan machinery firms, International Journal of Uncertainty Fuzziness and Knowledge-Based Systems, 13 (2) 440-445.
Kao, C., & Liu, S.T. (2006b). Data envelopment analysis with missing data: A application to University libraries in Tiwan, Journal of Operation Research Society, 51, 897-905.
Lauras, M., Marques, G., & Gourc, D. (2010). Towards a multi-dimensional project Performance Measurement System, Decision Support Systems, 48, 342–353.
Lertworasirikul, S., Fang, S.C., Jeffrey A.J., & Henry L.W. (2003b). Fuzzy data envelopment analysis: A credibility approach. Fuzzy set based heuristics for optimization, 145, 141-158.
Ling, F., Low, S., Wang, S., & Lim, H. (2009). Key project management practices affecting Singaporean firms’ project performance in China. International Journal of Project Management, 27(1), 59–71.
Meng, W., Zhanga, D., Qib, L., & Liu, W. (2008). Two-level DEA approaches in research evaluation.
Omega, 36, 950 – 957.
Might, R.J., & Fischer, W.A. (1985). The role of structural factors in determining project management success. IEEE Trans. Engineering Management, 32 (2), 71–77.
Milosevic, D., & Patanakul, P. (2005). Standardized project management may increase development project success. International Journal of Project Management, 23, 181–192.
Prabhakar, G.P. (2008). What is project success: a literature review. International Journal of Business Management, 3 (9), 3–10.
Saati, S., Memariani, A., & Jahanshahloo, G.R. (2002). Efficiencies analysis and ranking of DMUs with fuzzy data. Fuzzy Optimization and Decision Making, 1, 255-267.
Senqupta, S., & Tunbull, J. (1996). Seamless optimization, IIE Sol, 19, 369-373.
Shenhar, A.J., Dvir, D., Levy, O., & Maltz, A.C. (2001). Project success: A multidimensional strategic concept. Long Range Planning, 34(4), 699–725.
Soleimani-damanch, M., Jahanshahloo, G.R., & Abbasbandy, S. (2006). Computational and theoretical pitfalls in some current performance measurement techniques and a new approach.
Applied Mathematics and Computation, 181(2), 1199-1207.
Thomas, G., & Fernandez, W. (2008). Success in IT projects: A matter of definition?. International Journal of Project Management, 26(7), 733–742.