Gallo Worldwide:
Sustainability of competitive position in Brazil
Gonçalo Santos Pitta #1497
A project carried out on the Strategy course, under the supervision of Professor Luís Almeida Costa
Abstract: This project presents a case study of the competitive situation of Gallo
Worldwide in Brazil. The Brazilian market for olive oil is experiencing an exponential growth. The awareness of olive oil has been growing among consumers. Gallo Worldwide has already taken advantage of these opportunities and developed a solid competitive position in the Brazilian market. In fact, Gallo Worldwide is currently the leading player in the olive oil Brazilian market. However, the market and the structure of the industry may change and in the future affect Gallo’s competitive situation. Thus,
what should Gallo do to sustain its competitive advantage? In this work project the
value creating potential of Gallo in Brazil and the sustainability of its competitive situation will be analyzed. These issues are addressed by first presenting a case study and then a case analysis. Since the intention is to examine the real situation of a company, it is believed that a case study would be the most appropriate research method. The case study focuses not only on the attractiveness of the Brazilian market but also on the evaluation of the competitive advantage or disadvantage of Gallo. The case discussion introduces the relevant conceptual frameworks and applies them to the analysis of the case. Our analysis confirms that Gallo has a competitive advantage in Brazil. Furthermore, this advantage may be sustainable or not depending on Gallo’s
ability to deal with eventual industry structural changes, which may flip Gallo’s
resources and hence its competitive advantage.
Acknowledgements
Case Study
Gallo’s Mission Statement
“Our aim is to bring olive oil into every nation's diet plans. We want consumers to know more about the benefits of this "liquid gold" and to understand how it can be a part of every cuisine.”
The first sale of Gallo in Brazil dates back to 1908. The now Gallo Worldwide has won the prestige and respect of the Brazilian market to the present day. Several resources, namely product uniqueness, have conveyed Gallo a competitive advantage for many years. Yet, is it a sustainable one? Understanding the determinants of sustained competitive advantage has become an enormous area of investigation in strategic management1. The case study will provide a link between the market attractiveness and Gallo competitive advantage in order to build a sustained competitive position. The Porter Five Forces and the Resource-based view framework that study industry structures and uniqueness of resources are discussed. Research about privileged market positions is also studied in order to perceive competitors’ incentives in the market.
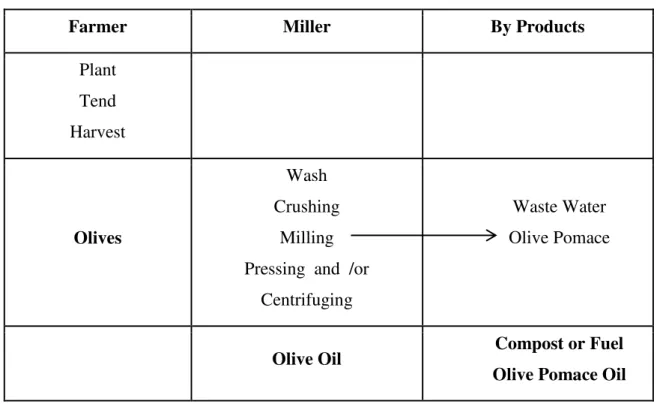
Olive Oil Industry Supply Chain
The olive oil value chain is a relatively simple process – see appendix 1. Olives are
harvested and either sold for direct consumption (table olives) or sold for use in olive oil production. First of all, olives are traditionally ground into paste by means of large millstones – milling process. Olive oils are transformed into a primary gross mass through a mechanical metal hammer. Timing in the grinding process is critical. If the paste is left for less or too long in the machine it will oxidize, so reducing the flavor. After milling, the olive paste is spread on fiber disks. The disks are stacked in a column and placed in a press. Pressure is then applied to extract a liquid from the paste. This liquid still contains a significant amount of water. Traditionally the liquid is left to
settle. This is a very slow separation process and has been replaced by the use of centrifuge. The centrifuges separate the (heavier) water from the olive oil. The oil produced as described above is called virgin oil. The remaining paste (called olive pomace) still contains between 5 and 10% of oil that can only be extracted with chemical solvents. The resulting oil is called olive pomace oil or pomace oil. The olives are sold by the grower to olive oil producers and producers of whole olive products. Olive oil is sold both as bulk and as a finished product. The case study will focus its attention, in this last step of the value chain, on the selling of olive oil by its producers. Hence, the importance of an analysis to the market and its characteristics2.
Olive Oil Market
The olive oil is one of the most important vegetable oils being commercialized due the increasing awareness of its several benefits around the world. It has antioxidant properties, preventing the cholesterol and cardiovascular accidents. Currently, 95% of the olive groves area can be found on the Mediterranean coast where 75% of the world production occurs. The olive oil is a product already inserted in the European’s culture, diet habits and plays an important role on the environment preventing desertification3. Olive groves are peculiar and mainly characterized by the reduced density plantation of olive trees per acre (< 300 trees/acre) and the low technical maintenance. Nevertheless, the necessary conditions required to grow proper olive trees and to produce quality olive oil confined the production only to certain regions, avoiding this way its world expansion. Being so, the main producers of olive oil would also be the main consumers of the product.
2 ESCWA – Enhancing information Exchange for Intra Arab – Agricultural & Food trade
Production
The main producers are the European Union, responsible for 71.9% of the worldwide production followed by Tunisia with 5.8%, Syria with 5.6%, Turkey with 5.2% and Morocco with 3.8%. Within the European community, Spain presents 51.9% of the total European production being the main producer, followed by Italy with 22.2%, Greece with 15.4%, Portugal with 2.8% and France with 0.3% - see appendix 2.4
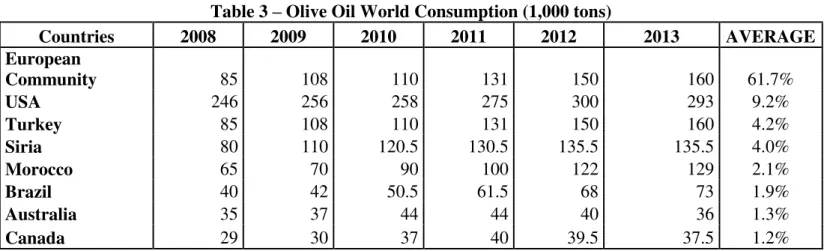
Consumption
Despite the trend regarding consumption, not all the main producers mentioned above are the main consumers. Actually, the European Union represents 61.7% of the world consumption, followed by USA with 9.2%, Turkey with 4.2%, Syria with 4.0%, Morocco with 3.3%, Brazil with 1.9%, Australia with 1.3% and Canada with 1.2% - see
appendix 3.5 The analysis of the main consumers of olive oil, when compared to the
main producers, reveals a new set of players in the market, considered to be traditional consumers/producers. The emergence of the USA, Brazil and Canada as non-traditional producers of olive oil is an example. This is the reason for, the latter countries having started to develop the conditions either to consume more or to eventually start producing.
Exports and Imports
Taking a look at the imports and exports, it is possible to similarly observe this new trend, previously mentioned, of new players/consumers in the market. Within the main exporters, the European Union leads with 65.6% (Italy detains 45.7% of exports, Spain 41.2%, Portugal 9.2% and Greece 2.7%) followed by Tunisia with 19.1%, Turkey with
4 Percentages based on an average of the past five years levels of production concerning each country (2008-2013). Data collected from the International Olive Oil Council.
3.4% and Syria with 3.1% - see appendix 4.6 The latter exporters end up to be the actual
producers of olive oil. Nevertheless, when looking at the imports it is possible to find that within the main importers there are some new consumers like, the USA with 38.6% of the total world imports of olive oil followed by Brazil with 8%, Japan with 5.5%, Canada with 5.1% and Australia with 4.4%. The European Union also comes in the picture with 16% of total imports –see appendix 5.7 However, it should be pointed out
that the European community has remained a traditional and regular importer of olive oil for decades while the above mentioned importers are now increasing their importance. The growth of these players has also been enhanced by the promotional campaigns launched by the International Olive Oil Council, which boosted the consumption of olive oil in these countries – between 6.4% and 21.5%.8 As such, being highly populated countries, they present a significant growth potential.
Olive Oil Industry in Brazil
Brazil’s brief background
In fifth place, among the highest populated countries in the world, comes Brazil with 200.4 million inhabitants within an area of 8,515,767 km2. This area is divided into 26 states. In terms of population density among cities, São Paulo is the most populated one with 20 million people, followed by Rio de Janeiro with 12 million, Belo Horizonte with 6 million, Porto Alegre and Brasília with 4 million.
Brazil’s population in general has been losing purchasing power over the last 20 years.
What in 1994 used to cost R$ 1 (0.3€), today costs R$ 4.47 (1.38€) resulting in an
6 Percentages based on an average of the past five years levels of production concerning each country (2008-2013). Data collected from the International Olive Oil Council.
7 Percentages based on an average of the past five years levels of production concerning each country (2008-2013). Data collected from the International Olive Oil Council.
accumulated inflation of 347% according to IPCA.9 In 2013 inflation was 5.91% presenting a small increase compared to the 5.84% inflation in 2012. The overall inflation in Brazil has been following an irregular path, increasing and decreasing between 3% and 7% over the past 10 years. Thus, the population has a significantly low capacity to buy products with the money they possess. Actually, inflation has been a chronic problem in Brazil. The problem lies on the wrong incentive provided by the Government to stimulate purchases when there is no internal production to satisfy the demand. Therefore, prices end up growing high in order to keep balance in the market. Furthermore, the imports of products needed to meet demand also make products more expensive and not affordable by the majority of the population. At present only about 25 to 33 million consumers out of the 200 million inhabitants in Brazil, are able to afford imported products10. An example of this is the fact that one bottle of the imported olive oil can reach R$ 48 (15€), which is a high price compared to other vegetable oils sold in the market11. Therefore, the 2014 GDP per capita in Brazil of R$ 29,197 (9,002€) does not imply that every Brazilian has the capacity to buy imported products.
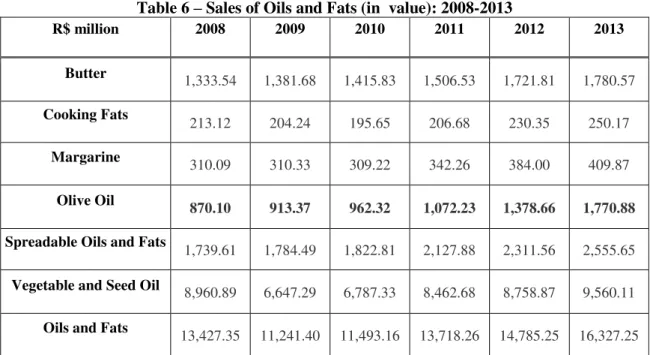
The Market
Regarding consumption Brazil consumes only 0,2lt per inhabitant/per year, whereas Greece or Spain consume between 12lt to 20lt per inhabitant/per year. This fact makes Brazil a market with a real future potential, meaning that in the long-term the consumption levels of olive oil in Brazil may increase. Data from Euromonitor already show this increasing path of consumption. Presently in Brazil, the sale of vegetable oils has been increasing while other cooking fats (butter or lard) have been declining – see
appendix 6– which shows a preference for vegetable oils in Brazil. In fact, the demand
9 IPCA – Índice de Preços ao Consumidor Amplo developed by IBGE (Instituto Brasileiro de Geografia e Estatística) 10 Embrapa - http://www.cpact.embrapa.br/publicacoes/sistemas/sistemas-16/11_mercados_e_comercializacao.htm 11 As an example, see olive oil prices in Brazil at supermarket Buscapé website -
for these products has been increasing throughout the time. This can be observed in the growing domestic consumption of vegetable oils – see appendix 7. More specifically,
the increasing domestic consumption of olive oil is another factor that confirms the growth in demand while at the same time influencing imports, as we intend to show further on. Olive oil is already emerging in the Brazilians’ diet – mainly due to the cultural Portuguese influence. Nevertheless it is still a product with a seasonal consumption that varies across the year, mainly at Christmas. Hence, olive oil still has a large path to undertake in order to keep its consumption boosting.
The consumption of olive oil is not homogenous across the various states. These are grouped in regions: north, south, midwest, northeast and southeast. The more developed regions in the south possess more purchasing power comparatively to the northern regions. States like São Paulo – considered the most developed one – concentrating more than 22% of the total population and where income per capita is higher, makes this state more prone to the use of olive oil. Furthermore, São Paulo is also influenced by the wide presence of Europeans’ descendants and immigrants, traditional consumers of olive oil.
Therefore southern regions demand more quality and premium products, being able to pay for olive oil, more expensive than other oils, such as soy oil or palm oil – which are more heavily consumed in the northern regions due to lower economic conditions. In fact, the previously mentioned substitute oils affect the demand for olive oil due to its still high traditional consumption in Brazil.
According to data from USDA the consumption of vegetable oil in Brazil is not just limited to olive oil. Other vegetables oils are still largely consumed by the Brazilians when compared to olive oil –see appendix 7. Soybean, cottonseed and palm oils are the
chosen for analysis and comparison with olive oil. The soybean oil is the most widely consumed, reaching 5,680 million tons that is 85% of the total consumption of vegetable oils. Next on the ladder is the palm oil with 7% of the total consumption that is 500,000 tons, followed by the cottonseed oil with 6% of the total consumption and finally olive oil, only detaining 1% of total consumption – 90 thousand tons. The main conclusion to draw from Table 7 – see appendix 7 – is that currently in Brazil other
vegetable oils like soy and palm oil, are still largely consumed when compared to olive oil. In addition, they are also widely produced in Brazil –see appendix 8 – presenting a
lot of expertise and credibility among the consumer, while olive oil still has no significant developed production yet. Consequently olive oil faces huge competition from other types of oils in the Brazilian market and its presence is still minor. Furthermore, its consumption is more concentrated in some specific states – like Rio de Janeiro or São Paulo – while the consumption of the top 3 vegetable oils is spread all over the states but more focused on the northern regions due to cultural factors. The latter are less developed regions, have lower awareness and access to better developed products, and consequently consume more typical oils from their own region like the palm oil widely used in typical Brazilian recipes.
Production
As to the production of olive oil in Brazil, according to the International Olive Council, itwas still inexistent in 2012, as well as in 2014 according to forecasts –see appendix
8.12 Being a country under harsh tropical conditions, this fact does not help in the
12“The International Olive Council (IOC
) is an intergovernmental organization that provides a forum for interaction
and discussion among the world’s leading olive oil-producing and consuming countries. It plays a major role in setting standards for trade. IOC was established in 1959 under the auspices of the United Nations. Over time, IOC
membership has grown to include the EU and 16 olive oil-producing countries (Albania, Algeria, Argentina, Croatia,
production of olive oil. During winter, Olive trees need to be under low temperatures –
5 to 7 degrees Celsius – which proves difficult to producers to find appropriate conditions in a country where temperatures are on average above 20 degrees Celsius. This is the reason why the best places to plant olive trees would be on mountainous regions where temperatures are lower – making only several states eligible for this practice. Nevertheless there are still small Brazilian producers of olive oil, which are starting to grow. Olivais Sul is an example. A small olive oil brand in 2012 was producing 20,000 litres of olive oil in Rio Grande Sul - area with similar climate conditions to Mediterranean Europe – and expects to keep growing its productions in future years13. However their output is still not significant comparing with Brazil olive oil imports and domestic consumption.
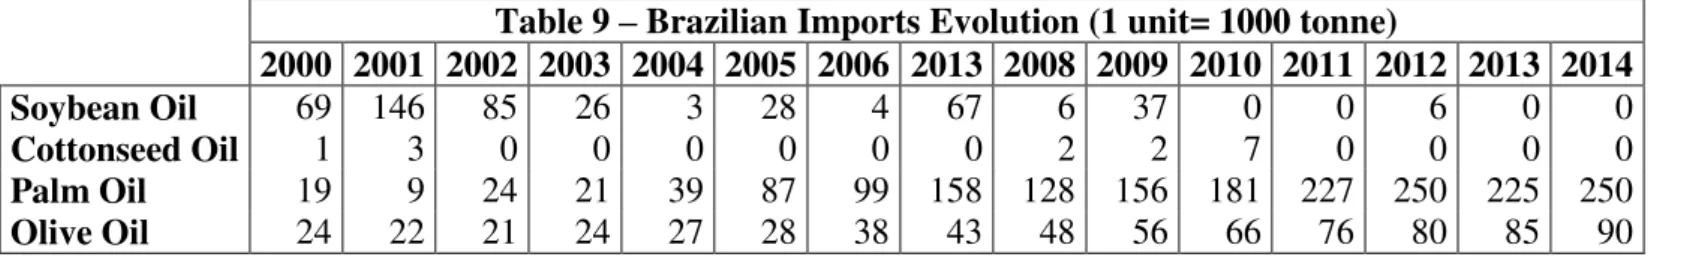
Since internal production is not enough to satisfy demand, imports are significant in Brazil. In fact, Brazil ranks fifth on the top ten importers of olive oil in the world, importing 4.9% of the entire world imports regarding this commodity14. Taking a closer look at the Brazilian imports of olive oil –see appendix 9&10– it is clear that they have
been presenting a tendency to grow, despite some up and down cycles over time. In 2002, Brazil imported 22,103 tons of olive oil whereas in 2012 it imported 75,729 tons, meaning that in ten years Brazil grew its imports by 243%. More specifically, from 2012 to 2013 there was a 7% marginal increase in the imports from 68 to 73 thousand tons of olive oil. Moreover, Brazilian imports annually grow on average 10% according to data from International Olive Oil Council. Taking these statistics and future expectations about the imports level in 2014 into account, it makes it easier to observe the apparent growth in demand for olive oil. As mentioned before, the increasing level of consumption in Brazil incentivizes the increasing level of imports. Thus, olive oil is a
commodity that is evolving along time in the Brazilian market with a lot of potential - still waiting to be exploited.
Industry Regulation
The olive oil industry is highly regulated. Producers and sellers have to comply with regulations concerning grades, standards, quality definition, testing and enforcement. Olive oil is separated into distinct grades that indicate a certain level of quality depending on a variety of criteria.15 It is first important to understand the existent types of grades in the industry – see appendix 11. Each of these grades has to meet various
characteristics specified in the IOC trade standards.
Specific legal bodies are responsible to grade each one of the olive oils mentioned above according to those requirements. That is, all the olive oil up for sale must be certified of its quality definition by a credible institution. The most widely used standards for that purpose come from the IOC and the Codex Alimentarius Commission (international standards).16 The established trade standards include specific categories that the oils must pass (Valentin, 2013).17 Within each category there are parameters that should be observed. Chemical standards constitute an example of the criteria set by the IOC and other institutions – see appendix 12. Standards are a kind of limitation to
the biochemical compounds of the products, which disables producers to produce olive oil as they desire18. Grades and standards are important for producers because they constitute a way of differentiating their products from those of competitors. Nevertheless for grades and standards to work they must be enforced within the producer countries. The IOC provides the proper support to members and nonmembers
15Those are: method of production and oil characteristics such as acidity, odor flavor and the absence of defects.
16
National governments and the European Commission (national standards).
17
Purity Criteria, quality criteria (testing for free fatty acids, peroxide value, flavor and fruitiness and specific standards developed for these parameters), methods of analysis (sampling), contaminants, hygiene, labeling and packaging and food additives.
creating the standards and providing expertise and training programs for testing. However it does not hold enforcement powers which are exclusively of the responsibility of each country. For the existing standards at an international (IOC) and national level (EU/USA), there are few official government regimes that enforce them. For instance, in the European Union, grading standards are codified into the law. Official testing of olive oil production is mandatory for both domestic and exportable products. The mandatory testing however is only targeted to a small share of the EU production.
The establishment and enforcement of standards can therefore contribute to ensure the integrity of the labels and authenticity of the product. In fact, the lack of enforced regulation may provide an incentive for fraudulent behavior – adulteration and mislabeling – by some firms. Some producers where standards enforcement is not mandatory can develop fake products such as a mixture of different types of olive oils or vegetable oils. This is the case of Brazil where there is not a legal empowered body for that purpose. Still, importing olive oil from a wide range of different brands increases the risk, mainly when imports come from countries without regulation. According to PROTESTE, in 2013 from a sample of 19 selling brands of extra virgin olive oil in Brazil, 4 were considered to be totally corrupted, not even considered to be olive oil. This happens because in order to sell olive oil in Brazil it is only necessary the establishment of a brand as olive oil can already be bought directly from suppliers. This leads brands to sell a mixture of olive oils from different suppliers.
high quality extra virgin olive oil brands to set premium prices in the market and, on the other hand, enables low quality brands to easily grab market share with low prices. Producers of higher quality oils believe tighter standards would increase consumption of olive oil since it would reduce doubts regarding the consumer’s perception about the product, and increase their product differentiation from those medium-low competitors.
Competitors
The olive oil market in Brazil is dominated by two main exporting brands within more than 100 established brands in the industry. Gallo and Andorinha – the top 2 players –
detain roughly 44% of the market. Gallo as market leader has 32% market share and Andorinha 12% – see appendix 13. Andorinha has a growing presence in Brazil. The
brand belongs to the Sovena Group - a reference in the olive oil group. The latter bought and introduced the brand to the Brazilian market in 2004, since it was already a long existing brand with tradition. It is present in more than 70 countries producing 160 thousand tons of olive oil with 8 working factories. The other 56% of market share is distributed among more than 100 private labels in the market.
Gallo Worldwide
Until 1989, the Gallo brand belonged to a family-owned business managed by Vitor Guedes. Since then, it was acquired by Unilever-Jerónimo Martins (UJM).19 The UJM joint venture, decided to empower its oils area in an independent unit. Therefore in 2009, Gallo Worldwide, S.A. was created focusing only on the olive oil market. The reason behind this strategic move was that the brand Gallo was already present and growing in other countries. For this reason, it needed special investments and more attention than other small brands managed by UJM. The firm defined its main goal strategy and started targeting mainly the domestic market. Nevertheless, the company
had already passed international exposure, mainly in Brazil.20 The acquisition resulted in more intensive investments, promoting and reinforcing the leading position of Gallo. For instance, new types of product offerings were developed, such as the introduction of Gallo vinegar and olive paste. Although the focus was on the domestic market, very soon the brand wanted to invest in targeted international markets. The embedded Portuguese consumption of olive oil differed a lot from other countries. Yet, some markets presented opportunities for Gallo to invest and expand.
Currently, the brand operates in the Oils and Fats Industry, more specifically in the Olive Oil sub-category.21 It is the number one Portuguese olive oil brand in the world and number three in world ranking of olive oil.22 The company production reaches 30 tons per year, from which 70% is exported.
The brand is recognized by its quality, recognition, credibility, experience and know-how among consumers.23 Its producers work directly with olive tree growers, mills, researchers and experts to learn more about olive oil to continuously improve their products.24 When promoting the brand, Gallo have always used the concept of
Portugality25 in its campaigns. The message associated with its products have always reminded consumers that the best olive oil was Portuguese bounded to the traditional olive oil country. The brand is commercialized all over the five continents, accounting for more than 40 countries. It has offices in Brazil, China and Portugal. It is the market leader in Portugal, Venezuela, Angola and Brazil. Brazil is the strongest market where it
20 The first sale record of GALLO in Brazil dates back to 1908. 21 Information provided by Pedro Costa from Gallo.
22 In 2010, Gallo is elected as the best olive oil in the world - gold medal Mario Solinas Award, the only award recognized by the IOC.
23 Information provided by Pedro Costa from Gallo.
24 Gallo Olive Oil has been certified by the ISO 9001 since 2002 in terms of quality and by the ISO 14001 in terms of environment. In 2011, the brand changed its image to dark colored glass in order to protect the Olive Oil’s quality
delivered to consumers table (Information provided by Pedro Costa from Gallo).
25“Portugality (the Portuguese identity) represents the best of Portugal and the Portuguese people. It
represents openness to the world; it is a concept of travelling the world and embracing it; the concept of a Portugal that
influences the world due to its language, its attitude and even the diaspora that thrives in all continents.” –
enjoys the greatest market share and strongest brand awareness. Gallo is also responsible for 14% of the global Portuguese exports to Brazil.
Brand Strategic Positioning
The company Gallo Worldwide does not want to compete in price with other private labels.26 Gallo focuses on people with high purchasing power who are concerned about health – mainly present in more developed states like São Paulo/Rio de Janeiro. Its strategy is to focus on quality and innovation.27 In 2013, the company spent of more than 120 million euros in quality and R&D28. Gallo distinguishes itself by its specialization and selection of specific olive oils for production. Accordingly, the company has already been awarded with several prizes concerning the quality and taste of its olive oil.29 Only in 2014, the company won 20 awards distributed among the three continents. Over more, the brand is distinguished as the third best olive oil brand in the world. Clearly, Gallo’s olive oil is a differentiated product with developed awareness in
the market. One example of this strategy is the introduction of dark glass bottles. The dark glass prevents olive oil from being exposed to oxidation effects and therefore the damaging of its flavor. With this innovation the brand guarantees that their olive oil preserves its recognized quality intact until it reaches the consumers.
The key for this strategy according to the CEO – Pedro Cruz – is innovation. Through innovation, the best differentiated and diversified solutions can be provided. The firm has been able to distinctively leverage innovation investments. Discovering new sustainable ways of developing, sourcing and manufacturing new products has been crucial.
26 Information provided by Pedro Costa from Gallo 27 Information provided by Pedro Costa from Gallo 28 Source: Informa
Value Chain
Gallo’s value chain is also a unique part of its business model. Highly satisfied consumers keep purchasing products and services overtime. The value chain is constituted by primary and secondary activities. The main primary activities involve operations that include the mixing and the packaging of the olive oil. The brand the mill olive oil acquires directly from suppliers.30 Every year, thousands of samples of milled olive oil arrive to the production plant, in Abrantes. The suppliers are selected according to quality standards set by Gallo. It is estimated that 70% of those samples are rejected. The ones that are accepted must pass another quality test before getting into the production process. As olive oil quality varies from one year to the next year so do suppliers.31 The mill olive oil mixing requires an extensive knowledge that is transmitted inside the company, generation after generation. The blending is a crucial phase. It is where the secret for the perfect aroma, acidity and intensity lies. Every single bottle of Gallo olive oil is produced in Abrantes and only after, transported to the respective international markets.32 Outbound logistics is also a primary activity. It is mainly responsible for the distribution and storage of the olive oil. International distribution is done in containers that get to the respective contracted distributors. Storage is also a process that preserves the quality of the olive oil. It is stored at the Gallo’s plant at a temperature between 15 and 16 degrees C. to allow decantation. Marketing and Sales are another primary activities. Several offices are set in strategic important markets to develop specific promotion campaigns. Brazil is an example, with the selling of different bottle image and types to adjust to the local market needs.33
30 After being extracted from the trees, cleaned and separeted by type olive oils are milled. GALLO acquires the mill olive oil mainly from Portugal, Spain, Greece, Italy or Chile (Information provided by Pedro Costa from Gallo). 31 The quality of each crop depends on the climacteric characteristics of the region itself.
32 Information provided by Pedro Costa from Gallo.
Supporting activities include Procurement, Human Resources and Firm Infrastructure. Procurement is a crucial support activity that selects the key quality to suppliers and their materials that will generate the final product. This activity weighs significantly in the production cost structure34. Also without the firm infrastructure it would be difficult for a production process to be properly organized.
Performance and Sustainability
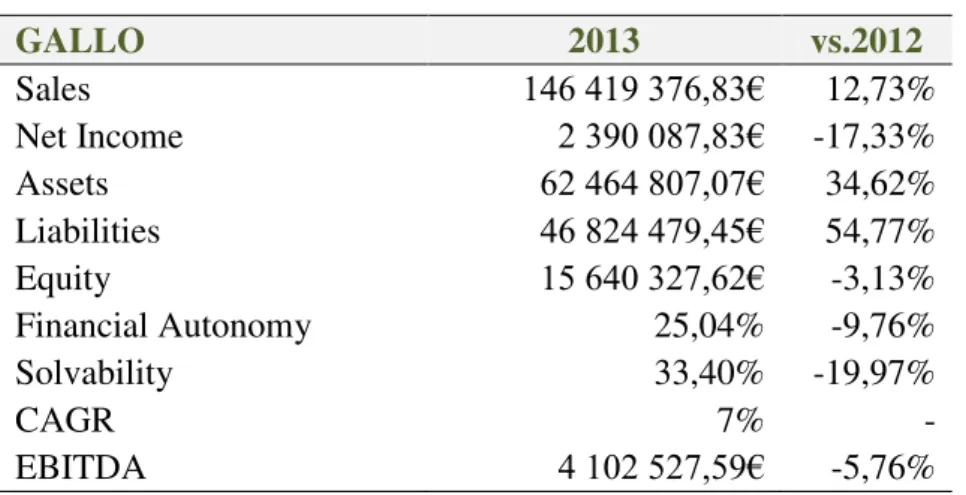
Gallo has been outperforming competitors. Revenues have been increasing over time presenting a five-year compounded annual growth rate (CAGR) of 7% (from 2009 to 2013). The CAGR for the olive oil industry, from 2009 to 2013, is 17,2%.35 The main reason why Gallo stays below this percentage, is that although it captures an enormous part of the olive oil sales, it presents a moderate growth sales volume due to its mature presence in the Brazilian market. In spite of that Gallo reached revenues of 146 million euros in 2013 – see appendix 14. Revenues have increased 13% when compared to
2012. Net income was 2 million euros in 2013. On the other hand, Gallo’s cost structure
increased by 17% from 2012 to 2013. When compared to the average of industry competitors, the average revenue and net income for Gallo’s competitors was 8 million euros and 420 thousand euros respectively - which are significantly lower. Nevertheless, the profit margin for Gallo in 2013, stayed at 3% compared to the average industry profit margin in 2013 of 7.5% - see appendix 15. Gallo is able to collect more revenues
than the average competitor but due to its differentiation strategy and strong investments in quality and R&D, its cost structure ends up to be very high thus hurting its profit margin.
In 2014, 70% of Gallo sales have come directly from importing countries, mainly Brazil. The company has produced 120 tons of Olive oil or 17 thousand bottles per day.
34 Source: Informa
Recently, Gallo has invested 12 million euros in a second factory, being now more comfortable to answer national and international demand.
Several resources are important to explain Gallo’s competitive position. First, its product uniqueness is a core resource. Gallo’s olive oil is distinctive from any other. It has been awarded by several institutions as one of the olive oils ever produced. In 2014, it is considered the 3rd best olive oil in the world. Second, being supported by two big retailers Gallo Worldwide has gained essential resources as market power regarding distribution channels. Gallo works exclusively with an oils and fats distributor in Brazil
– Cargill Agrícola – that owns 20% of the oils and fats distribution market share in
Brazil36. Third, financial resources have given the company the stability to develop domestically and externally. Fourth, the industry expertise and know-how in operations gave the brand the possibility to develop superior quality products. Fifth, R&D capabilities are also an important and unique resource. Innovation enabled significant differentiation among competitors and higher value creation. More investments were made with the intention to create a universal brand for each country of operation. Sixth, the observed brand awareness/equity is also a clear source of competitive advantage, (100% in Portugal or Brazil). For decades, in these markets the main olive oil is indeed Gallo.
Gallo in Brazil: Future Perspectives
Gallo has been able to appropriate an important part of the value created in the industry. The company is clearly the market leader in Brazil. The future of the firm seems to be continuously promising as it has been. Gallo Worldwide has already established its brand in Brazil and its products quality has been constantly recognized over the years. In addition, its strategy and resources proved to be difficult for competitors to replicate. Future promotional campaigns are being developed specifically targeted to the Brazilian
market. The purpose is to adapt and meet local consumer needs in order to keep surpassing a perceived benefit for future generations as well. Drawing from the case information it is possible to establish that Gallo holds indeed a competitive advantage, but is now important to question how it can be maintained. Is Gallo able to face the
challenges posed by structure of the industry and by its competitors? Will it be
able to sustain its competitive advantage?
Case Discussion
In this section, an analysis of the case is presented. We intend to show the relevant concepts and frameworks and apply them to the specific case. After presenting each specific framework, it will immediately be applied to the case.
The value creating potential of a firm in a given industry is determined by the attractiveness of that industry and by the competitive advantage or disadvantage of the firm (Besanko et al., 2013 p. 295). The attractiveness of a given industry is determined by the size (and growth) of the market and by the intensity of competition. The size (and growth) of the market determines the volume that companies operating in that market are capable to attain. The intensity of price competition determines the price-cost margins at which companies are able to sell.
Industry Attractiveness
Market Size and Growth
An important framework to analyze the size of the market and its growth is the product life cycle. The product life cycle is constituted by four main phases: introduction, growth, maturity and decline (Hsueh, 2011, p. 645). If a market for a product is in the
(Shankar, Carpenter and Krishnamurthi, 1999, p. 269). Over more, high market growth rates are characterized by high growth in customer demands and by rapid increase in business investments (Aaker and Day, 1986, p. 410). Customer demands are driven by the growing demands of existing customers and by the increasing product adoption of new customers (Song and Chen, 2014 p.1318).
When analyzing a given market, it is also important to look at its different market segments. Companies want to focus on the different types of buyers that want to purchase the firm’s products (Kotler, 1972, p. 51; Besanko et al., 2013 pp. 323-326). Different buyers value different things, therefore segments have different characteristics. Difference in willingness to pay is an example (Besanko et al., 2013, pp. 323-326).
Intensity of competition
The intensity of competition in a given industry is determined by industry structure and the dynamics of competition. Porter’s Five Forces model is a useful framework to analyze the impact of industry structure in competition. Porter identified the five economic forces affecting competition and profits - internal rivalry, threat of entry, substitutes, supplier and buyer bargaining power (Porter, 2008, p. 80; Besanko et al., 2013 pp. 258-264).
First, “Internal rivalry refers to the jockeying for share by firms within a market” (Besanko et al., 2013, p. 260). Thus, internal rivalry must begin by assessing the market. Identifying the degree of concentration is a good method. The N-firm ratio and the Herfindahl Index help define concentration among competitors (Kwoka and John, 1985, p. 915).
performance or other means it will have profitability losses (Porter, 2008 pp.84-85). The threat and power of suppliers can be greater if they are more concentrated than the industry they sell to, and if suppliers offer products that are differentiated (Porter, 2008, pp.84-85). Buyer’s power is analogous to supplier power (Besanko et al., 2013, p.263). Customers have negotiation leverage mainly when industry products are undifferentiated and switching costs are low (Porter, 1979, pp. 140-141 and 2008, p.83). Customers are highly price sensitive when their budget expense is low and the quality of
the industry’s product does not affect their choice (Porter, 2008, pp. 84-85). Porter
developed framework anticipates and influences competition over time. Industry structure is constantly suffering modest adjustments and eventually abrupt changes (Collis and Montgomery, 2004; Porter, 2008, p.87).
The intensity of competition is also determined by the dynamics of competition. In different industries, firms may formulate their pricing strategies differently. In some markets tacit price coordination is possible and, as a result, firms are able to sustain high prices. In contrast, in other markets we observe frequent price wars (Besanko, et al., 2013, pp. 236-240). There can be impediments towards price coordination. First, when sales are public, deviations from cooperative pricing are easier to detect when prices are secret. Second, when firms differ either in cost structure cooperative pricing becomes more difficult (Besanko et al., 2013, p. 243). If one of these impediments to cooperative pricing occurs it will cause other firms to have losses. Yet firms can avoid them by focusing on non-price responses like strategic commitments or quality competition (Rao, Bergen and Davis, 2000).
top two players – Gallo and Andorinha with 44% market share – it is possible to say that the industry is composed by two oligopoly market leaders and a high number of other small brands. Yet, applying the Herfindahl index to the six big players (more than the two core players) it results in 13% of concentration. With this percentage it can be concluded that the market is unconcentraded, being dominated by several small firms that sell similar products. Including the over 100 brands in the index it can lead the result to a lower percentage getting the market closer to a highly competitive one. Nevertheless, the market is considered to be an oligopoly market with two main brands present. The growing olive oil market and low barriers to exit (low degree of specialization of assets) intensify the level of competition. As most of the sellers sell olive oil without producing it its exit cost is lower than most of olive oil producers. The threat of entry and threat of substitutes are closely related. Regarding entry in the market olive oil, sellers only need to fulfill two requisites. First, find a distributor to sell their products or an approach to sell it directly to the end consumer. Second, meet the necessary requirements defined by the IOC for olive oil. In Brazil, meeting these requirements is not even mandatory since there is no enforcement by the government for force suppliers to comply. In addition, in order to commercialize olive oil you only need the branding since it is possible to buy already produced olive oil from suppliers. Hence, entry has never been so easy. Associated with the easy entry, there are increasing numbers of substitute products. The high number of private labels leads to a wide range of olive oils offered to the market. The big number of olive oil alternatives and its low switching cost will harm and generate price ceilings.
Since the industry is unconcentrated, suppliers have no power in the market. They are highly dependent on the market revenues and cannot influence price. On the other hand,
incomes, Brazilians are slowly moving towards premium brands and products. The growth of olive oil category in Brazil is the proof of that willingness to pay higher unit prices. Olive oil is generally priced around 14R$ (4.5€) while mainstream soybean oil is priced around 2R$ (0.6€). Summing up the Porter Five Forces, the industry attractiveness is medium and the industry average profit margin is also quite positive (7.5%) – see appendix 15. The industry structure will not affect negatively the firm’s
capacity to profit from the industry. However, it will have to efficiently exploit areas where it has competitive strengths.
Concerning the price competition dynamics, firms are able to sustain high prices. Had that been different they would lose profit volume. This is possible since the market is dominated by two big brands. On the other hand, smaller olive oil brands play with lower prices in order to gain more market share in the market.
Competitive Advantage and Sustainability
Following Besanko, we say that a company has a competitive advantage “when (it)
earns a higher rate of economic profit than the average rate of economic profit of other
firms competing within the same market, the firm has a competitive advantage in that
market” (Besanko et al., 2013, p. 295). In order to create more value than competitors
are already experiencing economies of scale or learning and the good is an experience one, rather than a search good (Besanko et al., 2013, p. 310). On the side of elasticity of demand if it is low firms should charge a price premium relative to competition, building its advantage through higher profit margin (Besanko et al., 2013, p.314).
In the Brazilian market Gallo adopts a differentiation strategy. Gallo invests a lot in the quality of its products as well as in their constant improvement. Its interest is in offering a real superior taste benefit for consumers when they buy Gallo products, rather than sell it at a lower price. Accordingly, Gallo products are priced above other olive oil brands in the market. Targeted consumers are willing to pay higher prices for the real health benefits that olive oil brings, even though the consumption of low priced olive oils increases37. Gallo has done a good work passing those benefits to consumers, through specific communication campaigns developed locally to the Brazilian community. The latter actually perceive the benefits and quality that Gallo olive oil brings (considered the third best olive oil in the world). Gallo has gained a very strong positive reputation which creates preference for the brand. The increasing level of Gallo sales proves that consumers are willing to pay a higher price for the firm’s products
(146 million euros sales in 2013. Revenues increased 13% when compared to 2012). In
fact Gallo’s differentiation strategy has enabled the firm to reach a competitive
advantage. When compared to the average of industry competitors in Brazil, the average absorbed revenue of Gallo’s competitors was 8 million euros which is significantly
lower from Gallo’s revenues proving its competitive advantage.
In increasingly competitive markets, firms should be concerned not only with their competitive advantage, but also with the sustainability of its competitive advantage. A firm may have a sustainable competitive advantage because it owns or controls unique firm-specific resources (that competitors cannot imitate) or because it benefits from
privileged market positions (that competitors do not have the incentives to imitate or duplicate) (Cool, Almeida Costa and Dierickx, 2002 p. 57 and 63).
Uniqueness of resources
first type deals with the fact that a firm obtains a higher resource level when maintaining a certain level of investment over a period. Causal ambiguity arises when competitors face problems pinpointing the specific factors that contribute to that asset stock or resource. Exclusivity arises from restricted access to resources, like patents, trademarks or specific licenses (Collins and Montgomery, 2004; Barney, 1991). Resources also have to be nonsubstitutable. Competitors can substitute alternative resources for the production of an alternative offering (Collins and Montgomery, 2004). To analyze Gallo Worldwide competitive advantage, it is important to make an analysis of its resources and understand if they meet the above necessary conditions. An analysis was done comparing Gallo’s resources with competitors (mainly Andorinha) – see appendix 16. Most of the resources of Gallo meet these requirements. First Gallo has a
Privileged Market Positions
As mentioned above a firm may have a sustainable competitive advantage not because competitors are unable to imitate its competitive position but because they do not have the incentive to do so (Cool, Almeida Costa and Dierickx, 2002, p. 62-63). Privileged market positions, allow firms to obtain higher profits by diminishing the incentives of competitors to replicate that positioning performance (Cool, Almeida Costa and Dierickx, 2002, p.62). Several sources contribute to this kind of privileged market positions. First, economies of scale and scope limit smaller competitors’ intentions of
replicating the cost advantage of bigger competitors. The existence of switching costs is another source of privileged market positions. Network externalities are also another source. They exist when the consumer is better-off if other consumers also use the same product, the more the better. Finally, a privileged market position may arise from product variety. This happens when a dominant firm chooses to “flood” the market with several products, with the objective of gaining market share (Cool, Almeida Costa and Dierickx, 2002, pp. 64-65).
In the Brazilian olive oil market, the two main competitors – Gallo and Andorinha –
growth of Andorinha. Additionally, Gallo (owned by UJM) belongs to a bigger multinational retailer than Andorinha (Sovena Group) which can help the firm enhance its privileged market positions, that is, its competitive advantage. Concerning small brands, they do not have the necessary incentives to make this kind of large investments as well as the sufficient power to negotiate with distributors.
As mentioned above, although uniqueness of resources and privileged market positions generate a sustainable competitive advantage (Cool, Almeida Costa and Dierickx, 2002), in the long-run there maybe changes (Barney, 1991, p. 103 and 111). A SCA is explained not by the calendar time during which a firm enjoys a competitive advantage (Barney, 1991, p. 102); it is rather explained by the inability of current and potential competitors to duplicate the benefits of that strategy. When there are resources heterogeneity and immobility – as long as resources comply with the 4 indicators that resources need to have – then there is a SCA (Costa, Cool and Dierickx, 2013, pp. 445-446). Yet, competitors can rely on strategic equivalent resources to replicate a
company’s competitive position – resource substitution (Costa, Cool and Dierickx, 2013
p. 445). A scenario of resource substitution can harm an existent SCA.
References
1. Aaker, D. A., and Day, G. S. (1986) ‘The perils of high-growth markets’, Strategic Management Journal 7, Vol. 5: 409–21.
2. Amit, R. (1986) ‘Cost leadership strategy and experience curves.’ Strategic
Management Journal, Vol. 7(3): 281-292.
3. Barney, J. (1991) ‘Firm resources and sustained competitive advantage’, Journal of Management, Vol. 17 (1): 99-120.
4. Besanko, Dranove, Shanley and Schaefer (2013) Economics of Strategy. New York: Wiley International, Six edition.
5. Collis, D. J., Montgomery, C. (2004) ‘Corporate Strategy: a resource-based
approach’ McGraw-Hill/Irwin.
6. Cool, K., Costa, L. A. and Dierickx, I. (2002) ‘Constructing Competitive Advantage’, In Handbook of Strategy and Management.
7. Costa, L. A., Cool, K. and Dierickx, I. (2013) ‘The competitive implications of the deployment of unique resources’, Strategic Management journal, Vol. 34: 445-463. 8. Dierickx, I. and Cool, K. (1989) ‘Asset stock accumulation and sustainability of
competitive advantage’, Management science, Vol. 35(12): 1504-1511.
9. Fernandes, O. M. (2013) ‘A Dieta mediterrânica: uma porta aberta para novos mercados’, Observatório Agrícola.
10.Hsueh, C. (2011) ‘An inventory control model with consideration of
remanufacturing and product life cycle’, International Journal of Production
Economics, Vol. 133(2): 645-652.
11.Kotler, P. (1972) ‘A generic concept of marketing’, Journal of marketing, Vol. 36, pp. 46-54.
12.Kowka, J. and John, E. (1985) ‘The Herfindhal Index in theory and practice’, The
Antitrust Bulletin, Vol. 30: 915.
13.Mili, S. (2006), ‘Olive Oil Marketing in Non-Traditional Markets: Prospects and
Strategies’, New Medit, Vol. 5(1): 27-37.
14.Porter, M. E. (1979) ‘How competitive forces shape strategy’, Boston: Harvard
Business Review, pp. 21 -38.
15.Porter, M. E. (1980) ‘Competitive Strategy: Techniques for Analysing Industries and Competitors’ New York: The Free Press.
16.Porter, M. E. (1997) ‘Competitive strategy.’, Measuring Business Excellence Vol.1(2): 12-17.
17.Porter, M. E. (2008) ‘The five competitive forces that shape strategy’, Harvard
Business Review, 78-93.
18.Rao, A. R., Bergen, M. E. and Davis, S. (2002) ‘How to fight a price war’, Harvard
Business Review, 107-116.
19.Shankar, V., Carpenter, G. S. and Krishnamurthi, L. (1999) ‘The Advatanges of Entry in the Growth Stage of the Product Life Cycle’ Journal of Marketing
Research, Vol. 36(2): 269-276.
20.Song, M. and Chen Y. (2014) ‘Organizational Attributes, Market Growth and
Product Innovation’, Journal Product Innovation Management, Vol. 31(6):1312 -1329.
21.Valentine, S. (2013) ‘Trade standards for olive oil and olive-pomace oil in the
world’ European Comission: Agriculture and rural development, workshop on olive
oil authentication.
22.Wernerfelt, B. (1984) ‘A resource-based view of the firm’, Strategic Management
Other websites, works among other sources (visited during the Period Aug-Dec, 2014)
1. Pedro Costa from Gallo Worldwide – Responsible for the markets of North and South America
2. Gallo Worldwide - http://www.gallooliveoil.com/pt.aspx
3. Economic and Social Commission for Western Asia (ESCWA) - http://www.escwa.un.org/
4. INFORMA - https://www.informadb.pt/idbweb/
5. INE - http://www.gpp.pt/GlobalAgriMar/informacao/#PM
6. United States International Trade Commission - http://www.usitc.gov/ 7. Observatória Agrícola - http://www.observatorioagricola.pt/
8. Euromonitor International, Oils and Fats in Brazil – 2014 9. The World Bank, 2014 – worldbank.com
10.Estados capitais do Brasil - http://www.estadosecapitaisdobrasil.com/index.php 11.IBGE -
http://www.ibge.gov.br/home/estatistica/indicadores/precos/inpc_ipca/ipca-inpc_201407_3.shtm
12.Embrapa - https://www.embrapa.br/acessoainformacao 13.Index mundi - http://www.indexmundi.com
14.USDA - http://apps.fas.usda.gov/psdonline/ 15.International Olive Oil Council -
http://www.internationaloliveoil.org/estaticos/view/131-world-olive-oil-figures 16.ANBA -
http://www.anba.com.br/noticia/19832272/special-reports/brazil-hopes-to-become-olive-oil-country/ 17.DinheiroVivo -
http://www.dinheirovivo.pt/Empresas/interior.aspx?content_id=3865688
18.Economico - http://economico.sapo.pt/noticias/gallo-ja-tem-75-das-vendas-fora-da-europa-e-consolida-top-3-mundial_193380.html
19.Olive Oil Source - http://www.oliveoilsource.com/page/regulations-and-standards
20.SCIELO - http://www.scielo.br/scielo.php?pid=S0101-20612013000300015andscript=sci_arttext
21.Jerónimo Martins - http://www.jeronimomartins.pt/negocios/industria/Gallo-worldwide.aspx
22.Portugal Global -
http://www.portugalglobal.pt/pt/portugalnews/documents/revistas_pdfs/portugalg lobal_n40.pdf
Appendix 1 – Olive Oil Value Chain
Table 1 - Olive Oil Value Chain
Farmer Miller By Products
Plant Tend Harvest
Olives
Wash Crushing
Milling Pressing and /or
Centrifuging
Waste Water Olive Pomace
Olive Oil Compost or Fuel
Olive Pomace Oil
Appendix 2 – Olive Oil World Production
Table 2 – Olive Oil World Production (1,000 tons)
Countries 2008 2009 2010 2011 2012 2013 AVERAGE
European Community 2118.5 1939 2224.5 2209 2395 1459 71.9%
Spain 1236.1 1030 1401.5 1391.9 1615 616.3
Italy 510 540 430 440 399.2 415.5
Greece 327.2 305 320 301 294.6 357.9
Portugal 36.3 53.4 62.5 62.9 76.2 59.1
France 4.7 7 5.7 6.1 3.2 4.8
Tunisia 170 160 150 120 182 220 5.8%
Siria 100 130 150 180 198 198 5.6%
Turkey 72 130 147 160 191 195 5.2%
Morocco 85 85 140 130 120 100 2.4%
Appendix 3 – Olive Oil World Consumption
Table 3 – Olive Oil World Consumption (1,000 tons)
Countries 2008 2009 2010 2011 2012 2013 AVERAGE
European
Community 85 108 110 131 150 160 61.7%
USA 246 256 258 275 300 293 9.2%
Turkey 85 108 110 131 150 160 4.2%
Siria 80 110 120.5 130.5 135.5 135.5 4.0%
Morocco 65 70 90 100 122 129 2.1%
Brazil 40 42 50.5 61.5 68 73 1.9%
Australia 35 37 44 44 40 36 1.3%
Canada 29 30 37 40 39.5 37.5 1.2%
Source: International Olive Oil Council Appendix 4 – Olive Oil World Main Exporters
Table 4 – Olive Oil World Main Exporters (1,000 tons)
Countries 2008 2009 2010 2011 2012 2013 AVERAGE
European Community 357 376 444 481 555.5 467.5 56.9%
Itália 180.2 176.9 195.1 223.5 233.2 216.4
Espanha 133.9 153.4 196.5 196.2 248 177.5
Portugal 29 30.7 35.8 42.7 51.5 56
Greece 9,8 11 12 13 15.5 11
Tunisia 130 142 97 108 129.5 175 19.1%
Turkey 15 31 29.5 12 20 30 3.4%
Siria 20 15 18 23 25 25 3.1%
Source: International Olive Oil Council Appendix 5 – Olive Oil World Main Importers
Source: International Olive Oil Council Table 5 – Olive Oil World Main Importers (1,000 tons)
Countries 2008 2009 2010 2011 2012 2013 AVERAGE
USA 245 255 258 275 300 288 38.6%
European Community 162 96 78 82 96.5 155.5 16%
Brazil 40 42 50.5 61.5 68 73 8%
Japan 29 30 40.5 35.5 43 51 5.5%
Canada 29 30 37 40 39.5 37.5 5.1%
Appendix 6 - Sales of Oils and Fats by Category
Table 6 – Sales of Oils and Fats (in value): 2008-2013
R$ million 2008 2009 2010 2011 2012 2013
Butter 1,333.54 1,381.68 1,415.83 1,506.53 1,721.81 1,780.57
Cooking Fats
213.12 204.24 195.65 206.68 230.35 250.17
Margarine 310.09 310.33 309.22 342.26 384.00 409.87
Olive Oil
870.10 913.37 962.32 1,072.23 1,378.66 1,770.88
Spreadable Oils and Fats 1,739.61 1,784.49 1,822.81 2,127.88 2,311.56 2,555.65
Vegetable and Seed Oil 8,960.89 6,647.29 6,787.33 8,462.68 8,758.87 9,560.11
Oils and Fats 13,427.35 11,241.40 11,493.16 13,718.26 14,785.25 16,327.25
Source: Euromonitor International from official statistics, trade associations, trade press, company research, store
checks, trade interviews, trade sources
Appendix 7 – Domestic consumption of vegetable oils in Brazil
Table 7 - Domestic Consumption Evolution in Brazil (1 unit= 1000 ton)
2000 2001 2002 2003 2004 2005 2006 2013 2008 2009 2010 2011 2012 2013 2014 Soybean Oil 2932 2935 2895 2959 3091 3091 3395 3955 4275 4980 5205 5400 5544 5680 5870
Cottonseed Oil 129 147 150 244 240 235 304 334 335 350 421 442 373 396 410
Palm Oil 100 120 142 149 164 232 287 315 340 375 400 462 493 480 500
Olive Oil 24 22 21 24 27 28 38 43 48 56 66 76 80 85 90
Total 3185 3224 3208 3376 3522 3586 4024 4647 4998 5761 6092 6380 6490 6641 6870
Source: International Olive Oil Council Appendix 8 – Brazilian Vegetable Oils Production Evolution
Table 8 - Production Evolution in Brazil (1 unit= 1000 ton)
2000 2001 2002 2003 2004 2005 2006 2013 2008 2009 2010 2011 2012 2013 2014 Soybean Oil 4333 4700 5205 5560 5630 5430 5970 6160 6120 6470 6970 7310 6760 7100 7120
Cottonseed Oil 208 172 210 294 300 246 350 380 318 326 454 455 347 396 421
Palm Oil 110 118 129 142 160 170 190 205 230 250 270 310 340 340 340
Olive Oil 0 0 0 0 0 0 0 0 0 0 0 0 0 0 0
Appendix 9 – Brazilian Vegetable Oils Imports Evolution
Table 9 – Brazilian Imports Evolution (1 unit= 1000 tonne)
2000 2001 2002 2003 2004 2005 2006 2013 2008 2009 2010 2011 2012 2013 2014
Soybean Oil 69 146 85 26 3 28 4 67 6 37 0 0 6 0 0
Cottonseed Oil 1 3 0 0 0 0 0 0 2 2 7 0 0 0 0
Palm Oil 19 9 24 21 39 87 99 158 128 156 181 227 250 225 250
Olive Oil 24 22 21 24 27 28 38 43 48 56 66 76 80 85 90
Source: International Olive Oil Council Appendix 10 – Graphic Evolution of Vegetable Oils imports in Brazil
Graphic 1 - Graphic Evolution of Vegetable Oils imports in Brazil
Source: International Olive Oil Council Appendix 11 – Characterization of the different types of Olive Oils
Virgin Olive Oil – oils obtained from olives that have not undergone any treatment other than washing, decanting, centrifugation, and filtration. Virgin oil is obtained during the first pressing of whole olives.
Virgin Olive Oil - obtained through the mechanical pressing extraction process of the
olives. It has a free acidity, expressed as oleic acid, of not more than 2 grams per 100 grams. Type of oil suited for human consumption but may exhibit taste defects;
Lampante Virgin– Not fit for human consumption if does not incur further processing
steps and possesses flavor and odor defects.
Olive Oil– made from blending virgin and refined olive oil. Represents the majority of
global Olive Oil sales and hence fit for human consumption.
Refined Olive Oil – oil that has been refined into a not poisonous product yet it still preserves the initial glyceridic structure of Olive Oil. It does not contain the same beneficial nutrients that the virgin oil contains.
Olive Pomace Oil – it is oil that results from the leftovers from the first press of olives.
It must be refined so that is fit for human consumption and then mixed with other virgin oils.
If any producer enters the industry, its products have to match these grades otherwise they have no ID in the market. From the list of the existing grade types the Extra Virgin and the Virgin Olive Oil are the main products commercialized in Brazil but also in other major consuming countries (Barjol, 2013).
Appendix 12 – Example of Chemical parameters used to grade Extra Virgin Olive
Oil
Source: Devarenne and Vossen. 2010. Understanding the USDA Olive Oil Standards, September; Codex
Alimentarius, Standard for Olive Oils and Olive Pomace Oils, 2009; IOC, “Nota de Prensa,” May 27,
Appendix 13 –Olive Oil Brand’s Market Shares in Brazil
Table 10 – Olive Oil Brand’s Market Shares in Brazil
Brand Company name (GBO) 2009 2010 2011 2012 2013
Gallo Unilever Group 26% 29% 30% 32% 32%
Andorinha Simão and Cia Comércio e Indústria SA 10% 10% 11% 11% 12%
Carbonell Deoleo SA 0% 0% 8% 8% 7%
Serrata Manuel Serra SA 6% 7% 7% 6% 6%
Cocinero Bunge Ltd 4% 4% 5% 4% 5%
La Violetera Importadora de Frutas La Violetera Ltda 3% 4% 4% 4% 4%
Others Others 51% 46% 36% 35% 34%
Total Olive Oil Industry Sub-Category 100% 100% 100% 100% 100%
Source: Euromonitor International Appendix 14 – Gallo and Industry Profit Margin
Table 11 – Gallo and Industry Profit Margin
Source: INFORMA
Appendix 15 –Gallo’s Financial Indicators
Table 12 –Gallo’s Financial Indicators
Source: INFORMA
2013 2012 2011 2010 2009
GALLO
Revenues 146.419.377 129.884.678 110.107.198 106.514.360 112.006.269
EBITDA 4.102.528 4.368.711 3.714.972 3.290.778 4.295.062
Gross Profit
Margin 3% 3% 3% 3% 4%
Industry 2013
Revenues 8.886.118
EBITDA 670.840
Gross Profit
Margin 7.5%
Note: Average Industry Gross Profit Margin
GALLO 2013 vs.2012
Sales 146 419 376,83€ 12,73%
Net Income 2 390 087,83€ -17,33%
Assets 62 464 807,07€ 34,62%
Liabilities 46 824 479,45€ 54,77%
Equity 15 640 327,62€ -3,13%
Financial Autonomy 25,04% -9,76%
Solvability 33,40% -19,97%
CAGR 7% -
Appendix 16 – Gallo Resource based-view analysis
Table 13 - Resources Analysis
Resources Analysis Value? Rare? Imitability? Substitutabilty? Implication
1. Product uniqueness Sustained CA
2. Financial Capability and Stability Sustained CA
3.Distribution Channels Temporary CA
4.Vast Industry Expertise Sustained CA
5. RandD Investments Sustained CA
6. Brand Equity Sustained CA
YES