i~ ~ " '~ ~ i
E L S E V I E R
PII:S0301-4215(97)00102-X
Energy Policy, Vol. 26, No. 1, pp. 55-69, 1998 © 1997 Elsevier Science Ltd Printed in Great Britain. All rights reserved 0301-4215/98 $19.00 + 0.00
The outlook for US oil dependence
David L Greene*
Senior Research Staff Center for Transportation Analysis, Oak Ridge National Laboratory, P.O. Box 2008, Oak Ridge, TN 37831-6207, USA
Donald W Jones I and Paul N Leiby 2
Energy and Global Change Analysis, Oak Ridge National Laboratory, P.O. Box 2008, Oak Ridge, TN 37831-6205, USA
Oil dependence is defined as a dynamic problem of short- and long-run market power. The potential monopoly power of an oil cartel depends on its market share and the elasticities of oil supply and demand, while the economic vulnerability of oil-consuming states depends most directly on the quantity of oil imported and the oil cost share of gross domestic product (GDP). Of these factors, only the market share of the Organization of Petroleum Exporting Countries (OPEC) cartel and the rate of growth of world oil demand are clearly different than they were 25 years ago. OPEC still holds the majority of world oil and, in the future, will regain market share. A hypothetical 2-year supply reduction in 2005-2006, similar in size to those of 1973-1974 or 1979-1980, illustrates the potential benefits to OPEC and harm to the US economy of a future oil price shock. OPEC's revenues are estimated to increase by roughly $0.7 tril- lion, while the US economy loses about $0.5 trillion. Strategic petroleum reserves seem ineffective against a determined, multi-year supply curtailment. Increasing the market's price responsiveness by improving the technologies of oil supply and oil demand can greatly reduce the costs of oil dependence. Each ele- ment of this interpretation of the oil dependence problem is well supported by previous studies. This paper's contribution is to unite these elements into a coherent explanation and to point out the enormously important implications for energy policy. © 1997 Elsevier Science Ltd. All rights reserved.
Keywords. Energy security; Organization of Petroleum Exporting Countries (OPEC); Petroleum
I n t r o d u c t i o n
Three times over the past 25 years disruptions of oil supplies from Persian Gulf producers have doubled or tripled world oil prices. In October 1973, the Arab members of the Organization of Petroleum Exporting Countries (OPEC) announced an oil boycott against countries that aided Israel during the 'October War'. From September 1973 to December 1973, they reduced their crude oil production by 4.2 M M B D (million barrels per day). World oil prices doubled between October 1973 and Janu- ary 1974. Again in 1979-1980, a 5.4 M MBD loss of production from Iran and Iraq, about 9% of world production, resulted in another doubling of the price of oil. From May to December of 1990, total oil output from Kuwait and Iraq fell by 4.8
*Corresponding author. Tel.: 001-423-574-5963; fax: 001-423-574- 3895; e-mail: [email protected].
~Tel.: 001-423-574-4626; tax: 001-423-574-3895. 2Tel.: 001-423-574-7720; lax: 001-423-574-3895.
MMBD, about 7.6°/,, of world oil production. From the second to the fourth quarter of 1990, oil prices shot up from $17.50 to $33 per barrel (1993 dollars)? This latest price shock was short lived, as Saudi Arabia put its enormous slack capacity to use, expanding production by 3 MMBD to make up most of the lost supply (Tatom, 1993, p. 138).
The cost to the US of oil price shocks and supply manipula- tion by the OPEC cartel has been enormous. Recent estimates put the cumulative costs from 1972 to 1991 at about $4 tril- lion (Greene and Leiby, 1993). Will this ever happen again? Today, oil supplies are abundant, oil prices are relatively low and OPEC appears to be ineffective. Is the oil problem over? This paper addresses this question by examining the fundamental factors that create the potential for oil price shocks and those that determine their impacts on oil- consuming economies, asking how they have changed over
56 The outlook for US oil dependence: D L Greene et al
the past quarter of a century and simulating the impacts of a possible future oil supply disruption. We first consider the factors that allow oil producers to influence prices. The distribu- tion of world oil resources allows a small number of states, whose economies are dependent on oil sales, to supply a very significant share of the world market. Market share, together with the inelasticity of oil demand and supply by the rest of the world's producers, confers market power on these states, provided that they can cooperate to control production. The fact that short-run price elasticities are roughly an order of magnitude smaller than long-run elasticities gives an oil cartel enormous potential market power over a period of a few years, but this power can be exercised only by giving up market share, which inevitably leads to an erosion of market power. Thus huge increases in oil prices can be sustained for a few years, but not indefinitely. The dynamics of this proc- ess can explain the pattern of world oil prices and OPEC's market share over the past quarter of a century. OPEC sacrificed roughly half of its market share in defending higher oil prices during the 1980s. Since OPEC still holds the vast majority of the world's oil reserves, it is likely that its market share will continue to increase into the next century, restor- ing its potential market power.
Next, we examine how oil price shocks harm the economies of oil-consuming countries by:
(1) transferring national wealth to the economies of oil- producing states;
(2) by lowering the potential level of domestic product; (3) by reducing further the gross domestic product (GDP)
by temporarily causing less than full employment of the factors of production.
These three additive effects have amounted to trillions of dollars in losses for the US economy over the past 25 years. US oil imports are now very near historic highs. Oil cost as a share of G D P has risen and fallen with oil prices, but now stands at about the same level as in 1972, immediately prior to the first oil price shock. Recent econometric studies sug- gest that the sensitivity of US G D P to oil price shocks has changed little in the past 20 years.
Finally, a simulation of the world oil market and price impacts on the US economy is used to demonstrate the potential for future price shocks and economic losses. Begin- ning from a US Department of Energy (DOE) reference case projection, a 2-year supply cutback, equivalent in size to those of 1973-1974 and 1979-1980, is estimated to bring OPEC a windfall of about $0.7 trillion and cost the US economy $0.5 trillion. Whereas the use of strategic reserves is relatively ineffective in reducing either OPEC's profits or the damage to the US economy from such a prolonged price shock, it is shown that increasing the elasticities of oil demand and supply is potentially a very effective strategy. This points towards research and development into advanced technolo- gies for oil supply and oil use, as well as alternative energy sources, as potentially the best strategies for coping with the problem of oil dependence. The ability of research and develop-
ment to change oil market fundamentals significantly, however, has yet to be demonstrated.
The oil problem
Is the world 'running out o f oir?
Certainly, the world's oil resources are ultimately finite. However, this is the wrong question. The more relevant question is, 'Is the economic theory of exhaustible resources the appropriate theoretical context for analyzing the world oil market today?'. The answer to this question is no. Energy economists increasingly agree that the brilliant theory of depletable resources developed by Hotelling (1931) is not a particularly useful model of the world oil market. As Adel- man (1990b) (p. 9) has pointed out time and again, 'Oil reserves are not a one-time stock to be used up, but an inventory, always being consumed and replenished by invest- ment, in new and especially in old fields'. Despite several noteworthy efforts to modify the Hotelling model to capture the reality of the world oil market (eg Stiglitz, 1976; Gilbert, 1978; Alsmiller et al, 1985; Marshalla and Nesbitt, 1986), it remains an unrealistic representation of the nature of oil resources (Banks, 1986; Watkins, 1992).
Mabro (1992) (p. 3) has identified the key reason why markets do not treat oil as a depletable resource: 'The geophysi- cal limits may bite one day, but this day of reckoning is so far ahead as to have, on any conceivable assumption about discount rates, no impact on price'. This view was echoed by Gordon (1994) (p. 4) who pointed out that, in most cases, resource exhaustion is not a pressing problem either because the exhaustion costs are too low to matter or because the constraint on resources is non-binding. Considering the reserves of the OPEC countries, one finds that putative 'exhaus- tion dates' are so far in the future that it is hard to conceive how they could be relevant to OPEC's pricing policy, a Indeed, the user (depletion) cost of oil to Saudi Arabia in 1976 was about 2.5 cents per barrel (Adelman et al, 1991).
Nor have increasing costs of finding and developing oil been a factor. Middle Eastern OPEC countries can expand their reserves with very little effort. Finding costs which, in non-OPEC areas are usually a significant component of production costs (Adelman, 1986b), are trivially low in the Middle East (A1-Chalabi, 1988a, p. 231).
If the depletable resource model is inappropriate for oil, a much simpler model of world supply and demand can be used to understand the oil market. Since oil is much like any other commodity economies produce, in a competitive market the net price of oil (price minus marginal extraction costs) should rise over time only if development costs rise. However, development costs have been relatively stable since 1955 (Adel- man, 1990a). This point is crucial because, if it is not the
The outlook for US oil dependence: D L Greene et al 57
W o r l d oil r e s o u r c e s e s t i m a t e s , 1993
Proved reserves v. Ultimate resources
• OPEC E~ U.S. [ ] ROW Figure 1 World oil resources estimates: 1993
inexorable economics o f exhausting the world's oil resources that causes world oil prices to rise, it must be something else, and that something else is the exercise o f market power. The distribution of worm oil resources
By an accident of geologic history, the member states of O P E C hold the lion's share of world oil resources by any measure (Figure 1). The Oil and Gas Journal estimates that O P E C countries contain 76% of the world's 1007 billion barrels of proved reserves of crude oil. Worm Oil, which puts reserves in the former USSR 130 billion barrels higher, has OPEC's share at 63% of 1107 billion barrels (US Depart- ment of Energy, 1996c, table 36). More inclusive estimates of petroleum resources show a similar pattern.5 The US Geologi- cal Survey puts remaining 'world ultimate resources' of oil at 1.6 trillion barrels, 60% more than reflected in proven reserves (Masters et al, 1994). Of these ultimate resources, OPEC countries hold just over 55% and the US just under 6'¼,. 6 OPEC's own estimates put world undiscovered and discovered reserves at 1.5 trillion barrels, of which they believe they hold 64% (OPEC Secretariat, 1995). 7 At present, OPEC nations are producing at a rate of about 1% o f their ultimate resources per year. The rest of the world, however, is draw- ing down their resources at an average rate of 1.9"/o per year. The long-term trend is clear: an increasing O P E C share of world oil resources and of world oil production.
5Although acknowledging some uncertainty in their estimates, petroleum geologists seem confident in their general level: 'We believe that worldwide, recoverable conventional oil and gas exist in ultimate quantities approximating 2300 billion barrels (370 Gm 3) of oil and 12,000 trillion cubic feet (340 Tm 3) of gas. These values are limited by our concepts of world petroleum geology and our understanding of specific basins; nonetheless, continued expansion of exploration activity, around the world, has resulted in only minimal adjustments to our quantitative understanding of ultimate resources.' (Masters et al, 1994).
6The most recent US Geological Survey (1995) assessment of techni- cally recoverable resources puts the total slightly higher, at 112.6 billion barrels, up from 91.7 billion barrels. Although a significant change lbr the US, this is only about 1% of the total world estimates~
VAt 1992 consumption rates, the 1.6 trillion barrels of ultimate resources would last 65 years. Using advanced techniques to raise recovery rates to 60% would approximately double that number (OPEC Secretariat, 1995). There are, in addition, vast unconventional oil resources in the form of extra heavy oils, tar sands and oil shale.
The inelasticity of world oil supply and demand
After the concentration of resources within the boundaries of a few countries, the most important determinant of the OPEC cartel's potential market power is the inability of supply and demand to respond quickly to shocks. The evidence is very consistent: long-run oil market elasticities are about ten times greater than short-run elasticities (Huntington, 1991, table 4; Huntington, 1994, appendix; Greene, 1991, table 1). This fundamental fact of world oil markets explains why m o n o p o l y pricing of oil can yield enormous profits for several years, but only at the expense of market share and the erosion of monopoly influence (Adelman, 1986c, p. 325).
The most comprehensive assessments of oil market sup- ply and demand elasticities have been conducted by the Energy Modeling Forum (Huntington, 1991, 1994). These provide a consensus that the short-run elasticity of oil demand is smaller (in absolute value) than -0.1, and that the long- run elasticity is smaller than -1.0. s At an oil price of approximately $30/barrel, short-run price elasticities of demand in Huntington's 1994 study of nine major world oil models range from -0.027 to -0.115, with a mean and median of -0.075. Long-run price elasticities of demand range from -0.157 to -2.544, with a mean of -0.562 and a median of -0.437. These average elasticities are consistent with recent studies by Gately and R a p p o p o r t (1988), Gately (1992), Huntington (1994) and Suranovic (1994).
Oil supply is also very inelastic in the short run. The recent simulation analysis of Huntington (1994) used supply elasticities of 0.04 and 0.4 for short- and long-run responses to represent both the Organization for Economic Coopera- tion and Development (OECD) and n o n - O E C D supply. A1-Sahlawi (1989), Huntington (1991 ), Suranovic (1994) and Gately (1995) report similar estimates tbr prices in the vicin- ity of $30/bbl. It is possible, indeed likely, that recent changes in the technology of oil exploration and drilling have changed the price elasticity of oil supply, but the change has yet to be measured.
The monopoly power of OPEC
OPEC is an imperfect monopolistic cartel of the von Stack- elberg type (Mabro, 1992). 9 A v o n Stackelberg monopolist differs from a pure monopolist in that it holds a large enough market share to influence prices, but its m o n o p o l y influence is limited by the existence of competitive suppliers. In fact, Dr Fadihl J A1-Chalabi, Deputy Secretary General of OPEC, described OPEC's role in just this way (A1-Chalabi., 1988b, p.
115).
"As the only structured group of sellers in the world energy trade, OPEC can take pricing and production decisions which have a tar-reaching impact on the world energy market. Other energy sellers are scattered in separate entities, with no
~Throughout this paper, short-run elasticity applies to a period of l year.
58 The outlook for US oil dependence: D L Greene et al
common, coordinated policy action other than the objective of securing and maintaining a market share at a price high enough to allow them to continue investing in the industry.'
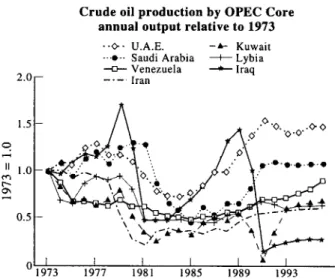
Empirical studies by Griffin (1985), Jones (1990), Dahl and Yficel (1991) and Gfilen (1996) have all rejected the hypothesis that OPEC's behavior is consistent with that of competitive producers. These studies generally agree that OPEC has functioned less than perfectly as a cartel and that its influ- ence on world oil pries has been variable, but that the hypothesis that OPEC countries act as competitive produc- ers can be rejected. The basis for the conclusions of these formal statistical tests is clear from an inspection of the oil production data of OPEC core members. When real prices tripled from 1973 to 1975, Kuwait, Libya, Iran, Saudi Arabia and Venezuela all decreased rather than increased output. Again, in the 1979-1982 period, while oil prices skyrocketed as a result of lost supply from Iran and Iraq during their bitter war, all the other core members consistently cut back production (Figure 2; US Department of Energy, 1997a, table 4). Competitive producers would have increased, not decreased, production in response to higher prices.
If OPEC producers behaved competitively, the enormous differences between the market price and their costs for developing another barrel of oil would have induced them to expand production. At equilibrium in a competitive market, the marginal cost of more intensive or extensive develop- ment of existing pools should equal the marginal cost of finding oil, which should equal the marginal user cost, which should equal the market price minus the cost of develop- ment (Adelman et al, 1991, p. 219). Huge differences among countries in apparent user costs (market price minus marginal development costs) indicate that the market is not competi- tive.
A competitive producer would fail to expand production while receiving huge rents on the marginal barrel produced (market price minus marginal development costs) only if he were unable to do so. In the Persian Gulf states, there is no shortage of developable, low-cost oil. Scrupulous analyses
Crude oil production by OPEC Core annual output relative to 1973
--<>- U.A.E. -m,- Kuwait --.e-- Saudi Arabia I Lybia --t:r-- Venezuela ~, Iraq 2 . 0 1 . . . . Iran
1.5[-
A
.a/'°'.o-°
°
• ~ • - ~ L '.
II 1 0 • '' . l l " ° ' l l " ° " l " °
•
° "
S .
~' *,i .o
0.5F ' ~ ? - ~ - ; " - -
I " ' " " -
")a
011 I I I I • I
1973 1977 1981 1985 1989 1993
Figure 2 Crude oil production by OPEC'Core': annual output
relative to 1973
of oil development costs in OPEC nations have shown that the conditions for competitive markets are not close to being satisfied (Adelman and Ward, 1980; Adelman, 1986a, 1990a; Adelman et al, 1991). In 1978, the investment needed to develop an incremental barrel of oil in the US was 69 times that in Saudi Arabia (Adelman, 1986a, table 1). Updating the Adelman and Shahi (1989) estimates of OPEC's finding and lifting costs, Dahl and Yiicel (1991) concluded that, in all OPEC countries except Nigeria and Venezuela, costs were $2.20 per barrel or less. Nigeria and Venezuela's costs were estimated to be less than $4/bbl and Saudi Arabia's certainly less than $1/bbl. The US Department of Energy (1996b) estimates that future development, production and operating costs for the Persian Gulf region will remain low: $1.60 to $3.20/bbl. Adelman et al (1991) (p. 231) calculated that, in 1976, user costs based on marginal development costs were about 2.5 cents per barrel for Saudi Arabia, while the world market price was over $30/bbl and the in-ground value of US oil was $6.50. Adelman el" al (1991) (p. 231) concluded:
'This extraordinary gap in asset values is a symptom of the unbalanced world oil market, where low-cost reserves are kept out of production to maintain the price. Were the world oil monopoly to disappear, prices would fall to a fraction of their present levels.'
Several estimates have been made of what oil prices would be if the world oil market was competitive. The most recent estimate by Griffin and Vielhaber (1994) put the competitive market price at $7.25 per barrel. Other estimates include Adelman (1989) of $6.25 per barrel, Morison (1987) with a range of $6.25 to $7.70 per barrel and Brown (1987) with a range of $8.50 to $11.10 per barrel (all converted to 1993 dollars). All are obviously well below market prices since 1973.
That the OPEC cartel has exercised and can exercise monopoly power in world oil markets by cooperating to curtail production is widely accepted (see, for example, Adel- man, 1990b; Jones, 1990; Griffin, 1992; MacFadyen, 1993; Griffin and Vielhaber, 1994). Those who argue that OPEC has not been effective in using its potential monopoly power in the past (Bohi and Toman, 1993) have overlooked the fact that prolonged higher prices are inevitably followed by the waning of monopoly influence with the loss of market share (Wirl, 1985; Greene, 1991; Suranovic, 1994). However, at lower prices, lost market share is recaptured in time, and monopoly influence is restored.
Basic economic theory applied to the history of world oil prices proves to be very enlightening about this process. In a static market, a monopolist maximizes profits by charging a price P that exceeds the cost of production C (including the normal return to capital)
C
P= (1)
[1 + 1//3(P)]
where 13(P) is the price elasticity of demand.
The outlook for US oil dependence: D L Greene et al 59
$100 $8O "~ $60 m_
$40
$20 $o
Oil prices and core O P E C m a r k e t share historical a n d projected
• •" . . . . Short-run monopoly price
_ , ' " Long-run monopoly price
/ • 80
-- 8 ~ ~ 95 74
-" ~ 7 3
I I I I
15% 25% 35% 45% 55%
M a r k e t share
Figure 3 Oil prices and core OPEC market share, historical
and projected: 1995 AEO
profit-maximizing price depends on two other factors: (1) its market share (0<s<l), and (2) the ability of competitors to respond to a reduction in supply (Greene, 1991). In Equa- tion 2,/~ is defined as the change in quantity supplied by competitive producers for a one-unit increase in supply by the von Stackelberg monopolist
C
P = (2)
1 + { I//3(P) s [/~(P) + 111
If the rest of the world (ROW) can meet OPEC's supply reductions barrel for barrel, at the same price, the cartel has no monopoly influence over prices. Supply responsiveness is a direct function of the price elasticity of supply, as one would expect (Greene, 1991, p. 126). l° Similarly, as market share approaches zero, P converges to C.
The large difference between short-run and long-run oil market price elasticities implies that a cartel can force prices much higher in the short run than can be maintained in the long run (Greene, 1991; MacFadyen, 1993). Thus small sup- ply shortfalls of the order of 10% or less can create enormous price shocks in the short run, but such price levels cannot be maintained in the long run without a continuing sacrifice of market share. However, as a cartel gives up market share, it gives up the ability to maintain high prices, as Equation 2 shows. Ultimately prices must fall to long-run monopoly levels (or somewhat higher in a growing market).
This pattern is clearly evident in the history of oil prices and OPEC market share. In Figure 3, oil price is plotted against the market share of the OPEC core nations: Saudi Arabia, Kuwait, Iraq, Iran, U.A.E. and Libya. Years are identified by their last two digits. Two curves representing the long-run (lower curve) and short-run (upper curve) profit- maximizing price as functions of the core O P E C nations' share of the world market are also plotted. The curves were drawn using the same short- and long-run elasticity values as
mlf the ROW supply elasticity is c~, then
~(P) = [(c,//3)(l - s ) ] / [ l - (~d/3)(1 - s ) ]
used in the simulation model below. ~j The 1972 world oil price (which is close to the estimated competitive market prices cited above) is assumed to be the competitive price (C) for all years.
Prior to 1974, oil prices were below even the long-run monopoly price curve. The price shock of the last quarter of 1973 and 1974 raised prices above the long-run curve, but well below OPEC's short-run profit-maximizing price. In a growing world market, prices just above the long-run curve can be maintained indefinitely at a constant market share. This appears to be what was happening from 1974 to 1978. In 1979 and 1980, spurred by the oil supply disruptions due to the Iran-lraq War, prices rocketed towards short-run profit-maximizing levels. Sustaining these price levels in 1981, 1982 and 1983 cost OPEC dearly in market share. With profits and market share continuing to dwindle in 1984- 1985, the OPEC resolve cracked. In 1986, when Saudi Arabia expanded production, prices fell to approximately the long- run monopoly price level. Today, growing economies readjust- ing to lower oil prices are buying more OPEC oil. In Figure 3, D O E forecasts of OPEC market share in 2000, 2005 and 2010 illustrate the expected trend of increasing OPEC market share (US Department of Energy, 1996d).
Studies by Wirl (1990) and Suranovic (1993)(1994) have shown that a pricing policy of brief price shocks of a year or so in duration, separated by periods of lower prices, may well be a profit-maximizing strategy for OPEC. This is bad news for consuming nations because, between 2000 and 2005, OPEC should have regained all the market share it gave up defending high oil prices during the 1980s. Of course, this does not prove that price shocks will occur; it merely establishes motive and opportunity. LaCasse and Plourde (1995) distinguish two potential causes of future oil supply disrup- tions: (1) political and institutional factors which lead to 'random shocks', and (2) the wilful exercise of monopoly power which produces what they call 'strategic shocks' Of course, a hybrid of the two is possible as well and, should a random shock occur, it will probably be in OPEC's economic interest to draw it out for a year or two.
Because the 'market failure' in the world oil market results from imperfect competition due to the market power of the OPEC cartel, it is incorrect to characterize oil dependence costs as 'externalities', as some have done (Bohi and Toman, 1996). Although some aspects of the problem can be viewed as analogous to external costs, defining the oil dependence problem in terms of external costs leads one to search in the wrong direction for solutions: towards taxes that might 'internalize' the supposed external costs. While Pigouvian taxes can produce an efficient market outcome in response to external costs, they are not a cure-all for monopoly power.
60 The outlook for US oil dependence: D L Greene et al
Impacts of monopoly behavior on the US
economy
The cost to the US economy of the non-competitive pricing of oil has been enormous in the past and could be substantial in the future. The US Department of Energy (1988) (p. 6) estimated the lost economic growth from the two oil shocks of the 1970s at $1.2 trillion (apparently estimated in 1987 or 1988 dollars). Considering the entire 1972-1991 period, and counting all types of economic losses, including transfer of wealth, Greene and Leiby (1993) put the toll at over $4 tril- lion (1993 dollars). This is about 80% of the total US expenditure on national defense and twice the interest pay- ments on the national debt over the same period.
A sudden increase in the price of oil creates three separate and additive types of economic loss to the US economy:
(1) loss of the potential to produce; (2) macroeconomic adjustment losses;
(3) transfer of wealth from US oil consumers to foreign oil exporters (difference between monopoly and competi- tive prices).
When oil prices rise, the economy is able to produce less output with the same resources of capital, labor, materials and land. The loss of potential output or gross national product (GNP) is equal to the net losses of consumer and producer surplus that occur throughout the economy. The implications for the economy's long-run potential to produce have been described by Tatom (1993) and many others (eg Pindyck, 1980; Burgess, 1984; Pakravan, 1984). The short- run inelasticity of oil demand and supply suggests that fac- tor input ratios will change little at first and that factor substitution will increase over time.
When prices rise rapidly, additional transitory costs result because wages and prices are not able to adjust sufficiently rapidly to the new oil price regime to permit the economy to operate at full employment. Macroeconomic adjustment losses add to the loss of productive capacity that would be inescap- able even were the economy at full employment. The adjust- ment mechanism for these losses is entirely different from that for loss of potential G N P and should be much more rapid (Tatom, 1993, p. 132). For example, Uri (1996) found that crude oil price increases during the 1947-1994 period raised unemployment rates in the US for at least 3 years. Recent research has begun to improve our understanding of the aggregate relationship between oil price shocks and mac- roeconomic losses (Hamilton, 1996a, 1996b; Hooker, 1996a, 1996b) and has helped to identify at least some of the micro- economic mechanisms that convert oil price shocks into more extensive and pervasive macroeconomic losses (Davis
et al, 1996; Hooker, 1996c; Davis and Haltiwanger, 1997). When prices are increased by monopoly behavior, there is also a transfer of wealth from US oil consumers to the owners of foreign oil. This 'loss' is a transfer payment. The wealth still exists; ownership is simply transferred from US citizens to foreign oil producers. A similar transfer of wealth also takes place within the US from oil consumers to own-
ers of US oil resources. Since this is internal to the US, it cannot be counted as a loss to the national economy. 12 The transfer of wealth is exactly equal to the quantity of oil the US imports times the difference between the monopoly price and the competitive market price of oil. Because they overlooked the transfer of wealth as a true cost to the national economy, LaCasse and Plourde (1995) (p. 13) incorrectly concluded that import reliance is not an important concern of energy policy.
All three effects have been recognized by economists for some time. Pindyck (1980) (p. 19) estimated a 0.25% loss of US potential G N P for a 10% increase in the price of oil, based on 'back-of-the-envelope' calculations, and also asserted that the indirect or macroeconomic adjustment effects would be of roughly equal magnitude. Mork and Hall (1980a)(1980b) statistically estimated that, in response to the 70% increase in energy prices in 1974 and the additional 30% increase in 1975, US G N P fell by 2.5'V,, in 1974, about 5"/0 in 1975 and 4.5% in 1976. Findings by Mork and Hall (1980b) for the 1979-1980 price shock were similar: a 1% decrease in G N P in 1979 and a 4"/0 decrease in 1980. Hamilton (1983)(1985) investigated the historical relationship between oil price shocks and G N P and concluded that, '...we must give causal interpretation to the correlation between oil prices and output' (Hamilton, 1985, p. 115). More recently, Moosa (1993) concluded that the relationship of oil price to output declines satisfied statistical tests of causality, and Lee et al (1995) found that price shock impacts on G N P were greater when oil prices had been stable recently than when recent price movements had been frequent and erratic. They also found that price increases reduced GNP, but that price decreases did not have a statistically significant effect. In part, they attributed this to the positive potential G N P effects being counterbalanced by negative macroeconomic adjustment costs during downward price shocks.
Hickman (1987) used 14 major macroeconomic models to estimate the impact of a 50'¼, oil price shock, occurring in 1984, on US GNP. He found short-run responses ranging from -0.010 to -0.047, with an average of -0.028. This would imply an average elasticity of twice that amount, or -0.056, very much in line with the statistical evidence. Using a small model of the world oil market, Helkie (1991) simulated the impacts of past price disruptions and concluded that an estimate of the elasticity of G N P with respect to oil price of about -0.03 replicated past events well.
Recently, Mork et al (1994) estimated macroeconomic responses to oil price increases in seven OECD countries from 1967 to 1992. They found an elasticity of US G N P with respect to the price of oil of about -0.05 to -0.07, essentially the same as studies using only data from earlier oil price shocks. Tatom (1993) examined the question of whether the impact on the US economy of the brief doubling of world oil prices from July to October 1990 was disproportionately smaller than previous shocks. He concluded
The outlook for US oil dependence: D L Greene et al 61
that the US economy appeared to be as vulnerable to oil price shocks as ever.
The transfer of wealth is not included in the loss of output (GNP) measured by these studies, as explained by Greene and Leiby (1993) and Huntington and Eschbach (1987) (pp. 199-200), and described by Hogan and Broad- man (1988) (p. 65), Mork et a/(1994) (p. 20) and many oth- ers. The reason is that measured GNP is adjusted for changes in the price of imports. As a result: 'Even if total US output remains unaltered by the oil shock, the US economy would still be worse off due to the reduction in the purchasing power of its domestic income' (Huntington and Eschbach, 1987, p. 202).
We define the transfer of wealth to be a cost of oil depend- ence only in so far as it derives from the exercise of monopoly power by oil producers. If there were no monopoly behavior in world oil markets, there would still be some transfer of wealth to oil producers in the form of producer surplus. However, this would not be counted as a cost of oil depend- ence to the US because the competitive market solution yields the maximum economic benefits. Thus, in estimating the transfer of wealth cost in the monopolized oil market, only the cost over and above a competitive market price is counted.
The future oil problem
With the exception of OPEC's market share and the growth rate of demand, the basic determinants of world oil market vulnerability to monopoly behavior have changed little since 1973. Oil demand and supply remain price inelastic (Gately, 1995, p. 2). Although there is reason to believe that recent advances in oil supply technologies (eg three-dimensional (3-d) seismic imaging, horizontal drilling, etc.; see, for example, Salameh, 1995; Streifel, 1995) have increased the elasticity of supply to some degree, the effect on world price elasticities of oil supply has yet to be quantified. On the other hand, there is reason to suspect that demand may be less elastic. Since the first oil price shock, the only growth in world oil demand has been in the transport sectors of developed economies and in all sectors of developing economies, precisely the areas in which oil demand has historically been most inelastic. From 1971 to 1990, oil use outside OECD countries grew at the rate of 3.6% per year. Transportation oil use in OECD countries increased by 2.2% per year, but oil use in other sectors of OECD economies declined overall by more than 20% (International Energy Agency, 1992).
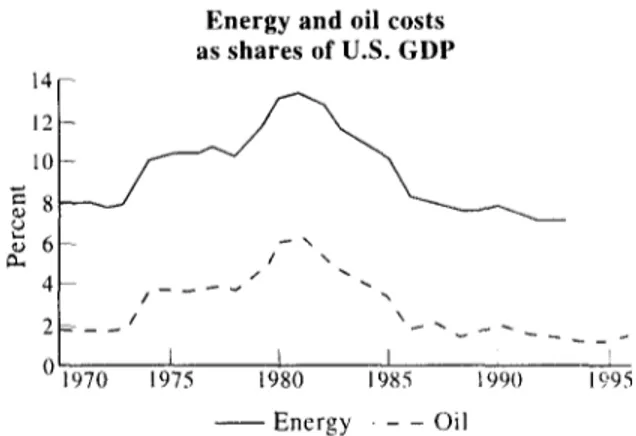
The sensitivity of the economy to oil and energy price shocks is related to the cost shares of oil and energy in G N P (Tatom, 1993, p. 134). Intuitively, the more one spends on oil, the more a proportional increase in its price will reduce output. Although the economy's dependence on energy and oil since 1981 has been significantly reduced, it is now about the same as it was at the time of the first oil price shock. In 1973, the net cost of oil to the US amounted to 1.9% of GDR In 1992, oil's cost share was 1.8%, and it stood at about 1.8% in 1996 (Figure 4). Energy costs amounted to
Energy and oil costs as shares of U.S. GDP
12
1
~, 6~ / - " - \
4 ~ / - _ - ~ " ~
0 I- I I I -
1970 1975 1980 1985 1990 19'95
- - E n e r g y - - - O i l
Figure 4 Energy and oil costs as shares of US GDP
8.1"/,, of GDP in 1973 and 7.5% in 1993. To be sure, energy and oil costs rose during the late 1970s and early 1980s with the price of oil. They will rise again with future oil price increases. The important point is that oil's importance to our economy is about the same as it was 20 years ago, before the Arab OPEC oil embargo of 1973-1974.
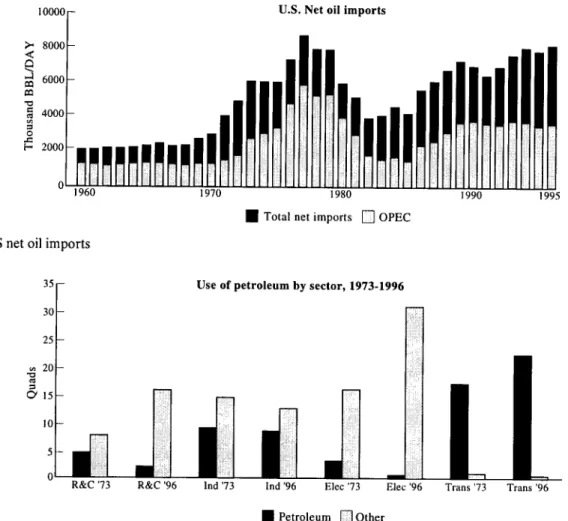
The transfer of wealth from US consumers to foreign owners of oil depends directly on the level of US imports. Current levels of US oil imports (46.2'7,, or 8.4 MMBD) are higher than those preceding the first oil price shock in 1973- 1974 and almost equal to the highest level on record (46.5% or 8.6 MMBD) in 1977. US oil imports have been rising since 1982 and are expected to continue to rise in the future (Figure 5). The US Department of Energy (1996d) (table CI 1) predicts that US imports will increase from their cur- rent level of 46% of US consumption into the range 52% 65% by 2005, and to 5Y'/,~-67% by 2010. Greene and Leiby (1993) put the transfer of US wealth due to monopolistic oil pricing from 1972-1991 at over $1 trillion. A given OPEC price increase in the future will almost surely cause a greater loss of US wealth than in the past because the US will be importing more oil.
Transportation is at the center of the US oil dependence problem, because it is by far the dominant consumer of petroleum products, accounting for two-thirds of US oil use. Its demand for oil is also highly inelastic (Dargay and Gately, 1994). In terms of the light products that drive the petroleum market, transportation's share is more than three-quarters. While other sectors have shown some ability to sm~stitute other energy sources for oil over the past 20 years, transporta- tion has not (Figure 6).
Impacts o f a 2-year oil shock on the US econono,." a simulation
62 The outlook for US oil dependence: D L Greene et al
Figure 5
10000~ "<~ 8000[--
6000- e~
~
~ 4 0 0 0 f ~ ~ ~ I
~" 2000
0 1960 1970
US net oil imports
U.S. Net oil imports
1980 1990 1995
• Total net imports [ ] OPEC
Figure 6
35 30 25 20 ~ 15 10 5
0 R&C '73
R&C '96
Use of petroleum by sector, 1973-1996
lnd '73 Ind '96 Elec '73 Elec '96
] 11
Trans '73 Trans '96Use of petroleum by sector: 1973-1994
• Petroleum []Other
Both supply and demand equations are assumed to be linear, implying that elasticities will increase linearly with the price of oil. The elasticities for the base case simulation model are shown in Table 1 as a function of world oil price) 3 A simple lagged adjustment specification, with an adjust- ment parameter of 0.1, is used to represent short- and long- run adaptation to price changes. Thus long-run elasticities are ten times as large as short-run elasticities. We do not include an explicit G N P feedback effect on oil prices such as that used by Gately (1995). Such an effect, however, is 'simulated' by the linear demand equation, in which the elasticity increases linearly with the price of oil. 14
The US Department of Energy (1995a) Annual Energy Outlook 1995 (AEO) reference case provides a 'base case' forecast.~5 Year-specific intercept terms are calibrated for the
~3These values are consistent with the review of Huntington (1991) and the assessment of OPEC pricing strategies by Gately (1995).
14In a constant-elasticity oil demand model, the GNP feedback effect causes the price elasticity of demand to increase approximately linearly with the price of oil (see Appendix A).
tSSince this simulation was performed, the US Energy Information Administration (EIA) has produced two additional AEOs with increas- ingly optimistic projections about non-OPEC oil supply. Use of a more recent reference case would reduce the costs to the US and benefits to OPEC somewhat, but would not change the fundamental conclusions of our simulation in any significant way.
supply and demand equations to match exactly the EIA reference case projections. A price shock scenario is produced by reducing OPEC supply and using the model to compute a new market solution for each year for US and ROW oil supply and demand, given the constant terms from the refer- ence case and the price-slope coefficients implied by the elasticities in Table 1.
The cost of monopoly oil pricing to the US economy is then estimated using techniques similar to those developed by Greene and Leiby (1993). Potential G N P losses are estimated by the changes in consumer and producer surplus, measured as the appropriate areas under the linear supply and (uncompensated) demand curves. The transfer of wealth is simply the estimated quantity of imports times the differ- ence between actual prices and the assumed competitive market price. Macroeconomic adjustment costs are simulated using an elasticity of GNP with respect to oil price, which is proportional to the oil cost share of GNP. It is assumed that the economy adjusts to oil price changes so that impacts change dynamically over time. These methods are described in greater detail in Appendix B.
The outlook for US oil dependence: D L Greene et al 63
Table 1 Simulation model short-run elasticities
World oil price (1993 $/bbl) Demand Supply
US and ROW US ROW
20 -0.037 0.028 0.023
35 -0.068 0.048 0.032
50 -0.099 0.067 0.056
significantly disrupted by an act of war or nature. We make no pretense about being able to predict the timing, size or reason for a future price shock. Instead, we assume a significant supply reduction by OPEC and calculate the effect on world oil prices, the US economy and OPEC revenues.
The US Department of Energy (1995a) A E O reference case projections call for oil prices to increase from $16.12/bbl in 1993 to $19.13 in 2000, $21.50 in 2005 and $24.12 in 2010.16 World oil demand grows at the modest rate of 1.7'2'0 per year, from 66.18 M M B D in 1993 to 88.32 M M B D by 2010. US demand is expected to grow at a much slower pace, 0.7% per year through 2010. US oil supply declines from 9.53 M M B D in 1993 to a low of 8.22 in 2005, but then begins to increase to 8.58 M M B D in 2010 as oil prices increase. The ROW oil supply increases gradually from 29.63 M M B D in 1993 to 33.07 M M B D in 2010, an average annual rate of 0.6%. OPEC's output grows from 26.2 to 46.7 MMBD, an average annual rate of 3.3'7,, (US Department of Energy, 1995a, table A.20). ~7
We use the 1994 InternationalEnergy Outlook (US Depart- ment of Energy, 1994b, table 3) production projections for China, the former Soviet Union and Eastern Europe through 2010. These project that oil output in China will grow from 2.84 M M B D in 1992 to 3.4 M M B D in 2010, an average growth rate of 1%, and that of the former Soviet Union plus Eastern European countries will increase from 9.16 M M BD in 1992 to 11.4 M M B D in 2010, an average rate of 1.2%. Starting with 1993 production estimates, we trend produc- tion levels to reach the combined total of 14.8 M M B D by 2010. Js
With oil prices near the long-run monopoly price level and growing world demand, OPEC's share of the world oil market increases continuously throughout the base case forecast. OPEC's base case share of the total world market grows from 41'2'o in 1993 to 46'7`, by 2000, 51% in 2005 and reaches 53% by 2010. With growing volume and rising prices, OPEC revenues increase from $160 billion in 1993 to $410
~6'Oi1' production here includes crude oil, natural gas plant liquids, other hydrogen and hydrocarbons for refinery feedstocks, alcohols, liquids from coal and other sources and refinery gains.
~VThis is quite close to what Gately (1995) characterized as a 'robustly optimal strategy' for OPEC. He concluded that OPEC should expand its output at approximately the rate of world economic growth. World GDP is assumed to grow at 3.1% per year in the reference case (US Department of Energy, 1994b, table 1).
~SGriffin and Vielhaber (1994) propose an 'aggressive non-OPEC sup- ply scenario', the 'key assumption' of which is that production by tbrmer Soviet republics and China will increase to 19.2 MMBD by 2010. This implies a 3.5% per year rate of production growth for these countries.
billion in the base case by 2010. OPEC grosses a total of $5.0 trillion (1993 dollars) over the forecast period with a present value (PV) of $3.8 trillion discounted at 3'7`, per year.
Others are more optimistic about the future expansion of ROW oil production. Streifel (1995), for example, projects that oil production outside OPEC and the O E C D will grow at 1.9% per year, resulting in an OPEC market share of only 46% by 2010. The more recent 1997 A E O (US Department of Energy, 1996d, table A21) projects OPEC's market share at 43%, 49% and 54'7`, for 2000, 2005 and 2010 respectively. Such differences will have little effect on the basic conclu- sions of this simulation.
The price shock scenario assumes that the total OPEC oil supply in the year 2005 is reduced by 4.2 M M B D (10%) from the previous year, or 13%less than they would have produced in 2005 in the reference case. In the following year, it is assumed that they further reduce supply by an additional 2.8 MMBD, 17'7,, below the 2004 level, or 21'7,, below the refer- ence case projection for 2006. This supply reduction is approximately the same size as those of 1973-1974 and 1979-1980. OPEC is then assumed to begin very gradually to increase production by about 0.7 M M B D per year until, in 2010, the supply reduction is 20.4'7`, versus the base case. This pattern was deliberately chosen to produce almost exactly the same revenues for OPEC in the years 2007-2010 as OPEC would have received in the reference case, thereby reducing the significance of revenue gains or losses in years beyond the 1995 A E O forecast horizon of 2010.
Table 2 presents the results of six scenarios. The numbers shown in a given row are totals for that scenario; changes from the base case can be obtained by subtracting the base case total from the appropriate scenario total. Two scenarios explore the effect of using strategic oil stocks on the sustained supply curtailment. Two others assess the impact of doubling world price elasticities of supply and demand. Although the strategic petroleum reserve (SPR) can be effective against a short-lived, random shock, it is relatively ineffectual against a strategic shock of 2 years or more. Increasing the price responsiveness of oil supply and demand, on the other hand, appears to be a very effective strategy.
A 2-yearprice shock in 2005
64 The outlook for US oil dependence." D L Greene et al
Table 2 OPEC revenues and US economic impacts under alternative scenarios (billion 1993 $, PV in 1993)
Scenario US GNP impacts OPEC revenues
Wealth transfer Potential G N P Macroeconomic Total 1993-2010 2005-2010 (PV in
loss adjustment costs 2005)
Base case 520 130 70 720 2840 1870
Price shock 670 200 270 1140 3330 2560
Strategic petroleum 650 200 270 1120 3320 2530
reserve
Double SPR, 2 years 640 190 230 1060 3310 2520
Double world 150 60 60 270 1520 720
elasticities
2xWorld+price 240 80 150 470 1800 1100
shock
world demand is 4 M M B D lower than the base case scenario. US supply is 0.4 M M B D higher in 2005 and 0.7 M M B D higher in 2006. In comparison with the base case, US demand is 1 M M B D lower in 2005 and 1.7 M M B D lower in 2006. Although prices drop to about $3 above the level of the base case in 2007, supply increases and demand reductions persist after the price shock due to the dynamic adjustment structure of the simulation model. World supply remains 2 M M B D above the base case, and demand continues to be almost 6 M M B D below it. OPEC's market share falls from 50% in 2004 to 44% in 2006. From there, it begins to recover as the cutback is trimmed (Figure 7).
The effect on OPEC revenues is substantial. In 1993 dol- lars discounted at 3"/,, to PV in 2005, the supply shock and subsequent strategy net OPEC an additional $700 billion in gross revenues (Table 2). This is a one-third increase over the reference case revenues for the 2005 to 2010 time period. Whether $700 billion over 5 years is sufficient incentive to induce OPEC members to cooperate on a supply strategy is an interesting question, but is beyond the scope of this paper.
Impact of releases from strategic reserves
The use of SPR is simulated by assuming a maximum draw- down in the first year of the shock. The US SPR presently contains just under 600 million barrels of oil. If all were used over the period of a year, the average production rate would
80
_ 60
d~ 40 e~
~' 2o
Oil price v. O P E C m a r k e t s h a r e s c e n a r i o : s u p p l y s h o c k in 2005-2006
0 I
0.40 0.52
2005
I I t I I
0 . 4 2 0 . 4 4 0 . 4 6 0.48 0.50
OPEC Market share
F i g u r e 7 Oil price versus OPEC market share; scenario: supply
shock in 2005-2006
be 1.64 MMBD. The use of SPR is simulated by adding this to world supply for 2005 before recomputing the market equilibrium price. It is assumed that OPEC will not change its planned pattern of cutbacks in response to the SPR release.
The SPR release causes the oil price in 2005 to fall by almost $10/bbl versus the scenario without SPR. 19 Thus SPR mitigates the price shock of 2005 and, if the supply cutback had ended that year, SPR would have produced enormous economic benefit. However, in 2006, there is no more SPR and, by assumption, OPEC goes ahead with its originally planned cutback. Because prices were lower and supplies more plentiful in 2005 with the SPR release than without it, world economies adjusted less than in the price shock scenario. As a result, the supply reduction in 2006 causes a larger price shock than it would have had SPR not been used. Instead of $46/bbl, 2006 prices after the SPR release jump to $55/bbl. After 2006, they are identical to the no-SPR scenario. In effect, the sequence of prices is reversed. As a result, OPEC revenues and profits are little changed. Estimated gross revenues for the 2005-2010 period are about 1% lower. SPR seems to have little effect against a persistent OPEC strategy to restrain production. On the other hand, during the first year, it had a clear impact and might have a discouraging effect on a cartel struggling to maintain consensus and discipline.
Petroleum stocks held by O E C D countries increased from 2588 million barrels in 1973 to 3588 million barrels in 1996, a net gain of 1 billion barrels. Nearly all of the change is accounted for by increased reserves held by the US and Japan in strategic reserves (US Department of Energy, 1997a, tables 4.5 and 1.6). If all of this additional reserve were released in the first year of the shock, it would raise supply by an average of 2.95 MMBD. We assume that half of the O E C D reserves are sold in 2005, the other half in 2006. The effect is also disappointing. The price of oil stays at $44/bbl in 2005 and $45/bbl in 2006, but then jumps to $37/bbl in 2007 from $29/bbl without the additional reserve. Again,
The outlook for US oil dependence: D L Greene et al 65
OPEC revenues and US losses are little changed. The implica- tion is that the use of strategic reserves in this way against a determined, strategic multi-year supply reduction is neither an effective deterrent nor an effective protection for the economy. 20 These discouraging results parallel the conclu- sions of an earlier analysis by Suranovic (1994), who found that reserves of the order of 30 billion barrels would be necessary to defeat a strategy of determined supply curtail- ment.
Economic impacts on the US
Regardless of the assumed use of SPR, the 2-year supply curtailment costs the US economy around half a trillion dollars PV over the reference case. Total losses to the US economy in the price shock scenario amount to $ l. 1 trillion (1993 dollars) PV (Table 2). The PV in 1993 of the estimated transfer of wealth through 2010 in the base case amounts to $520 billion. The single price shock in 2005-2006 increases this to $670 billion PV. In 2005 alone, $120 billion PV (versus $35 billion in the base case) is lost via wealth transfer. Half of this goes to OPEC and half to other world exporters.
In the base case, prices increase gradually, but the method used here will always calculate some potential output losses as long as oil prices remain above the assumed competitive market level of $10/bbl. In the base case, estimated potential G N P losses amount to $130 billion PV and macroeconomic adjustment losses total $70 billion PV. In the price shock scenario, the estimated potential G N P losses rise to $200 billion PV and the macroeconomic adjustment losses total $270 billion PV.
Increasing price elasticities
Given the dependence of OPEC market power on supply and demand elasticities, a logical strategy would be to enhance the ability of oil supply and demand to respond to higher oil prices. Increasing the short- and long-run price elasticities of supply and demand would reduce the impact of the price shock caused by a given supply shortfall, thereby cutting OPEC revenues and reducing the impact on the US economy. Improving price responsiveness should therefore act simultane- ously to deter OPEC from initiating a supply cutback and to protect the US economy should one occur. Three key factors determine the price elasticities of oil supply and demand: (1) the preferences of consumers;
(2) the technology of energy use in production and consump- tion;
(3) the technology of energy, especially oil, supply. The last two are susceptible to dramatic changes as a result of technological advances. Indeed, some believe that advances in oil development technology have already increased the elasticity of ROW oil supply (Streifel, 1995, p. 4).
Doubling price elasticities implies that the elasticity of demand at $28lbbl would increase from -0.053 to -0.106. The elasticities of supply at the same price for the US would increase from 0.038 to 0.076. 2~ The increase in elasticities is assumed to begin in 1996 and increase linearly over a decade until a doubling is achieved in 2005. As a result, prices and oil quantities change for all years after 1995, not only those in which supply shortages occur.
Unlike the effect of strategic reserves, the effect of substantially increasing the price responsiveness of the market is dramatic. Doubling the elasticities of supply and demand by 2005 for the entire world cuts post-2005 OPEC revenues by more than half, whether or not a price shock occurs. If there is no price shock, US economic losses with doubled price elasticities are estimated to be $270 billion PV versus $720 billion in the reference case. In the price shock case, US economic losses with doubled elasticities are reduced by $670 billion PV.
The price responsiveness of oil supply outside OPEC is an important factor in mitigating the impact of the oil sup- ply reduction. This contradicts the assertion of LaCasse and Plourde (1995) (p. 20) that supply-side measures are only useful in the case of short-lived, random price shocks and that only demand-side policies can be effective against longer term, economically motivated price shocks. Both matter. Thus the discovery of better, cheaper means of finding, developing and producing oil is an important part of energy policy.
Conclusions
The US oil dependence problem is not one of running out of oil. It is a combined result of the short-run inelasticity of oil supply and demand, the potential use of monopoly power in world oil markets by a few nations that hold the majority of the world's oil resources, reliance on imports and the importance of oil to the US economy. In the past, members of the OPEC cartel have created or capitalized on disrup- tions in the world oil market, reaping hundreds of billions of dollars in monopoly rents from oil-consuming countries. During the past decade, however, the cartel has been less effective. This has led some to conclude that conditions in the world oil market have materially changed and that oil dependence no longer poses the threat it once did (Bohi and Toman, 1993, 1996; Lichtblau, 1994). The bulk of the evidence points to the opposite conclusion, it appears that the only major, objective factor that has changed significantly is the market share of the OPEC cartel, a key determinant of OPEC's power in world oil markets. The growth rate of world oil demand is also slower, and there is some encourag- ing evidence that the price elasticity of ROW oil supply may
2°Of course, in a simulation such as this, the model's equations determine the results. We note, for example, that the value of an SPR would prob- ably be greater if constant-elasticity supply and demand equations were used instead of linear equations in which elasticities increase with increas- ing price. The size of the price shock would also be greater, however.
66 The outlook for US oil dependence: D L Greene et al have increased. The geographical concentration of world oil reserves and trends in world production and consumption indicate that the lost market share will be regained soon. This is supported by recent trends and is consistent with the best efforts to project the future.
OPEC's share of the world oil market is expected to reach historic highs sometime between 2005 and 2010. The future values of elasticities of supply and demand, because they are usually inferred from historical data, are more difficult to assess. However, the most recent studies do not indicate that elasticities have increased significantly over previous levels (eg Dargay and Gately, 1994). In the US and other developed economies, the concentration of oil use in the transportation sector, as other more 'switchable' sectors have substituted other forms o f energy for oil, suggests that demand elastic- ity has not increased. Oil's cost share of US GNP, the key indicator of the impact an oil price shock will have on the US economy, is about the same as it was before the first oil price shock in 1973. Today, US oil imports are within 1% o f their highest level ever, and climbing. OPEC's resolve is more difficult to evaluate, especially for a period 10 years in the future. The simulations presented here, however, suggest that there will be at least opportunity and motive for collusion.
The SPR does not appear to provide an effective defense against a sustained supply curtailment. For a multi-year episode, the effect of the SPR is to postpone the full impact of a sustained cutback in production, to reduce its benefit to OPEC by something like 5°/'o and to mitigate its impact on the US economy by a similar amount. If OPEC is determined to cut production, it can apparently shrug off the SPR releases and then reap the benefits of higher oil prices. Although the SPR could be very effective against a smaller, shorter supply interruption, against a large multi-year supply restriction it appears to offer neither a major disincentive to OPEC nor significant protection to the US economy.
Both the benefit to OPEC and the cost to the US of a sustained oil price increase, however, are quite sensitive to the short- and long-run price elasticities of petroleum demand and supply. If world price elasticities of supply and demand could be doubled by dramatic advances in energy technol- ogy, the estimated value of a 2-year oil price shock to OPEC would be significantly reduced. The estimated cost to the US economy of oil dependence would be cut by almost one-half, saving hundreds of billions of dollars. Even in the base case, OPEC revenues after 2005 would be cut by half, and US economic costs reduced by two-thirds.
Transportation accounts for two-thirds o f petroleum use and 80% o f high-valued light product use in the US, since transportation is 97',/o dependent on oil. Increasing transportation's ability to substitute non-petroleum fuels by increasing the attractiveness o f alternative fuels and vehicles, improving vehicular and system operating effi- ciencies and, at the same time, advancing technologies for oil exploration, development and enhanced recovery could be the only effective strategy against the costs of oil dependence.
Acknowledgements
The authors wish to thank Phil Patterson and Barry McNutt for their interest and support, and colleagues Jerry Hadder and Randy Curlee for their comments on earlier drafts. Any remaining errors are the responsibility of the authors. The views in this paper are those of the authors and do not necessarily reflect those of Oak Ridge National Laboratory or the US Department of Energy.
References
Adelman, M A (1986). Scarcity and world oil prices. Review of Econom- ics and Statistics, 68(3), 387-397.
Adelman, M A (1986). The competitive floor to world oil prices. The Energy Journal, 7(4), 9-31.
Adelman, M A (1986). Oil producing countries discount rates. Resources and Energy, 8(4), 309-329.
Adelman, M A (1989). Mideast governments and the oil price prospect. The Energy Journal, 10(2), 15-24.
Adelman, M A (1990). Mineral depletion with special references to petroleum. Review of Economics and Statistics, 72( 1 ), 1-10. Adelman, M A (1990). The 1990 oil shock is like the others. The Energy
Journal, 11(4), 1-13.
Adelman, M A and Shahi, M (1989) 'Oil-development-operating cost estimates, 1955-1985' Energy Economics 11 (1) 2-10
Adelman, M A and Ward, G L (1980) 'Worldwide production costs' Advances in the Economics of Energy and Resources 3 (I) 17, table 8 Adelman, M A, DeSilva, H, & Koehn, M F (1991). User cost in oil
production. Resources and Energy, 13(3), 217-240,
AI-Chalabi, F J (1988). The world oil market in the 1990s. OPEC Review, 12(3), 227-238.
Al-Chalabi, F J (1988). OPEC and the present structural limitations on its oil price control. OPEC Review, 12(2), 115-122.
Al-Sahlawi, M A (1989). Oil price changes and non-OPEC oil supply: an empirical analysis. OPEC Review, 13(1), 11-20.
Alsmiller, R G, Horwedel, J E, Marshalla, R A, Nesbitt, D M, & Haas, S M (1985). A model of the world oil market with an OPEC cartel. Energy, 10(10), 1089-1102.
Banks, F E (1986). Economic theory and the price of oil. OPEC Review, 10(3), 321-334.
Bohi, D R, & Toman, M A (1993). Energy security: externalities and • policies. Energy Policy, 21(11), 1093-1109.
Bohi, D R and Toman, M A (1996) The Economics of Energy Security Kluwer Academic, Boston
Brown, W M (1987) Petroleum Prices." Past, Present, and Prospective Hudson Institute, Indianapolis, Indiana.
Burgess, D F (1984) 'Energy prices, capital formation, and potential GNP' The Energy Journal5 (2) 1-27
Dahl, C, & Yficel, M (1991). Testing alternative hypotheses of oil producer behavior. The Energy Journal, 12(3), 117-138.
Dargay, J and Gately, D (1994) 'Oil demand in the industrialized countries' The Energy Journal 15 (Special Issue) 39-67
Davis, S J and Haltiwanger, J (1997) 'Sectoral job creation and destruc- tion responses to oil price changes and other shocks' (paper presented at the US Department of Energy Conference) International Energy Security: Economic Vulnerability to Oil Price Shocks Washington DC, October 3~,
Davis, S J, Loungani, P, and Mahidhara, R (1996) 'Regional labor fluctuations: oil shocks, military spending and other driving lbrces' (paper presented at the US Department of Energy Conference) International Energy Security. Economic Vulnerability to Oil Price Shocks Washington DC, October 3-4
Gately, D (1992) The Imperfect Price-Reversibility of World Oil Demand RR # 92-21, C. V. Starr Center for Applied Economics, New York University, New York, NY, May
Gately, D (1995) 'Strategies for OPEC's pricing and output decisions' The Energy Journal 16 (3) 1-38