RESEARCH PAPER
Tracking of fatness during childhood, adolescence and young adulthood:
a 7-year follow-up study in Madeira Island, Portugal
Duarte Freitas
1, Gaston Beunen
†,2, Jose´ Maia
3, Albrecht Claessens
2, Martine Thomis
2, Anto´nio Marques
3,
E´lvio Gouveia
1& Johan Lefevre
21Department of Physical Education and Sports, University of Madeira, Funchal, Portugal,2Department of Biomedical
Kinesiology, Faculty of Kinesiology and Rehabilitation Sciences, Katholieke Universiteit Leuven, Leuven, Belgium, and 3Faculty of Sport, University of Porto, Porto, Portugal
Aims: Investigating tracking of fatness from childhood to adolescence, early adolescence to young adulthood and late adolescence to young adulthood.
Subjects and methods: Participants from the Madeira Growth Study were followed during an average period of 7.2 years. Height, body mass, skin-folds and circumferences were measured, nine health- and performance-related tests were administered and the Baecke questionnaire was used to assess physical activity. Skeletal maturity was estimated using the TW3 method.
Results: The prevalence of overweight plus obesity ranged from 8.2 – 20.0% at baseline and from 20.4 – 40.0% at follow-up, in boys. Corresponding percentages for girls were 10.6 – 12.0% and 13.2 – 18.0%. Inter-age correlations for fatness indicators ranged from 0.43 – 0.77. BMI, waist circumference and sum of skin-folds at 8, 12 and 16-years old were the main predictors of these variables at 15, 19 and 23-years old, respectively. Strength, muscular endurance and aerobic fitness were negatively related to body fatness. Physical activity and maturation were independently associated with adolescent (15 years) and young adult (19 years) fatness.
Conclusions: Over 7.2 years, tracking was moderate-to-high for fatness. Variance was explained by fatness indicators and to a small extent by physical fitness, physical activity and maturation.
Keywords: Inter-age correlations, body fatness, children, adolescents, young adults
INTRODUCTION
Tracking of fatness is defined as the maintenance of a relative rank over a given time span and the ability to discover specific ages or variables where prediction of fatness
becomes reasonable accurate (Foulkes and Davis 1981; Gasser et al. 1995). Recently, the WHO (2011) has stressed that obesity is largely preventable. More precisely, supportive environments and communities are fundamental in shaping people’s choices, making the healthier choice of foods and regular activity the easiest choice (WHO 2011).
The rationale behind this preventive strategy is that the identification of children at risk for adult obesity might lead to an early intervention to prevent adult obesity (Serdula et al. 1993). Body mass index (BMI) is commonly used in epidemiological studies to classify overweight and obesity in children (Cole et al. 2000) and adults. However, BMI may not correspond to the same degree of fatness in different individuals (WHO 2011). In addition to BMI, waist circumference and skin-folds have been widely used as indicators of body fatness (Garn et al. 1986; Katzmarzyk et al. 1999, Guo et al. 2000; Freedman et al. 2005).
Longitudinal studies reviewed by Serdula et al. (1993) have shown that about a third of obese pre-school children were obese as adults and about half of obese school-age children were obese as adults. More recent follow-up data confirmed these findings. In Canadian and American children, adolescents and young adults tracking is fairly high (Katzmarzyk et al. 1999; Freedman et al. 2005). Similar relatively high tracking has been reported for samples studied in Indonesia (Julia et al. 2008), Jamaica (Gaskin and Walker 2003) and in European countries such as Belgium (Matton et al. 2006), Greece (Psarra et al. 2006), Sweden (Ekblom et al. 2009), Switzerland (Gasser et al. 1995) and the UK (Power et al. 1997). To the best of our knowledge, only one study investigated the tracking of body fatness in Portugal (Martins et al. 2010). In this study, a total of 285 children were enrolled in grade 1 (age 6 years) and followed through grade 5 (age 10 years). BMI trajectories showed low
Correspondence: Duarte Luı´s de Freitas, Universidade da Madeira, Departamento de Educac¸a˜o Fı´sica e Desporto, Campus Universita´rio da Penteada, 9000-390 Funchal, Portugal. Tel: þ351 – 291 –705332. Fax: þ351 –291 – 705249. E-mail: [email protected]
(Received 6 July 2011; accepted 1 November 2011)
ISSN 0301-4460 print/ISSN 1464-5033 online DOI: 10.3109/03014460.2011.638322
Ann Hum Biol Downloaded from informahealthcare.com by Universidade Nova De Lisboa on 12/12/11
tracking of BMI-values and physical activity and fitness were not associated with BMI-changes (Martins et al. 2010).
However, the degree of tracking is inconsistent across studies and depends partially on the prevalence of overweight and, among others, differences in study designs, definitions of obesity, ages at which participants were measured, intervals between measurements, length of follow-up and cultural differences (Serdula et al. 1993; Philippaerts et al. 2006). Participants of the Madeira Growth Study (MGS) are relatively healthy with low levels of overweight and obesity. These data will assist in attaining a better understanding of tracking of fatness over time and their correlates using younger birth cohorts, several potential predictors and covering childhood, adolescence and young adulthood periods. Consequently, the aims of this study are (1) to study tracking of BMI, waist circumference and sum of skin-folds from childhood to adolescence, early adolescence to young adulthood and late adolescence to young adulthood, (2) to document the prevalence of overweight and obesity and (3) to verify the adolescent correlates of body fatness.
SUBJECTS AND METHODS
Study design and sampling procedures
The MGS began as a mixed-longitudinal design and evolved to a prospective study. The participants came from five birth cohorts born in 1988, 1986, 1984, 1982 and 1980. At the start of the study in 1996 subjects were aged 8, 10, 12, 14 and 16 years and they were observed at annual intervals in 1997 and in 1998 (Freitas et al. 2002). Subsequently, the same subjects were observed in 2004, when they were, respectively, 15, 17, 19, 21 and 23 years, spanning middle childhood, adolescence and young adulthood.
Participants and data collection
All study protocols were reviewed and approved by the Scientific Board of the University of Madeira and permission was granted from the Regional Secretary of Education and Culture. Participants and/or their parents/guardians signed written informed consent statements.
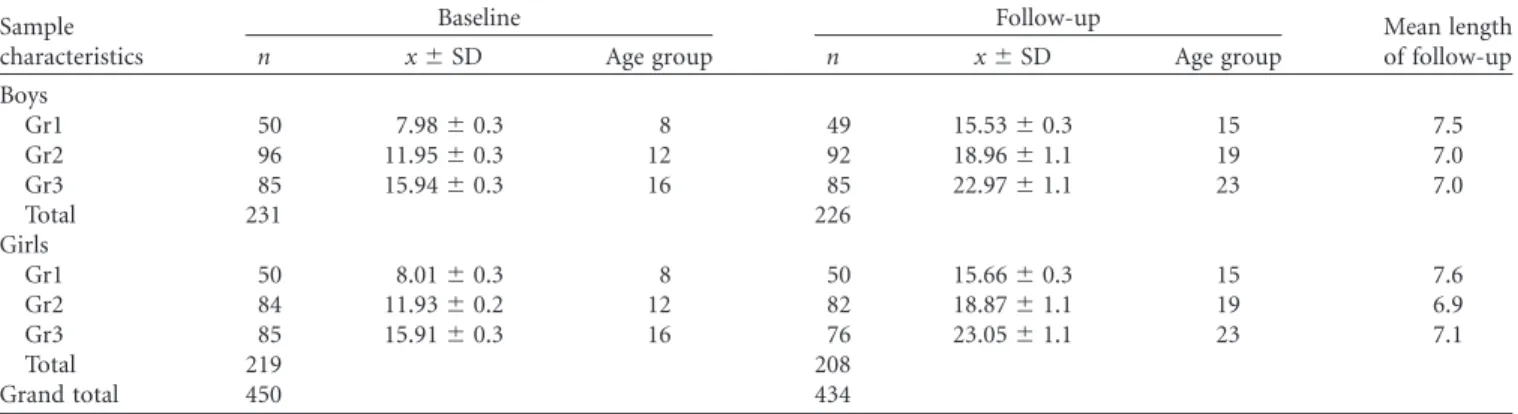
The present analysis is confined to yearly measurements of 450 subjects, 231 boys and 219 girls. Three age groups were considered: group 1 (8 years), group 2 (12 years) and group 3 (16 years). To maximize the sample size in each age group, children from different cohorts were included in the analyses. The average time of follow-up was 7.2 years and ranged from 6 – 9 years. Descriptive data on the number of subjects, the mean chronological age and the mean length of follow-up in the gender and age groups are shown in Table I.
The same protocols were used throughout the study. For quality control, reliabilities of the measurements and tests were verified. All the subjects were measured twice with an interval of 1 week. Intra-class correlation coefficients (R) for the 19 anthropometric dimensions varied between 0.85 – 1.00 and, for the motor tests, between 0.78 – 0.96. Spearman rho correlation coefficients for the three indices of physical activity varied between 0.54 – 0.83.
Measurements
Anthropometry followed standardized procedures described by Claessens et al. (1990). Height was measured with a portable stadiometer (Siber-Hegner, GPM, Zurique, Switzerland) (1st phase; 1996 – 1998) and a Harpenden Stadiometer (Holtain Ltd, Crymych, United Kingdom) (2ndphase; 2004) to the nearest millimetre. Body mass was measured on a balance-beam scale accurate to 100 g (Seca Optima 760, Germany). Skin-fold thickness was measured using a caliper (Siber-Hegner, GPM, Hamburg, Germany) and recorded to the nearest 0.2 mm. Waist circumference was measured with a steel measuring tape (Holtain, UK) accurate to 1 mm.
Intra-observer reliability was also examined during the course of the study. In the 1stphase, 10 subjects (five boys and five girls) were re-measured during the same day, totalling 100 subjects per time of measurement (1996, 1997 and 1998). The reliability was found to be consistent with the results of the pilot study and varied between 0.93 – 1.00. Similar reliability coefficients were found in the 2ndphase (2004) of the MGS. Intra-class correlation coefficients of pairs of measurements (n¼107) varied between 0.99 – 1.00.
Table I. Number of subjects (n), age at baseline (mean and SD), age group (Gr), age at follow-up (mean and standard deviation) and mean length of the follow-up in boys and girls from the Madeira Growth Study.
Sample characteristics
Baseline Follow-up Mean length
of follow-up
n x^SD Age group n x^SD Age group Boys
Gr1 50 7.98^0.3 8 49 15.53^0.3 15 7.5
Gr2 96 11.95^0.3 12 92 18.96^1.1 19 7.0
Gr3 85 15.94^0.3 16 85 22.97^1.1 23 7.0
Total 231 226
Girls
Gr1 50 8.01^0.3 8 50 15.66^0.3 15 7.6
Gr2 84 11.93^0.2 12 82 18.87^1.1 19 6.9
Gr3 85 15.91^0.3 16 76 23.05^1.1 23 7.1
Total 219 208
Grand total 450 434
Ann Hum Biol Downloaded from informahealthcare.com by Universidade Nova De Lisboa on 12/12/11
BMI [calculated by dividing body mass (kg) by height (m2)], the sum of five skin-folds, i.e. triceps, biceps, suprailiac, subscapular and calf skinfolds, and waist circumference are the three obesity-related outcomes used in the present analysis. Children and adolescents were classified as overweight or obese according to the age-and sex-specific BMI cut-off points developed by the International Obesity Task Force (Cole et al. 2000). In 19 and 23 years old, overweight and obesity were defined by the cut-points of, respectively, 25 kg/m2and 30 kg/m2.
Predictors of fatness measures included growth characteristics, physical fitness, physical activity and skeletal maturity. Physical fitness was assessed using the Eurofit test battery (Klissouras et al. 1988), which includes nine motor tests. The endurance shuttle run was replaced by the 12-minute run/walk from the AAHPERD (1988) due to ease of administration to a large number of subjects. Physical activity was assessed by means of a questionnaire developed by Baecke et al. (1982) This questionnaire consists of 16 items and response categories range from 1 – 5, with the exception of the questions 1 (main occupation) and 9 (types of sport played). In children and adolescents, Philippaerts et al. (2006) observed that the intra-class correlation coefficients for two independent reports of sport and leisure time activities were higher than 0.70 and that sport and leisure time activities showed a significant correlation (r.0.50) with the counts of an uniaxial accelerometer. In MGS, the team members filled out the questionnaires by means of a face-to-face interview and children under 10 years of age had the assistance of the teacher or a parent. Information was analysed about physical activity in sports and during leisure-time.
Skeletal age was estimated using the Tanner-Whitehouse method (TW2) (Tanner et al. 1983). Intra- and inter-observer reliability showed an agreement of 91.8% and 81.3%, respectively. A detailed description of the preparation of the research team members is given in Freitas et al. (2002).
Statistical analysis
Means, standard deviations and/or percentages were calculated at baseline and follow-up for growth characteristics, physical fitness, physical activity and skeletal maturity. Pearson product-moment correlation coefficient (r), Spearman’s rank order correlation (r) and intra-class
correlation coefficient (R) were used in the reliability analyses. Tracking of BMI, sum of skin-folds and waist circumference were assessed with inter-age Pearson product-moment correlations between the first and last measurements. Prediction was studied using stepwise multiple linear regression analysis. Zero-order correlations between the fatness indicators, measured at 15, 19 and 23 years and childhood (8 years), early adolescence (12 years) and late adolescence (16 years), biological and environ-mental characteristics were calculated. All analyses were conducted using the SAS version 9.1 (SAS 1990) and a
p-value of 0.05 was selected as the level of significance.
RESULTS
Descriptive statistics
The physical characteristics, physical fitness, physical activity and biological maturity at baseline (8, 12 and 16 years old) and at follow-up (15, 19 and 23 years old) of Madeira boys and girls, a racially-homogeneous (Caucasian) population, are summarized in Table II. In girls, average values for BMI, waist circumference and sum of skin-folds increased with age from 8 to 15 years and levelled off thereafter. In boys the same trends were observed from 8 to 15 years except for sum of skin-folds, which decreased between 12 and 15 years. In males, average fatness indicators further increased between 16 and 23 years. In both sexes, a high variability in sum of skin-folds was observed.
Prevalence of overweight and obesity
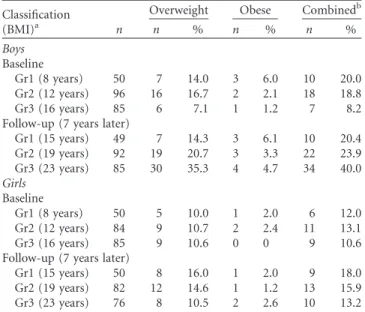
In this sample of pre-adolescent and adolescent youth, the prevalence of overweight and obesity was rather low (Table III). In young adulthood the number of overweight males was considerably higher (20.7% at 19 years and 35% at 23 years). The prevalence of overweight plus obesity (combined) ranged from 8.2 – 20.0% and from 20.4 – 40.0% in boys at baseline and follow-up, respectively. Corresponding percentages for girls were 10.6 – 12.0% (baseline) and 13.2 – 18.0% (follow-up). At all age groups there were more overweight and obese (combined) boys than girls.
Tracking (stability) coefficients
Age- and sex-specific tracking coefficients for height, body mass and the three fatness indicators are reported in Table IV. Both for boys and girls, the tracking for the fatness indicators were generally lower than those observed for height. The coefficients for BMI and waist circumference were of similar magnitude (r¼0.53 – 0.76), whereas those for sum of skin-folds were somewhat lower (r¼0.43 – 0.77). No clear age trends were present, but the coefficients for boys were somewhat higher (r¼0.55 – 0.77) than those for girls (r¼0.43 – 0.76). For waist circumference, BMI and sum of skin-folds, correlation coefficients ranged from 0.55 – 0.77 for boys and from 0.43 – 0.76 for girls.
Multiple linear regression analysis
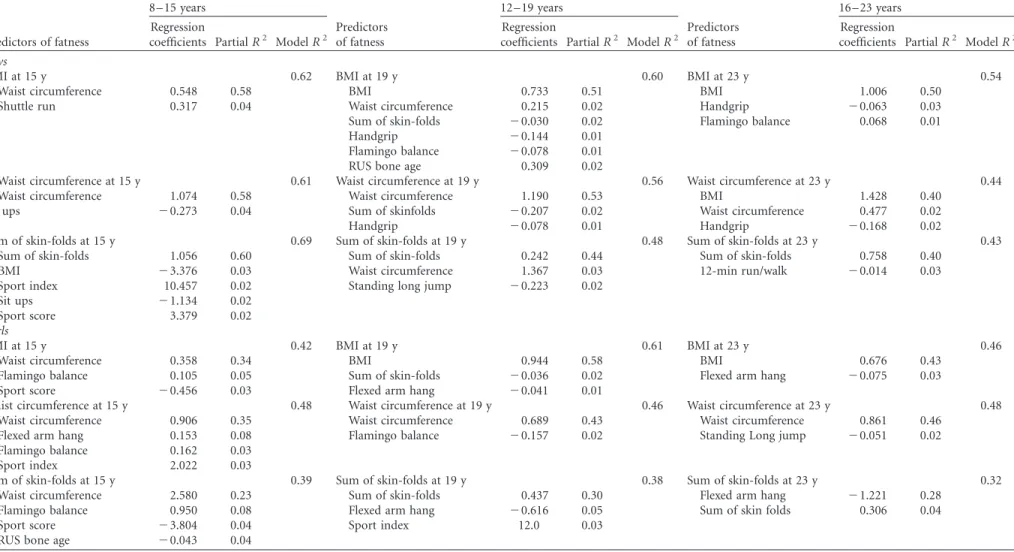
Stepwise multiple linear regression models were used to identify predictors of fatness at 15, 19 and 23 years from physical characteristics, physical fitness, physical activity and biological maturity at 8, 12 and 16 years, respectively (Table V). Separate analyses were performed for boys and girls because of the well-known differences in body composition.
In girls, between 39 – 42% (total R2) of the fatness indicators at 15 years was explained by fatness indicators, motor tests, physical activity and RUS bone age at 8 years. At 19 years, between 38 – 61% of body fatness was explained by fatness indicators, motor tests and physical activity observed at 12 years. In young adults (23 years), between 32 – 48% of the fatness indicators was explained by fatness indicators
Ann Hum Biol Downloaded from informahealthcare.com by Universidade Nova De Lisboa on 12/12/11
and fitness characteristics observed in late adolescence (16 years). With the exception of sum of skin-folds at 23 years, fatness indicators at 15, 19 and 23 years was best explained (partial R2) by waist circumference (23 – 46%), BMI (43 – 58%) and sum of skin-folds (30%) at younger ages. Flamingo balance at 8 and 12 years was a predictor of body fatness at 15 and 19 years. Explained variance was comprised between 2 – 8%. Flexed arm hang at 8 years was a predictor of waist circumference at 15 years (8%). At 12 years, flexed arm hang was a predictor of BMI (1%) and sum of skin-folds (5%) at 19 years. Standing long jump at 16 years explained 2% of waist circumference at 23 years.
The participation in regular sports (sport score) was a predictor of BMI (3%) and sum of skin-folds (4%) at 15 years. A combination of physical activities in regular sports and leisure time (sport index) at 8 and 12 years was a predictor of waist circumference (3%) and sum of skin-folds (3%) at 15 and 19 years, respectively. RUS bone age (4%) at 8 years was a predictor of sum of skin-folds at 15 years. The association of flexed arm hang, standing long jump and sport score was negative, implying that, controlling for the other variables, the more fit and active had lower fatness levels 7 years later.
In boys, between 61 – 69% of the fatness indicators at 15 years was explained by fatness indicators, motor tests
Table II. Physical characteristics, physical fitness, physical activity and biological maturity at baseline (8, 12 and 16 years old) and 7 years later (15, 19 and 23 years old) in boys and girls from the Madeira Growth Study.
Baseline Follow-up
Gr1 (8 years) Gr2 (12 years) Gr3 (16 years) Gr1 (15 years) Gr2 (19 years) Gr3 (23 years) Variables x^SD x^SD x^SD x^SD x^SD x^SD
Boys
Human physical growth
Height (cm) 126.9^5.0 147.9^7.1 171.6^6.9 169.5^7.8 174.1^6.5 174.2^7.1 Body mass (kg) 26.6^4.7 40.5^8.6 61.6^9.5 58.8^10.4 68.5^10.5 73.8^12.7 Waist circumference (cm) 56.6^5.0 63.7^6.6 72.3^5.8 71.3^7.5 77.2^6.9 81.5^8.4 BMI (kg/m2) 16.5^2.4 18.4^2.9 20.8^2.5 20.5^3.6 22.6^3.0 24.3^3.4 Sum of skin-folds (mm) 44.4^26.4 37.5^29.8 47.2^23.2 49.2^29.1 53.1^23.0 62.3^31.8 Physical fitness
Flamingo balance 20.2^6.9 12.5^6.9 10.3^6.0 10.5^5.6 8.7^5.1 8.2^4.9 Plate taping 19.7^3.3 13.9^1.8 11.2^1.6 10.8^1.6 10.3^0.9 9.7^1.1 Sit and reach 20.0^4.2 16.7^5.8 22.9^7.6 20.3^8.0 20.4^7.8 23.0^8.2 Standing long jump 122.3^17.3 152.1^17.4 199.1^21.7 176.7^25.9 187.3^21.7 197.2^22.8 Handgrip 12.2^3.0 22.5^4.5 41.1^7.9 38.7^7.9 46.8^7.1 49.1^7.4 Sit ups 17.1^5.3 20.8^4.0 25.5^3.8 25.7^4.6 25.8^4.4 26.9^4.4 Bent arm hang 8.9^8.7 15.1^14.6 31.7^18.0 22.9^15.7 26.6^15.5 26.2^17.3 Shuttle run 25.1^2.2 23.0^2.6 19.7^1.6 20.3^1.6 19.8^1.5 19.3^1.3 Endurance 1741.7^288.1 2038.2^345.7 2461.7^411.9 2289.7^370.2 2330.0^342.3 2405.3^433.7 Physical activity
Sport score 0.78^1.5 2.43^2.7 2.48^2.9 2.33^3.1 1.73^2.6 1.86^2.6 Sport index 2.57^0.4 2.86^0.4 3.00^0.5 2.90^0.7 2.67^0.6 2.76^0.7 Leisure time index 2.53^0.5 2.78^0.5 2.90^0.5 2.96^0.4 2.63^0.5 2.72^0.6 Biological maturity
RUS (TW2) maturity score 254.4^32.6 420.3^101.6 941.1^107.4
Girls
Human physical growth
Height (cm) 126.1^5.0 148.2^7.1 159.7^5.4 159.3^5.0 161.0^5.5 160.6^5.4 Body mass (kg) 25.6^4.4 40.0^8.9 53.6^7.8 55.1^9.1 56.5^9.0 57.0^8.6 Waist circumference (cm) 56.0^4.3 62.9^6.9 68.2^5.4 68.5^6.4 69.3^6.7 70.3^7.0 BMI (kg/m2) 16.0^2.0 18.1^3.3 21.0^2.5 21.6^3.1 21.8^3.2 22.1^3.1 Sum of skin-folds (mm) 46.0^19.7 54.6^26.0 71.3^22.7 78.3^23.7 77.7^23.8 77.4^25.1 Physical fitness
Flamingo balance 19.3^7.5 12.3^6.7 11.5^6.6 10.4^4.6 9.4^3.7 8.9^4.7 Plate taping 18.9^3.2 13.5^14.2 12.4^2.4 11.5^1.4 10.7^1.1 10.7^1.0 Sit and reach 20.3^5.4 19.8^6.4 25.3^8.0 23.1^8.8 23.6^8.4 25.0^7.7 Standing long jump 113.5^14.5 139.7^19.4 150.5^19.8 142.2^21.1 140.5^20.1 141.0^20.7 Handgrip 11.6^3.2 20.1^4.5 27.8^4.2 27.7^4.9 27.7^4.2 28.5^3.7 Sit ups 16.1^5.1 17.9^4.1 19.3^4.3 20.9^4.8 20.0^4.9 19.0^5.0 Bent arm hang 7.2^10.5 7.2^8.7 8.6^7.2 6.8^6.3 6.9^7.3 8.1^10.2 Shuttle run 25.4^2.2 23.9^2.5 22.4^1.8 22.5^1.9 22.5^1.8 22.8^1.8 Endurance 1649.0^243.5 1847.5^302.5 1944.2^268.4 1795.8^306.3 1858.2^292.9 1780.64^323.4 Physical activity
Sport score 0.60^1.2 1.27^1.9 0.82^2.0 1.36^2.4 0.92^2.0 0.98^2.1 Sport index 2.40^0.5 2.56^0.4 2.51^0.5 2.48^0.6 2.40^0.6 2.31^0.7 Leisure time index 2.38^0.4 2.57^0.4 2.66^0.5 2.66^0.5 2.66^0.5 2.54^0.5 Biological maturity
RUS (TW2) maturity score 383.0^57.5 704.1^115.2 994.2^28.3
Gr, group. Gr1 to Gr3 refer to the cohorts at baseline, i.e. 8, 12 and 16 years and follow-up, respectively, 15, 19 and 23 years.
Ann Hum Biol Downloaded from informahealthcare.com by Universidade Nova De Lisboa on 12/12/11
and physical activity at 8 years. Slightly smaller percentages (48 – 60%) of explained variance were observed at age interval 12 – 19 years. In this age interval, RUS bone age at 12 years was a predictor of BMI at 19 years. In young adults, 23 years, between 43 – 54% of the fatness indicators were best explained by adolescent (16 years) fatness and fitness characteristics. The best predictors of body fatness at 15, 19 and 23 years were waist circumference (53 – 58%), BMI (40 – 51%) and sum of skin-folds (40 – 60%). Around 2– 4% of the variance in BMI, waist circumference and sum of skin-folds at 15 years was explained by the sit ups at 8 years. Handgrip at 12 and 16 years was a significant predictor of BMI (1 – 3%) and waist circumference (1 – 2%) at 19 and 23 years. Flamingo balance at 12 years (1%) and at 16 years (1%) explained the variance in BMI at 19 and 23 years,
respectively. Standing long jump (12 years) and 12-minute walk/run (16 years) explained 2% and 3% of variance in sum of skin-folds at 19 and 23 years, respectively. Sport index and sport score at 8 years explained a small percentage (2%) of the adolescent sum of skin-folds. RUS bone age at 12 years explained 2% of the variance in BMI at 19 years. Again, controlling for fatness indicators the fitness items (sit ups, handgrip, flamingo balance, standing long jump and 12-minute walk run) were negatively associated with adult fatness. Fit subjects at 8, 12 and 16 years had lower body fatness at 15, 19 and 23 years.
DISCUSSION
The increase of fat mass observed in the MGS follow the trends that have been described for other Caucasian populations (Malina et al. 2004). During the growing years, the prevalence of overweight and obesity is rather low compared to other European or North American countries (Ogden et al. 2002; Lobstein et al. 2004). We have no information on the macronutrient composition of the diet or energy intake. However, in European children and adolescents, the energy intake was within the current FAO/WHO/UNU recommendations (Livingstone 2000). Lifestyle factors, such as Physical Education (PE) classes, seem to be favorably associated with fatness indicators. Children and adolescents from an Autonomous Region of Madeira have 3 hours/week of compulsory PE classes and a number participated in sport school competitions. At young adulthood, participants reported to walk ‘sometimes’ during leisure time and walked between 15 – 30 minutes per day to and from work, school and shopping. In males, ,42% (19-years) and 47% (23-years)
reported to participate in organized sports. These percentages are lower in females, 28% and 26%, respectively. The reason for the increase of overweight and obesity in males, at 19 and 23 years old, is not known, but an imbalance between energy intake and energy expenditure occurred in this age group. Young adulthood is a period when individuals move out of home; go to university, start to work and/or start families (Gallagher et al. 2006).
Table IV. Tracking of height and fatness indicators between ages at baseline (8, 12 and 16 years old) and corresponding ages at 7 years later (15, 19 and 23 years old).
Pearson product-moment correlation coefficient (r)
Height and fatness indicators Gr1 (8 and 15 years) Gr2 (12 and 19 years) Gr3 (16 and 23 years)
Boys
Height 0.78 0.70 0.86
Body mass 0.71 0.71 0.76
Waist circumference 0.76 0.72 0.55
BMI 0.71 0.70 0.71
Sum of skin-folds 0.77 0.65 0.64
Girls
Height 0.71 0.64 0.97
Body mass 0.59 0.72 0.70
Waist circumference 0.59 0.66 0.67
BMI 0.53 0.76 0.64
Sum of skinfolds 0.43 0.55 0.48
Gr, group.
Table III. Prevalence (%) of overweight and obese boys and girls at baseline (8, 12 and 16 years old) and 7 years later (15, 19 and 23 years old). Classification
(BMI)a
Overweight Obese Combinedb
n n % n % n %
Boys
Baseline
Gr1 (8 years) 50 7 14.0 3 6.0 10 20.0 Gr2 (12 years) 96 16 16.7 2 2.1 18 18.8 Gr3 (16 years) 85 6 7.1 1 1.2 7 8.2 Follow-up (7 years later)
Gr1 (15 years) 49 7 14.3 3 6.1 10 20.4 Gr2 (19 years) 92 19 20.7 3 3.3 22 23.9 Gr3 (23 years) 85 30 35.3 4 4.7 34 40.0
Girls
Baseline
Gr1 (8 years) 50 5 10.0 1 2.0 6 12.0 Gr2 (12 years) 84 9 10.7 2 2.4 11 13.1 Gr3 (16 years) 85 9 10.6 0 0 9 10.6 Follow-up (7 years later)
Gr1 (15 years) 50 8 16.0 1 2.0 9 18.0 Gr2 (19 years) 82 12 14.6 1 1.2 13 15.9 Gr3 (23 years) 76 8 10.5 2 2.6 10 13.2 Gr, group;aChildren and adolescents were classified as overweight or obese according to the age- and sex-specific BMI cut-off points developed by the International Obesity Task Force (Cole et al. 2000)(q9). In 19 and 23 years old, overweight and obesity were defined by the cut-points of 25 kg/m2and 30 kg/m2, respectively;bPrevalence of overweight plus obesity.
Ann Hum Biol Downloaded from informahealthcare.com by Universidade Nova De Lisboa on 12/12/11
Table V. Multiple linear regression for fatness indicators (BMI, waist circumference and sum of skin-folds) at 15, 19 and 23 years with predictors (independent variables) observed at 8, 12 and 16 years, respectively.
8 –15 years 12 –19 years 16 – 23 years
Predictors of fatness
Regression
coefficients PartialR2 ModelR2
Predictors of fatness
Regression
coefficients PartialR2 ModelR2
Predictors of fatness
Regression
coefficients PartialR2 ModelR2 Boys
BMI at 15 y 0.62 BMI at 19 y 0.60 BMI at 23 y 0.54
Waist circumference 0.548 0.58 BMI 0.733 0.51 BMI 1.006 0.50
Shuttle run 0.317 0.04 Waist circumference 0.215 0.02 Handgrip 20.063 0.03 Sum of skin-folds 20.030 0.02 Flamingo balance 0.068 0.01 Handgrip 20.144 0.01
Flamingo balance 20.078 0.01 RUS bone age 0.309 0.02
Waist circumference at 15 y 0.61 Waist circumference at 19 y 0.56 Waist circumference at 23 y 0.44 Waist circumference 1.074 0.58 Waist circumference 1.190 0.53 BMI 1.428 0.40
Sit ups 20.273 0.04 Sum of skinfolds 20.207 0.02 Waist circumference 0.477 0.02 Handgrip 20.078 0.01 Handgrip 20.168 0.02
Sum of skin-folds at 15 y 0.69 Sum of skin-folds at 19 y 0.48 Sum of skin-folds at 23 y 0.43 Sum of skin-folds 1.056 0.60 Sum of skin-folds 0.242 0.44 Sum of skin-folds 0.758 0.40
BMI 23.376 0.03 Waist circumference 1.367 0.03 12-min run/walk 20.014 0.03 Sport index 10.457 0.02 Standing long jump 20.223 0.02
Sit ups 21.134 0.02 Sport score 3.379 0.02 Girls
BMI at 15 y 0.42 BMI at 19 y 0.61 BMI at 23 y 0.46
Waist circumference 0.358 0.34 BMI 0.944 0.58 BMI 0.676 0.43
Flamingo balance 0.105 0.05 Sum of skin-folds 20.036 0.02 Flexed arm hang 20.075 0.03 Sport score 20.456 0.03 Flexed arm hang 20.041 0.01
Waist circumference at 15 y 0.48 Waist circumference at 19 y 0.46 Waist circumference at 23 y 0.48 Waist circumference 0.906 0.35 Waist circumference 0.689 0.43 Waist circumference 0.861 0.46
Flexed arm hang 0.153 0.08 Flamingo balance 20.157 0.02 Standing Long jump 20.051 0.02 Flamingo balance 0.162 0.03
Sport index 2.022 0.03
Sum of skin-folds at 15 y 0.39 Sum of skin-folds at 19 y 0.38 Sum of skin-folds at 23 y 0.32 Waist circumference 2.580 0.23 Sum of skin-folds 0.437 0.30 Flexed arm hang 21.221 0.28
Flamingo balance 0.950 0.08 Flexed arm hang 20.616 0.05 Sum of skin folds 0.306 0.04 Sport score 23.804 0.04 Sport index 12.0 0.03
RUS bone age 20.043 0.04 y, years.
64
D
.
F
RE
IT
AS
ET
AL
.
A
nnals
of
H
uman
Biolog
This transition and accompanying autonomy seems to interfere with the prevalence of overweight and obesity.
The tracking coefficients for BMI, waist circumference and sum of skin-folds, over a period of 7.2 years, are moderately high and partially confirm those of Canadians (Katzmarzyk et al. 1999). BMI-tracking correlations over a 7-year period in the Canadian population across 7– 29 years varied between 0.50 – 0.90 (0.53 – 0.76 in Madeira’s young-sters). Similarly, the sum of five skin-folds showed significant stability, except in boys of 13 – 14 years of age, in whom correlations approached zero. Tracking was more variable (0.25 – 0.85 in Canadians and 0.55 – 0.76 in Madeira’s youngsters) for waist circumference (Katzmarzyk et al. 1999). Similar tracking coefficients have been reported for Belgians (Beunen et al. 1992; Hulens et al. 2001; Matton et al. 2006), English (Power et al. 1997), Swiss (Gasser et al. 1995) and US-citizens (Casey et al. 1992). In this last study the correlations for females approached zero when longer periods (childhood to 40 or 50 years) were considered. Several authors also demonstrated that children and adolescent who are overweight or obese are at higher risk to become overweight or obese as adults (Serdula et al. 1993; Hulens et al. 2001; Magarey et al. 2003; Freedman et al. 2005; Deshmukh-Taskar et al. 2006; Matton et al. 2006). This could not be studied herein given the low prevalences during the growing period (Table III).
One finding of the present study was that tracking coefficients were somewhat lower for girls than for boys. A possible explanation for this gender difference in tracking is that girls are more likely concerned about their body shape and image than boys (Psarra et al. 2006) and may feel more societal pressure to control their body fatness (Laitinen et al. 2001; Malina et al. 2004).
To understand the stability of body fatness, it is essential to understand the predictors of body fatness (Guo et al. 2000; Nyberg et al. 2009). Our results indicated that the variability of fatness in early adolescence (12 years) and young adulthood (19 and 23 years) was mostly explained by the same fatness indicators observed at younger ages. Given the moderately high tracking coefficients for each of the fatness indicators these results were to be expected. Psarra et al. (2006) found similar results in Greek children. BMI at baseline, parental obesity and low level of fitness were the main predictors of the 2-year tracking of body fatness, and waist circumference at baseline and cardiorespiratory fitness were significant predictors of high waist circumference after 2 years. In line with this previous study, Gaskin and Walker (2003) found that BMI explained 52% and 61% of the variance in fat mass in boys and girls at 7 – 8 years, and that these percentages increased to 69% in both sexes at 11 – 12 years.
In MGS, flamingo balance, handgrip, 12-minute run walk, flexed arm hang, sit ups and standing long jump results were negatively related to body fatness, i.e. controlling for fatness, more fit adolescents had lower adult fatness. It remains unresolved whether this phenomenon is merely regression to the mean or not (Tudor-Locke et al. 2008). Notwithstanding, excess fatness exerts a negative effect on
those items of physical fitness in which the body is maintained in a bent arm position while hanging from a bar, moved or projected. In addition, fatness also has a negative effect on cardiorespiratory fitness (Beunen et al. 1983). A significant negative relationship between aerobic fitness (walking treadmill protocol) and the rate of increasing adiposity was also observed by Johnson et al. (2000) in North-American children, aged between 4.6 – 11.0 years at baseline and followed annually for 3 – 5 years.
Sport during leisure time and physical activity during leisure time excluding sport were independently (controlling for fatness, fitness and biological maturity) associated with adolescent (15 years) and young adult (19 years) fatness, but not with fatness at 23 years. This study used a questionnaire to measure physical activity and it can be speculated that it was not sensitive enough to capture the subject’s physical activity. However, similar results were found using objective measures of physical activity. For example, using accel-erometry, Nyberg et al. (2009) found that physical activity at baseline and physical activity at follow-up did not significantly contribute to the explained variation in BMI at follow-up. In children, Johnson et al. (2000) observed that none of the measures of energy expenditure (assessed with the doubly-labelled water technique) significantly predicted increasing adiposity. Skeletal maturity at 8 and 12 years was an independent predictor of late adolescence (15 years) and young adult (19 years) fatness in MGS. This trend parallels other studies. For example, a Finish study (Laitinen et al. 2001) found that early menarche was a predictor of obesity in adulthood. However, it remains controversial whether this higher risk is already due to their higher levels of fatness at young ages. In Sweden, Kindblom et al. (2006) reported that age at PHV was an independent negative predictor of young adult BMI and whole-body fat mass.
With the exception of flexed arm hang at 16 years, the maximum contribution of motor tests, physical activity and RUS bone age for the total variance in body fatness was 6% and this occurred for sum of skin-folds at 15 years, in boys. In addition, flamingo balance and flexed arm hang were the more stable predictors of body fatness in childhood, adolescence and young adulthood. However, the signal of the regression coefficients for flamingo balance was positive in the age intervals 8 – 15 and 16 – 23 years, but negative in the age interval of 12 – 19 years. Altogether, data from the current study revealed that predictors of body fatness changed over time and that the relative importance of these predictors also changed with age.
The strengths of this study are (1) the relatively healthy sample with low prevalences of overweight and obesity during the growth period, (2) high quality control and negligible loss to follow-up, (3) inclusion of different indicators of fatness, (4) a fairly long period of observation during critical periods of growth and (5) inclusion of fitness, physical activity and skeletal maturity as potential predictors of adult fatness indicators. The limitations are: (1) indirect indicators of fatness, (2) self-reported physical activity and (3) fairly long follow-up (average 7.2 years), but not covering the whole growing period into adulthood.
Ann Hum Biol Downloaded from informahealthcare.com by Universidade Nova De Lisboa on 12/12/11
To conclude, the results of MGS provides evidence that tracking of body fatness is moderate-to-high in three age cohorts and variability in body fatness from adolescence to young adulthood is mostly explained by the same fatness indicators observed at younger ages. Associations of physical activity and skeletal maturity with body fatness were found in childhood and early adolescence. Physical fitness components at younger ages were significantly and negatively related to body fatness 7 years later. Predictors of body fatness changed over time and the relative importance of these predictors also changed with age. This may indicate that activity programmes which include several components of physical fitness should be carried out in children and adolescents in order to contribute to the prevention of body fatness. Furthermore, future research studies need to focus on boys, given the highest increase in fatness in late adolescence and young adulthood.
ACKNOWLEDGEMENTS
The Madeira Growth Study was co-sponsored by the POP-RAM II and III, within the scope of the European Social Funds, via CITMA and the Professional Qualification Centre.
Declaration of Interest:The authors report no conflicts of interest. The authors alone are responsible for the content and writing of the paper.
REFERENCES
AAHPERD. 1988. The AAHPERD Physical Best Program. Reston, VA: American Alliance for Health, Physical Education, Recreation and Dance.
Baecke J, Burema J, Frijters J. 1982. A short questionnaire for the measurement of habitual physical activity in epidemiological studies. Am J Clin Nutr 36:936 – 942.
Beunen G, Lefevre J, Claessens AL, Lysens R, Maes H, Renson R, Simons J, Vanden Eynde B, Vanreusel B, Van Den Bossche C. 1992. Age-specific correlation analysis of longitudinal physical fitness levels in men. Eur J Appl Physiol 64:538 –545.
Beunen G, Malina RM, Ostyn M, Ostyn M, Renson R, Simons J, Van Gerven D. 1983. Fatness, growth and motor fitness of Belgian boys 12 through 20 years of age. Hum Biol 55:599 – 613.
Casey VA, Dwyer JT, Coleman KA, Valadian I. 1992. Body mass index from childhood to middle age: a 50-y follow-up. Am J Clin Nutr 56: 14 –18.
Claessens AL, Vanden Eynde B, Renson R, Van Gerven D. 1990. The description of tests and measurements. In: Simons J, Beunen G, Renson R, Claessens A, Vanreusel B, Lefevre J, editors. Growth and fitness of Flemish girls – The Leuven Growth Study. HKP sport science monograph series. Champaign, IL: Human Kinetics. p 21 – 39.
Cole TM, Billizzi MC, Flegal KM, Dietz WH. 2000. Establishing a standard definition for child overweight and obesity world-wide: international survey. BMJ 320:1240 – 1243.
Deshmukh-Taskar P, Nicklas TA, Morales M, Yang S-J, Zakeri I, Berenson GS. 2006. Tracking of overweight status from childhood to young adulthood: the Bogalusa Heart Study. Eur J Clin Nutr 60: 48 –57.
Ekblom OB, Bak EA, Ekblom B. 2001. Trends in body mass in Swedish adolescents between 2001 and 2007. Acta Paediatr 98:519 – 522.
Foulkes A, Davis CE. 1981. An index of tracking for longitudinal data. Biometrics 37:439 –446.
Freedman DS, Khan LK, Serdula MK, Dietz WH, Srinivasan SR, Berenson GS. 2005. The relation of childhood BMI to adult adiposity: the Bogalusa Heart Study. Pediatrics 115:22 –27. Freitas DL, Maia JA, Beunen GP, Lefevre JA, Claessens AL, Marques AT,
Rodrigues AL, Silva CA, Crespo MT. 2002. Crescimento soma´tico, maturac¸a˜o biolo´gica, aptida˜o fı´sica, actividade fı´sica e estatuto so´cio-econo´mico de crianc¸as e adolescentes madeirenses. O Estudo de Crescimento da Madeira (Portuguese), (Somatic growth, biological maturation, physical fitness, physical activity and socioeconomic status of Madeira children and adolescents. The Madeira Growth Study). Funchal: Universidade da Madeira. Gallagher AM, Robson PJ, Livingstone MB, Cran GW, Strain JJ, Murray
LJ, Savage JM, Boreham CA. 2006. Tracking of energy and nutrient intakes from adolescence to young adulthood: the experiences of the Young Hearts Project, Northern Ireland. Public Health Nutr 9: 1027 – 1034.
Garn SM, LaVelle M, Rosenberg KR, Hawthorne VM. 1986. Maturational timing as a factor in female fatness and obesity. Am J Clin Nutr 43:879 –883.
Gaskin PS, Walker SP. 2003. Obesity in a cohort of black Jamaican children as estimated by BMI and other indices of adiposity. Eur J Clin Nutr 57:420 – 426.
Gasser T, Ziegler P, Seifert B, Molinari L, Largo RH, Prader A. 1995. Prediction of adult skinfolds and body mass from infancy through adolescence. Ann Hum Biol 22:217 –233.
Guo SS, Huang C, Maynard LM, Demerath E, Towne B, Chumlea WC, Siervogel RM. 2000. Body mass index during childhood, adolescence and young adulthood in relation to adult overweight and adiposity: the Fels Longitudinal Study. Int J Obes 24: 1628 – 1635.
Hulens M, Beunen G, Claessens AL, Lefevre J, Thomis M, Philippaerts R, Borms J, Vrijens J, Lysens R, Vansant G. 2001. Trends in BMI among Belgian children, adolescents and adults from 1969 to 1996. Int J Obes 25:395 – 399.
Johnson MS, Figueroa-Colon R, Herd SL, Fields DA, Sun M, Hunter GR, Goran MI. 2000. Aerobic fitness, not energy expenditure, influences subsequent increase in adiposity in blak and white children. Padiatrics 106(4). Available online at: http://www. pediatrics.org/cgi/content/full/106/4/e50, accessed 10 April 2008. Julia M, van Weissenbruch MM, Prawirohartono EP, Surjono A,
Delemarre-van de Waal HA. 2008. Tracking for underweight, overweight and obesity from childhood to adolescence: a 5-year follow-up study in urban Indonesian children. Horm Res 69: 301 – 306.
Katzmarzyk PT, Pe´russe L, Malina RM, Bouchard C. 1999. Seven-year stability of indicators of obesity and adipose tissue distribution in the Canadian population. Am J Clin Nutr 69:1123 – 1129. Kindblom JM, Lorentzon M, Norjavaara EC, Lo¨nn L, Brandberg J,
Angelhed J-E, Hellqvist A, Nilsson S, Ohlsson C. 2006. Pubertal timing is an independent predictor of central adiposity in young adult males. The Gothenburg Osteoporosis and Obesity Determi-nants Study. Diabetes 55:3047 –3052.
Klissouras AC, Ravazzolo M, Renson R, Tuxworth W, Kemper H, van Mechelen W, Hlobil H, Beunen G, Levarlet-Joye H, van Lierde A. 1988. Eurofit. Handbook for the Eurofit Test of Physical Fitness. Rome: Council of Europe. Committee for the Development of Sport.
Laitinen J, Power C, Ja¨rvelin M-R. 2001. Family social class, maternal body mass index, childhood body mass index, and age at menarche as predictors of adult obesity. Am J Clin Nutr 74:287 –294. Livingstone B. 2000. Epidemiology of childhood obesity in Europe. Eur
J Pediatr 159(Suppl 1):S14 –S34.
Lobstein T, Baur L, Uauy R., for the IASO International Obesity TaskForce 2004. Obesity in children and young people: a crisis in public health. Obes Rev 5(Suppl 1):4 – 85.
Ann Hum Biol Downloaded from informahealthcare.com by Universidade Nova De Lisboa on 12/12/11
Magarey AM, Daniels LA, Boulton TJ, Cockington RA. 2003. Predicting obesity in early adulthood from childhood and parental obesity. Int J Obes 27:505 –513.
Malina RM, Bouchard C, Bar-Or O. 2004. Growth, maturation, and physical activity. Champaign, IL: Human Kinetics.
Martins D, Maia J, Seabra A, Garganta R, Lopes V, Katzmarzyk P, Beunen G. 2010. Correlates of changes in BMI of children from the Azores islands. Int J Obes 34:1487 – 1493.
Matton L, Thomis M, Wijndaele K, Duvigneaud N, Gaston B, Claessens AL, Vanreusel B, Philippaerts R, Lefevre J. 2006. Tracking of physical fitness and physical activity from youth to adulthood in females. Med Sci Sports Exerc 38:1114 – 1120.
Nyberg G, Ekelund U, Marcus C. 2009. Physical activity in children measured by accelerometry: stability over time. Scand J Med Sci Sports 19:30 – 35.
Ogden CL, Flegal KM, Carrol MD, Johnson CL. 2002. Prevalence and trends in overweight among US children and adolescents, 1999 – 2000. JAMA 288:1728 –1732.
Philippaerts R, Matton L, Wijndaele K, Balduck A, De Bourdeaudhuij I, Lefevre JA. 2006. Validity of a physical activity computer questionnaire in 12- to 18-year-old boys and girls. Int J Sports Med 27:131 – 136.
Power C, Lake JK, Cole TJ. 1997. Body mass index and height from childhood to adulthood in the 1958 British cohort. Am J Clin Nutr 66:1094 – 1101.
Psarra G, Nassis GP, Sidossis LS. 2006. Short-term predictors of abdominal obesity in children. Eur J Public Health 16: 520 – 525.
SAS Institute. 1990. SAS/STAT User’s Guide. Cary, NC: SAS Institute. Serdula MK, Ivery D, Coates RJ, Freedman DS, Williamson DF, Byers T. 1993. Do obese children become obese adults? A review of the literature. Prev Med 22:167 – 177.
Tanner JM, Whitehouse R, Cameron N, Marshall W, Healy M, Goldstein H. 1983. Assessment of skeletal maturity and prediction of adult height (TW2 Method). Oxford: Academic Press.
Tudor-Locke C, Giles-Corti B, Knuiman M, McCormack G. 2008. Tracking of pedometer-determined physical activity in adults who relocate: results from RESIDE. Int J Behav Nutr Phys Act 5:39. Available online at:http://www.ijbnpa.org/content/5/1/39/, accessed 22 March 2011.
World Health Organization 2011. Media centre. Obesity and overweight, Available online at: http://www.who.int/mediacentre/ factsheets/fs311/en/, accessed 1 April 2011.
Ann Hum Biol Downloaded from informahealthcare.com by Universidade Nova De Lisboa on 12/12/11