1
Universidade Federal de Santa Catarina, Centro de Ciências da Saúde, Programa de Pós-Graduação em Saúde Coletiva. Flo-rianópolis, SC, Brasil.
2
Universidade Federal de Santa Catarina, Centro de Desportos, Programa de Pós-Graduação em Educação Física. Florianópo-lis, SC, Brasil.
3
Universidade Federal de Santa Catarina, Centro de Ciências da Saúde, Programa de Pós-Graduação em Ciências Médicas. Florianópolis, SC, Brasil.
4
Universidade Federal de Santa Catarina, Centro de Ciências da Saúde, Departamento de Ciências da Saúde. Rod. Governador Jorge Lacerda, km 35,4, Jd. das Avenidas, 3201, 8890-6072, Araranguá, SC, Brasil. Correspondência para/Correspondence to: IJC SCHNEIDER. E-mail: <[email protected]>.
Article based on the Project institutional research coordinated by the Dra. Eleonora d’Orsi, financed by the Conselho Nacional de Desenvolvimento Científico e Tecnológico (Process nº 569834/2008-2).
Anthropometric indicators as a screening
tool for sarcopenia in older adults from
Florianópolis, Santa Catarina
:
EpiFloripa Ageing study
Indicadores antropométricos como instrumentos
de triagem para sarcopenia em idosos residentes
em Florianópolis, Santa Catarina
:
estudo EpiFloripa Idoso
Susana Cararo CONFORTIN1
Vandrize MENEGHINI2
Lariane Mortean ONO3
Ione Jayce Ceola SCHNEIDER4
Aline Rodrigues BARBOSA2
Eleonora D’ORSI1
A B S T R A C T
Objective
Methods
The sample consisted of 601 older adults. Sarcopenia was detected by appendicular skeletal muscle index. The receiver operating characteristic curve identified the cutoff points for body mass index, waist-to-height ratio, waist circumference, and handgrip strength to screen for sarcopenia. Based on the cut-off points, principal component analysis determined which indicators had a better fit as discriminants to compose an indicator. Finally, logistic regression analysis was performed with this indicator as the main independent variable.
Results
The results showed that all anthropometric indicators and handgrip strength were capable of discriminating sarcopenia; however, body mass index, waist circumference, and waist-to-height ratio were the best discriminants in principal components analysis, composing the new indicator. Adjusted logistic regression analysis showed that sarcopenia was associated with the indicator in both sexes.
Conclusion
The concomitant presence of low body mass index, low waist circumference, and low waist-to-height ratio may help to discriminate sarcopenia.
Keywords: Aged. Anthropometry. Hand strength. ROC curve. Sarcopenia.
R E S U M O
Objetivo
Este estudo transversal, populacional, teve como objetivo determinar pontos de corte de indicadores antro-pométricos e força de preensão manual para triagem de sarcopenia e verificar a associação entre sarcopenia e estes indicadores.
Métodos
A amostra foi composta por 601 idosos e a sarcopenia foi identificada pelo índice de massa muscular apendicular. A curva Receiver Operating Characteristic identificou os valores de pontos de corte para: índice de massa corporal, razão cintura-estatura, perímetro de cintura e força de preensão manual para triagem da sarcopenia. A partir dos pontos de corte foi realizada análise de componentes principais para definir os que mais se adequaram como discriminantes, compondo um indicador, e realizado análise de regressão logística com este indicador como variável independente principal.
Resultados
Os resultados mostraram que todos os indicadores antropométricos e a força de preensão manual foram considerados discriminadores de sarcopenia, entretanto o índice de massa corporal, o perímetro da cintura e a razão cintura estatura mostram-se como os melhores discriminantes na análise de componentes principais, compondo o novo indicador. A análise de regressão logística (ajustada) mostrou que a sarcopenia foi associada com o indicador em ambos os sexos.
Conclusão
A presença de índice de massa corporal baixo, baixa relação cintura estatura e baixo perímetro da cintura concomitantemente podem auxiliar na discriminação da sarcopenia.
Palavras-chave: Idoso. Antropometria. Força da mão. Curva ROC. Sarcopenia.
I N T R O D U C T I O N
Sarcopenia is characterized by the relative loss of muscle mass. It is considered a multifaceted geriatric syndrome because it often has more than one cause [1]. Muscle involvement may lead to health problems, such as falls [2],
A recent review on the prevalence of sarcopenia in older Brazilians estimated that 12.0% of men and 20.0% of women aged 60 years or more had sarcopenia [6]. Among adults aged 80 years or more, its prevalence is even higher (31.0% and 52.9% in women and men, respectively) [7].
Sarcopenia can be identified by different means, but there is no consensus on the most appropriate method [8,9]. In primary health care, sarcopenia is usually not assessed given the complexity of assessing it, which generally requires a Dual-Energy X-Ray Absorptiometry (DXA) device or Bioelectrical Impedance Analysis (BIA) [10]. Both methods are expensive and hard to access by most individuals who require the diagnosis in the Brazilian health care units and hospitals. Hence, less expensive methods to identify sarcopenia may increase their use as a screening tool, accelerate treatment, direct interventions, and avoid greater complications.
Handgrip strength and anthropometric measurements can be used for diagnosing sarcopenia, but few studies have validated these measurements [10]. These methods are easy to use and inexpensive, allowing them to be widely used. Body Mass Index (BMI) is an indicator often used for identifying underweight in older adults, and it is sensitive to the amount of body muscle mass [7]. The inflammatory characteristics associated with abdominal fat may promote the loss of skeletal muscle mass, increasing susceptibility to sarcopenia [11].
Therefore, the objective of this study was to determine the cut-off points for BMI, Waist-to-Height Ratio (WHR), Waist Circumference (WC), and handgrip strength to screen for sarcopenia and determine the association between sarcopenia and these anthropometric indicators.
M E T H O D S
This is a cross-sectional, population-based study which included older adults aged 60 years
or more who participated in the second wave of the cohort study called EpiFloripa Ageing (Universidade Federal de Santa Catarina [UFSC], Florianópolis, Santa Catarina, Brazil). EpiFloripa Ageing investigated the health conditions of older adults living in the urban area of the municipality of Florianópolis.
The following two-stage sampling strategy was used for selecting the baseline sample: systematic random selection of 80 tracts from the 420 urban census tracts of the municipality, and random selection of the households (units of the second stage). All individuals aged 60 years or more living in the randomly selected households were invited to participate in the study. A total of 1,705 older adults were interviewed in 2009/2010 (baseline), with a response rate of 89.1%. The second wave of the study, conducted in 2013/2014, included 1,488 eligible older adults because 217 had died. All individuals interviewed in 2013/2014 (n=1,197; response rate of 80.6%) were asked to visit the UFSC to undergo clinical and laboratory tests (n=604). Thus, the study sample consisted of older adults who were interviewed at home in 2013/2014, and underwent clinical and laboratory tests. Figure 1 is a flowchart showing the participant selection process.
Sarcopenia was identified by the Appendicular Skeletal Muscle Index (ASMI), determined by DXA (General Electric scanner, Model Lunar Prodigy Advance). ASMI was calculated as recommended by Baumgartner et al. [1], as follows: divide the sum of the lean muscle mass of the four limbs (in kilograms), which corresponds to ASM, by height squared (in meters): [ASMI (kg/m2) = [lean muscle mass
of the upper limbs (kg) + lean muscle mass of the lower limbs (kg)] / height2 (m)].
Sarcopenia was defined as ASMI ≤2 Standard Deviations (SD) of the mean ASMI of a reference population (young adults from the Rosetta Study) by sex, as recommended by Baumgartner et al. [1]. Thus, ASMI (kg/m2)
Body mass index (kg/m2) was calculated
by dividing the body mass (kg) by height (m) squared. Height and weight were measured according to standard procedures [12]. Waist Circumference (WC) in centimeters was measured as recommended by Callaway [13]. Waist-to-height ratio was calculated by dividing WC (cm) by height (cm). Handgrip strength of the self-reported dominant arm was measured by a mechanical dynamometer (Takei Kiki Kogyio®
TK 1201, Nagoya, Japan). The individual was asked to squeeze the dynamometer as hard as possible while sitting upright, letting arms hang freely, and having the palms face the body.
Based on the literature [1], the adjustment variables were: age (60-69 years, 70-79 years, and 80 years or more), smoking status (never smoked, ex-smoker, and current smoker), alcohol intake (does not consume, moderate intake, high intake) investigated by the three questions of the Alcohol Use Disorders Identification Test questionnaire [14]. Regular leisure-time physical activity, investigated by the International Physical Activity Questionnaire [15] long version [no (<150 minutes of leisure-time physical activity per week) and yes (≥150 minutes of leisure-time physical activity per week)], and daily intake of
fruits and vegetables [16] (<5 daily servings and
≥5 daily servings).
In the descriptive analysis, the prevalence of all the variables included in the study was calculated, with their respective 95% Confidence Intervals (95%CI), for the categorical variables, and mean, standard deviation, minimum, and maximum for the continuous variables, stratified by sex.
The best cut-off points for BMI, WC, WHR, and handgrip strength to screen for sarcopenia were estimated by calculating the sensitivity, specificity, positive and negative predictive values, and area under the Receiver Operating Characteristic (ROC) curve. The validity of an indicator to predict sarcopenia increases with ROC curve. The significance level was set at 5% (α=0.05).
Each variable (BMI, WC, WHR, and handgrip strength) was dichotomized at their cut-off points given by the ROC curve, and then principal component analysis identified the variables related to the outcome (sarcopenia). Only one factor with three variables (WHR, BMI, and WC) was generated for each sex. Next, an indicator of sarcopenia was created using
Figure 1. Flowchart of the participant selection process.
EpiFloripa 2009/2010
1,705 participants
52 losses 531 refusals
3 not assessed 159 losses
129 refusals
601 participants
included in the study 1,187 older
adults eligible for the clinical
test EpiFloripa
2013/2014 1,197 participants 1,485 older
adults eligible for the followpup 220 excluded
117 deaths, 2 duplicate, 1 incompatible
the three anthropometric variables (WHR, BMI, and WC) that best confirmed the diagnosis of sarcopenia. Therefore, the indicator requires that the three variables be either above or below their respective cut-off points.
The association between sarcopenia and the three anthropometric variables was verified by crude and adjusted logistic regression analyses, estimating the Odds Ratio (OR) and the 95%CI. Five adjustment models were considered for this association: Model 1: crude analysis; Model 2: model 1 and sex; Model 3: model 2 and age; Model 4: model 3 and physical activity; and Model 5: model 3 and smoking status and
alcohol intake. Only the statistically significant variables in one model would be included in the next model. The significance level was set at 5%.
Descriptive and logistic regression analyses were performed by the software Stata SE 13.0 (Stata Corp., College Station, Texas, United States), and the ROC curve was calculated by the software MedCalc version 16.1. (Mariakerke, East Flanders, Belgium).
The Human Research Ethics Committee of the UFSC approved the project (CAAE nº 16731313.0.0000.0121). All interviewees Signed an Informed Consent Form.
Variables Women Men
n Mean ± SD Min.–Max. n Mean ± SD Min.–Max. Appendicular skeletal
muscle index (kg/m²) 390 6.36 ± 0.87 4.23−9.06 206 7.80 ± 1.00 4.94−11.04 Body mass index (kg/m²) 390 28.60 ± 5.53 16.10−54.60 206 27.15 ± 4.25 18.20−45.70
Waist circumference (cm) 390 92.79 ± 13.19 63.15−141.80 206 98.34 ± 12.09 69.80−137.50
Waist-to-height ratio 390 0.60 ± 0.09 0.41−0.93 206 0.59 ± 0.07 0.43−0.82
Handgrip strength (kgf) 388 19.93 ± 5.46 2.00−34.50 206 29.43 ± 8.60 12.50−57.00
n % 95%CI n % 95%CI
Age group (years)
60 to 69 160 40.48 34.09−47.20 93 45.50 36.58−54.73
70 to 79 169 42.08 35.57−48.87 81 39.51 31.86−47.72
80 or more 61 17.44 13.14−22.79 33 14.98 9.51−22.80
Regular physical activity
No 292 74.88 65.52−84.64 127 61.67 46.61−79.91
Yes 99 25.12 19.84−31.25 80 38.33 30.30−47.05
Alcohol intake
Does not consume 270 69.02 62.54−74.84 76 33.72 25.93−42.50
Moderate 97 24.36 19.19−30.40 64 29.17 22.41−37.00
High 24 6.61 4.01−10.70 67 37.11 28.36−46.80
Smoking status
Never smoked 300 74.71 67.93−80.48 75 31.00 24.51−38.33
Ex-smoker 68 19.66 14.83−25.58 11 58.44 51.26−62.28
Current smoker 23 5.62 3.44−9.08 21 10.56 6.52−16.36
Fruit and vegetable intake
<5 daily servings 308 79.88 75.03−83.99 177 85.36 79.73−89.64
≥5 daily servings 83 20.12 16.01−24.97 30 14.63 10.36−20.27
Table 1. Mean, standard deviation, minimum, maximum, percentage, and confidence interval of the variables analyzed by the study EpiFloripa Ageing. Florianópolis (SC), Brazil (2013/2014).
R E S U L T S
Of the 604 participants who underwent the clinical tests (response rate of 50.38%), 601 were tested for sarcopenia (3 were excluded because of technical limitations), and these 601 individuals were considered the analytical sample of the study. Table 1 shows the mean, standard deviation, minimum, maximum, percentage, and confidence interval of the study variables.
Table 2 describes the ROC curve and the cut-off points for BMI, WC, WHR, and handgrip strength for males and females. Body mass index had the highest percentage under the curve, followed by WHR, WC, and handgrip strength in females. While males, WC had the highest percentage under the curve followed by BMI, handgrip strength, and WHR. In females, BMI had an ROC curve of 0.859 and a cut-off point of 26.2 (95%CI=0.821–0.892) with sensitivity of 74.6% and specificity of 85.7%. In males, WC had an ROC curve of 0.802 (95%CI=0.667– 0.901) with sensitivity of 79.5% and specificity of 66.7% for the best cut-off point (92.0).
Based on Appendicular Skeletal Muscle Index, sarcopenia had prevalence of 16.03% (95%CI=12.71–20.01) and 28.85%
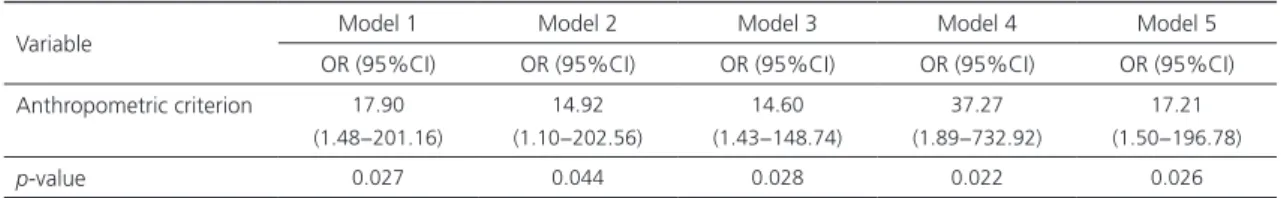
(95%CI=23.05–35.42) in women and men, respectively. Based on the indicator created from the anthropometric variables, sarcopenia had prevalence of 18.49% (95%CI=9.52–32.83) and 36.33% (95%CI=14.85–65.13) in women and men, respectively. Table 3 shows that the indicator (WHR, BMI, and WC) was associated with sarcopenia even when adjusted for sex, age, smoking status, and alcohol intake.
D I S C U S S I O N
This population-based study with older adults from Florianópolis (SC) found prevalence of sarcopenia of 16.03% in women and 28.85% in men. All study markers were considered appropriate to screen for sarcopenia as their sensitivity and specificity values exceeded 60.0%, except WHR, which had a sensitivity of 52.0%. BMI and WC were the indicators best capable of distinguishing between women and men, respectively, with and without sarcopenia. The screening indicator based on three anthropometric variables (WHR, BMI, and WC) was also associated with sarcopenia.
Studies that used the criteria and cut-off points recommended by Baumgartner et al.
Table 2. Area under the Receiver Operating Characteristic (ROC) curve, confidence interval, cut-off point, sensitivity, specificity, positive predictive value, and negative predictive value of the indicators to discriminate sarcopenia in women and men. Florianópolis
(SC), Brazil (2013/2014).
Note: 95%CI: 95% Confidence Interval; kgf: kilogram-force; PPV: Positive Predictive Value; NPV: Negative Predictive Value.
Indicators Area under the ROC
curve (95%CI) Cut-off point Sensitivity Specificity PPV (%) NPV (%)
Women
Body mass index (kg/m²) 0.859 (0.821–0.892) 26.200 74.6 85.7 96.4 39.4
Waist circumference (cm) 0.776 (0.667–0.863) 88.000 65.1 85.7 93.7 33.8
Waist-to-height ratio 0.799 (0.756–0.838) 0.584 66.7 82.5 95.2 32.3
Handgrip strength (kgf) 0.637 (0.587–0.685) 18.500 60.6 60.3 88.9 22.6 Men
Body mass index (kg/m²) 0.797 (0.736–0.850) 24.600 84.9 63.3 84.9 63.3
Waist circumference (cm) 0.802 (0.667–0.901) 92.000 79.5 66.7 78.6 46.8
Waist-to-height ratio 0.709 (0.642–0.770) 0.603 52.1 83.3 88.1 41.2
[1], as did the present study, found prevalences of sarcopenia ranging from 8.9% to 31.0% in women and from 19.0% to 52.9% in men [1,7,17-19]. However, Bijlsma et al. [9] found much lower prevalences than those found in the study population, ranging from 0 to 4.5% in men and from 0 to 3.0% in women. In addition to the diagnostic criteria, differences between the prevalences may be related to sampling differences and sample characteristics. Besides age [20] as a factor that influences the prevalence of sarcopenia, other factors are also related and can be involved in the differences found, such as low level of physical activity, peripheral vascular disease, hormonal influences like low vitamin D, peripheral neuropathy, and weight loss secondary to malabsorption [21]. The study prevalence of sarcopenia based on the screening indicator did not differ significantly from the study prevalence of sarcopenia based on ASMI. Hence, in the present study, when combined, anthropometric measurements were capable of predicting sarcopenia.
Body mass index was considered the best variable to screen for sarcopenia in women and the second best in men. Body mass and body composition influence sarcopenia [22]. Although BMI is not capable of distinguishing between body tissues, older adults with lower BMI were more likely to have sarcopenia than those with higher BMI, corroborating other studies [23-25].
Body mass index cut-off points for older adults are controversial [26]. Nonetheless, the
differences between the BMI cut-off point for overweight identified by the present study and that provided by the Nutrition Screening Initiative, used by the Brazilian Food and Nutrition Surveillance System (>27kg/m2), are small [27].
The study results confirm that BMI is a good variable to screen for sarcopenia, especially in women, and also show the importance of using BMI when screening older adults as it is simple and easy to determine.
Waist circunference is also a good variable to screen men and women for sarcopenia, with cut-off points of ≤92.0cm for men and ≤88.0cm for women. Men and women with low WC were more likely to have sarcopenia. In men this variable was the best predictor of sarcopenia. The cut-off points identified by the present study are similar to those found in the literature [28] as an indicator of risk for metabolic complications. WC is easy to measure and usually used in body composition and central obesity assessments [29]. The present study suggests that WC can be used for identifying older adults with sarcopenia, especially men.
In the present study, WHR too was capable of discriminating sarcopenia satisfactorily. Nevertheless, other studies that used WHR for this purpose were not found, making this the first study to document that WHR is a good variable to screen for sarcopenia. This relationship can be explained as WHR is an anthropometric indicator of abdominal fat and metabolic risk, as well as sarcopenia [11]. As age increases,
Variable Model 1 Model 2 Model 3 Model 4 Model 5
OR (95%CI) OR (95%CI) OR (95%CI) OR (95%CI) OR (95%CI) Anthropometric criterion 17.90
(1.48−201.16)
14.92 (1.10−202.56)
14.60 (1.43−148.74)
37.27 (1.89−732.92)
17.21 (1.50−196.78)
p-value 0.027 0.044 0.028 0.022 0.026
Table 3. Crude and adjusted analysis of the criterion based on anthropometric indicators (body mass index, waist-to-height ratio, and waist circumference) and sarcopenia. Florianópolis (SC), Brazil (2013/2014).
Note: Anthropometric criterion: indicator based on the cut-off points of the following anthropometric indicators: body mass index,
waist-to-height ratio, and waist circumference. Model 1: Crude analysis; Model 2: Model 1 and sex; Model 3: Model 2 and age; Model 4: Model
height decreases, body fat is redistributed, fat-free mass decreases, and muscle mass decreases [30], components of sarcopenia.
Handgrip strength is considered a good indicator of total muscle strength in older adults [31]. It is widely used by epidemiological studies [3,4,25,32] as it predicts poor health and functional limitation [33]. The present study found that handgrip strength is a good predictor of sarcopenia. The study handgrip strength cut-off points (<18.5kgf for women and <26kgf for men) were very close to those proposed by the Foundation for the National Institutes of Health [34] (<16.0kgf for women and <26.0kgf for men) and by the European Consensus [10] (<20.0kgf for women and <30.0kgf for men) as indicators of muscle strength loss. Yet, when associated with anthropometric indicators, it was not related.
Although the screening indicator based on anthropometric variables is itself associated with sarcopenia, BMI, WHR, WC, and handgrip strength in both sexes were also associated with the outcome. These results reinforce the possibility of using these measurements, which, together or individually, are important screening tools, capable of being implemented by primary care as they require relatively easy and inexpensive techniques.
The strengths of the study include the fact that this study tried to estimate the pretest diagnostic properties (sensitivity and specificity) of many indicators with respect to sarcopenia. The indicators may be used by health professionals in clinical practice and by other epidemiological studies that do not have access to DXA. This is also the first study that used WHR for this purpose. Moreover, the study used data from a population-based study of older adults from Florianópolis (SC), using validated instruments and standardized procedures, which enabled comparison with other studies. Investment in indicators with high sensitivity is appropriate when monitoring health with the objective of screening the population.
The limitations include the use of different measurements to identify sarcopenia or its absence by many studies on the subject, which may lead to invalid comparisons, hindering the understanding of the factors involved in the genesis and discrimination of sarcopenia; the restriction that stems from the cross-sectional design, which prevents the making of inferences about the outcome. Additionally, the study of sarcopenia-related complications, such as fractures, hospitalizations, institutionalization, and even death, cannot be omitted; and the third limitation regards the losses associated with clinical tests, which may lead to selection bias: only older adults in better health conditions managed to visit the clinical test site, which may result in an underestimation of the prevalence of sarcopenia. In the present study, muscle strength indicators and motor performance were not considered for the definition of sarcopenia as they were not available for analysis. Furthermore, caution is recommended when using anthropometric indicators and handgrip strength to identify sarcopenia as these measurements were developed with other objectives in mind.
The present study tried to find inexpensive and easy-to-use screening instruments to identify older adults more likely to have sarcopenia. BMI was a good predictor in females, and WC was a good predictor in males. Therefore, the screening indicator may be used in large scale, both by epidemiological studies and clinical practitioners.
C O N T R I B U T O R S
R E F E R E N C E S
1. Baumgartner RN, Koehler KM, Gallagher D, Romero L, Heymsfield SB, Ross RR, et al. Epidemiology of sarcopenia among the elderly in New Mexico. Am J Epidemiol. 1998;147(8):755-63. https://doi. org/10.1093/oxfordjournals.aje.a009520
2. Landi F, Liperoti R, Russo A, Giovannini S, Tosato M, Capoluongo E, et al. Sarcopenia as a risk factor for falls in elderly individuals: Results from the ilSIRENTE study. Clin Nutr. 2012;31(5):652-8. https://doi.org/10.1016/j.clnu.2012.02.007
3. Alexandre TS, Duarte YDO, Santos JF, Wong R, Lebrão M. Sarcopenia according to the European Working Group on Sarcopenia in Older People (EWGSOP) versus dynapenia as a risk factor for disability in the elderly. J Nutr Health Aging. 2014;18(5):547-53. https://doi.org/10.1007/s126 03-013-0424-x
4. Alexandre TdS, Duarte YDO, Santos JF, Wong R, Lebrão M. Sarcopenia according to the European Working Group on Sarcopenia in Older People (EWGSOP) versus dynapenia as a risk factor for mortality in the elderly. J Nutr Health Aging. 2014;18(8):751-6. https://doi.org/10.1007/s1260 3-014-0450-3
5. Inouye SK, Studenski S, Tinetti ME, Kuchel GA. Geriatric syndromes: Clinical, research, and policy implications of a core geriatric concept. J Am Geriatr Soc. 2007;55(5):780-91. https://doi. org/10.1111/j.1532-5415.2007.01156.x
6. Diz JBM, Leopoldino AAO, Moreira BS, Henschke N, Dias RC, Pereira LSM, et al. Prevalence of sarcopenia in older Brazilians: A systematic review and meta-analysis. Geriatr Gerontol Int. 2016. https://doi.org/10.1111/ggi.12720
7. Iannuzzi-Sucich M, Prestwood KM, Kenny AM. Prevalence of sarcopenia and predictors of skeletal muscle mass in healthy, older men and women. J Gerontol A Biol Sci Med Sci. 2002;57(12):M772-7. https://doi.org/10.1093/gerona/57.12.M772
8. Figueiredo C, Domiciano D, Lopes J, Caparbo V, Scazufca M, Bonfá E, et al. Prevalence of sarcopenia and associated risk factors by two diagnostic criteria in community-dwelling older men: The São Paulo Ageing & Health Study (SPAH). Osteoporos Int. 2014;25(2):589-96. https:// doi.org/10.1007/s00198-013-2455-x
9. Bijlsma A, Meskers C, Ling C, Narici M, Kurrle S, Cameron I, et al. Defining sarcopenia: The impact of different diagnostic criteria on the prevalence of sarcopenia in a large middle aged cohort. Age. 2013;35(3):871-81. https://doi.org/10.1007/s1135 7-012-9384-z
10. Cruz-Jentoft AJ, Baeyens JP, Bauer JM, Boirie Y, Cederholm T, Landi F, et al. Sarcopenia: European consensus on definition and diagnosis Report of the European Working Group on Sarcopenia in Older People. Age Ageing. 2010;39(4):412-23. https://doi.org/10.1093/ageing/afq034
11. Kim TN, Park MS, Ryu JY, Choi HY, Hong HC, Yoo HJ, et al. Impact of visceral fat on skeletal muscle mass and vice versa in a prospective cohort study: The Korean Sarcopenic Obesity Study (KSOS). PLoS One. 2014;9(12):e115407. http://dx.doi.org/10. 1371/journal.pone.0115407
12. Chumlea WC, Guo S, Roche A, Steinbaugh M. Prediction of body weight for the nonambulatory elderly from anthropometry. J Am Diet Assoc. 1988;88(5):564-8.
13. Callaway CW, Chumlea WC, Bouchard C, Himes JH, Lohman TG, Martin AD, et al. Circumferences. In: Lohman TG, Roche AF, Martorell R, editors. Anthropometric standardization reference manual. Champaign: Human Kinetics Books; 1988. p.39-54.
14. Lima CT, Freire ACC, Silva APB, Teixeira RM, Farrell M, Prince M. Concurrent and construct validity of the AUDIT in an urban Brazilian sample. Alcohol Alcohol. 2005;40(6):584-9. https://doi. org/10.1093/alcalc/agh202
15. Craig CL, Marshall AL, Sjostrom M, Bauman AE, Booth ML, Ainsworth BE, et al. International physical activity questionnaire: 12-country reliability and validity. Med Sci Sports Exerc. 2003;35(8):1381-95. https:// doi.org/10.1249/01.MSS.0000078924.61453.FB
16. World Health Organization. Global Strategy on diet, physical activity and health. Fifty seventy world health assembly. Geneva: WHO; 2004 [cited 2015 Oct 22]. Available from: http://www.who. int/dietphysicalactivity/strategy/eb11344/en/
17. Dufour AB, Hannan MT, Murabito JM, Kiel DP, McLean RR. Sarcopenia definitions considering body size and fat mass are associated with mobility limitations: The Framingham Study. J Gerontol A Biol Sci Med Sci. 2013;68(2):168-74. https://doi. org/10.1093/gerona/gls109
18. Gillette-Guyonnet S, Nourhashemi F, Lauque S, Grandjean H, Vellas B. Body composition and osteoporosis in elderly women. Gerontology. 2000;46(4):189-93. https://doi.org/10.1159/00002 2158
20. Fielding RA, Vellas B, Evans WJ, Bhasin S, Morley JE, Newman AB, et al. Sarcopenia: An undiagnosed condition in older adults. Current consensus definition: Prevalence, etiology, and consequences. International working group on sarcopenia. J Am Med Dir Assoc. 2011;12(4):249-56. https://doi.org/10. 1016/j.jamda.2011.01.003
21. Morley JE, Anker SD, von Haehling S. Prevalence, incidence, and clinical impact of sarcopenia: Facts, numbers, and epidemiology, update 2014. J Cachexia Sarcopenia Muscle. 2014;5(4):253-9. https://doi.org/10.1007/s13539-014-0161-y
22. Makanae Y, Fujita S. Role of exercise and nutrition in the prevention of sarcopenia. J Nutr Sci Vitaminol. 2015;61(Suppl.):S125-S7. https://doi. org/10.3177/jnsv.61.S125
23. Landi F, Liperoti R, Fusco D, Mastropaolo S, Quattrociocchi D, Proia A, et al. Prevalence and risk factors of sarcopenia among nursing home older residents. J Gerontol A Biol Sci Med Sci. 2012;67(1):48-55. https://doi.org/10.1093/gerona/ glr035
24. Bastiaanse LP, Hilgenkamp TI, Echteld MA, Evenhuis HM. Prevalence and associated factors of sarcopenia in older adults with intellectual disabilities. Res Dev Disabil. 2012;33(6):2004-12. https://doi.org/10.1016/j.ridd.2012.06.002
25. Patel HP, Syddall HE, Jameson K, Robinson S, Denison H, Roberts HC, et al. Prevalence of sarcopenia in community-dwelling older people in the UK using the European Working Group on Sarcopenia in Older People (EWGSOP) definition: Findings from the Hertfordshire Cohort Study (HCS). Age Ageing. 2013;42(3):378-84. https:// doi.org/10.1093/ageing/afs197
26. Lebrão ML, Duarte YA. Saúde, bem-estar e en-velhecimento: o projeto SABE no município de São Paulo: uma abordagem inicial. São Paulo: OPAS; 2003.
27. Ministério da Saúde (Brasil). Protocolos do Sistema de Vigilância Alimentar e Nutricional (SISVAN) na
assistência à saúde. Brasília: Ministério da Saúde; 2008.
28. World Health Organization. Obesity: Preventing and managing the global epidemic. Geneva: World Health Organization; 2000.
29. Park SH, Park JH, Park HY, Jang HJ, Kim HK, Park J, et al. Additional role of sarcopenia to waist circumference in predicting the odds of metabolic syndrome. Clin Nutr. 2014;33(4):668-72. https:// doi.org/10.1016/j.clnu.2013.08.008
30. Barbosa AR, Zeni LAZR, Kazapi IAM. Anthropometric indices and nutritional assessments in the elderly: Brazilian perspectives. Handbook of Anthropometry. New York: Springer; 2012. p.1509-26.
31. Garcia PA, Dias JM, Dias RC, Santos P, Zampa CC. Estudo da relação entre função muscular, mobilidade funcional e nível de atividade física em idosos comunitários. Rev Bras Fisioter. 2011;15(1):15-22. https://doi.org/10.1590/S1413-3 5552011000100005
32. Confortin SC, Barbosa AR. Factors associated with muscle strength among rural community-dwelling older women in Southern Brazil. J Geriatr Phys Ther. 2015;38(4):162-8. https://doi.org/10.1519/ JPT.0000000000000027
33. Koster A, Ding J, Stenholm S, Caserotti P, Houston DK, Nicklas BJ, et al. Does the amount of fat mass predict age-related loss of lean mass, muscle strength, and muscle quality in older adults? J Gerontol A Biol Sci Med Sci. 2011;66(8):888-95. https://doi.org/10.1093/gerona/glr070
34. Studenski SA, Peters KW, Alley DE, Cawthon PM, McLean RR, Harris TB, et al.The FNIH sarcopenia project: Rationale, study description, conference recommendations, and final estimates. J Gerontol A Biol Sci Med Sci. 2014;69(5):547-58. http://dx. doi.org/10.1093/gerona/glu010