AR
TICLE
1 Dirección de Investigación y Evaluación, Instituto para la Atención y Prevención de las Adicciones en la Ciudad de México. Av. Río Mixcoac 234, Acacias. 03240 Ciudad de México DF México. [email protected]
Years of Life Lost (YLL) attributable to alcohol consumption
in Mexico City
Abstract The aim of this study was to estimate the YLL attributable to alcohol consumption in Mexico City from 2006 – 2012. Vital statistics on mortality attributable to alcohol consumption from the INEGI (Instituto Nacional de Estadística y Geografía) were used to determine YLL as well as the average age of death in relation to differ-ent age ranges by sex. A total estimate of 168,607 YLL was obtained, with an average loss of 18.32 years being observed for men and 17.54 years for women. Men accounted for a higher proportion of the YLL than women. According to the ICD-10 (Tenth Revision of International Classification of Diseases), liver disease attributable to alcohol consumption was found to be responsible for more than 80% of the total YLL. There was a cyclical trend in YLL from 2006 to 2012. The YLL attrib-utable to alcohol suggest that alcohol consump-tion is a public health problem that involves losses in productivity and economic costs, and the de-cline in YLL could be explained by the decrease in income caused by the economic crisis of 2008, just as the increase could be explained by economic improvement in 2012.
Key words Years of life lost, Alcohol
consump-tion, Cost of illness, Mortality
Eduardo Pérez-Pérez 1
Leonardo Cruz-López 1
Norberto Francisco Hernández-Llanes 1
Andrea Gallegos-Cari 1
Rafael Edgardo Camacho-Solís 1
Pér
ez-Pér Introduction
According to data from the World Health Or-ganization (WHO)1, alcohol consumption is a
causal factor in 60 different diseases at a global level, including liver cirrhosis, cardiovascular problems and polyneuritis, among others. It is also the direct cause of accidents and injuries, such as car accidents, falls and violence, and it is responsible for approximately 4% of all deaths worldwide, a figure that is higher than the deaths due to the human immunodeficiency virus (HIV / AIDS) or tuberculosis. International agencies have reported a relationship between alcohol consumption and losses in productivity (such as employee turnover due to premature death) as well as high economic costs2 that impact
fami-lies, society and government. In 2000 alone, alco-hol consumption in the Americas was the main risk factor for disease burden, corresponding to 13,883,000 disability-adjusted life years (DALYs), equivalent to 9.7% of all DALYs in the region3. In
Mexico, alcohol consumption is considered the fourth leading cause of mortality in the coun-try4. Furthermore, alcohol consumption
gener-ates the gregener-atest health problems compared with other drugs. According to the National Survey of Addictions (Encuesta Nacional de Adicciones - ENA)5 performed in Mexico in 2011, the
prob-lems caused by alcohol consumption increased greatly because the percentage of dependence in the total population (12 to 65 years old) in-creased from 4.1% in 2002 to 6.2% in 2011, and the percentage of risky consumption was 32.8% during the same period. Additionally, nearly 27 million Mexicans (32.8%) drink with a risky pat-tern of consumption (five drinks or more on a single occasion for men and four drinks or more for women)6, a situation that further worsens the
problem .
Mexico City is Mexico’s second most populat-ed state and the world’s second most populatpopulat-ed city (with more than eight million inhabitants), accounting for 7.87% of the country’s popula-tion7. The prevalence of alcohol consumption
in the last year in Mexico City was 52.8%, while that of alcohol dependence was 4.4%5. Given the
geographic, social, cultural and migratory condi-tions that exist in Mexico City, the assessment of Years of Lives Lost (YLL) is important for under-standing the dynamics of public health related to alcohol consumption in our country.
YLL is defined as the number of deaths multi-plied by the standard life expectancy8. Thus, YLL
is a measure of years lost associated with each
death at a given age9 compared with the years
that one should have lived, based on the argu-ment that all countries should have this standard life expectancy10. The estimation of YLL allows us
to better analyze the health conditions in a pop-ulation and provides a basis for cost-effectiveness analysis11. Additionally, as a measure used for
the evaluation of health policies and programs, it gives weights to certain quality of life charac-teristics 12.
Therefore, the aim of this study was to es-timate the YLL for diseases that are directly at-tributable to alcohol13,14,which according to the
Tenth Revision of the International Classifica-tion of Diseases by the WHO (ICD-10) 15, are
those diseases in which alcohol consumption inevitably contributes to the development of the disease16. This analysis seeks to understand the
dynamics of the effects of alcohol consumption in our country in the period between 2006 and 2012.
Methods
Sources of Information
This article is a secondary analysis of mortal-ity records obtained from civil death records in the Mexican Republic, which represent a direct estimate of mortality. These data are published annually by the National Institute of Statistics, Geography and Informatics (Instituto Nacional de Estadística y Geografía - INEGI)17. The data
corresponding to Mexico City between 2006 and 2012 were analyzed. The records were divided by sex, age and the detailed cause of death15
(ICD-10). For the analysis, the following causes of death directly attributable to alcohol were con-sidered:
e C
ole
tiv
a,
21(1):37-44,
2016
Alcoholic fatty liver; (K701) Alcoholic hepatitis; (K702) Liver fibrosis and cirrhosis/alcoholic; (K703) Alcoholic liver cirrhosis; (K704) Alco-holic liver failure; (K709) AlcoAlco-holic liver disease/ unspecified; (G312) Degeneration of the nervous system due to alcohol; (I426) Alcoholic cardio-myopathy; (K292) Alcoholic gastritis; (K852) Alcohol-induced acute pancreatitis; and (K860) Alcohol-induced chronic pancreatitis.
Data Analysis
As in Dávila et al.18, records that were
un-specified in terms of age and sex were eliminated from the analysis, as were deaths occurring out-side the region. The studied sample was grouped into intervals of five years (from 0 to 84 years, leaving open the interval between 85 years and the last age of living individuals) and by sex. The mean age of death was obtained for each interval.
To estimate YLL, the methodology proposed by Velázquez-Valdivia10 was used, applying the
following formula:
ILLa = ∫ Cxe -Bx e –r (x – a) dx
The solution of this integral is given by19:
ILL= KC e ra [e -(r+β) (L+a) [- (r+β)(L+a) -1]-
e-(r+β) a[- (r+β)a-1]]+ 1 - k (1-e -rL)
This solution was obtained in Microsoft Ex-cel20, using the following parameters:
a: age at death
β: age weighting parameter (β = .04) C: age weighting fit with constant (C = .1658) r: discount rate (r = 3%)
L: standard life expectancy related to age at death, where the average values are compared with the West 2621 standard life expectancy.
In vital statistics, coverage error commonly refers to systematic underreporting. In Mexico, according to ECLAC (Economic Commission for Latin America and the Caribbean)22, the coverage
of vital statistics in Mexico has undergone sub-stantial improvements, as in 1970-1975, the rela-tive difference between estimated deaths and re-corded deaths was 91.5, while in 2000-2005, this difference was barely 4.7. Additionally, for 2009, ECLAC estimated the occurrence of recorded deaths with poorly defined causes to be approx-imately 2%, and the estimated underreporting by PAHO (Pan American Health Organization)/
WHO23 was approximately 0.5%. Therefore,
giv-en that this study is based on the analysis of vital statistics, the authors did not consider it neces-sary to correct for underreporting.
Results
For the study period, a total of 9,233 deaths di-rectly attributable to alcohol consumption were recorded, with a high prevalence of the problem being observed among males, which accounted for 8,451 (91.5%) deaths, while the female sex only accounted for 782 (8.5%) deaths. Compar-ing deaths directly attributable to alcohol con-sumption in relation to the total recorded deaths in Mexico City, we found that, in males, the for-mer category accounted for an average of 3.9% of all deaths between 2006 and 2012; in contrast, the percentage of deaths attributable to alcohol con-sumption in females was not higher than 0.4%. Comparisons by year are shown in Table 1.
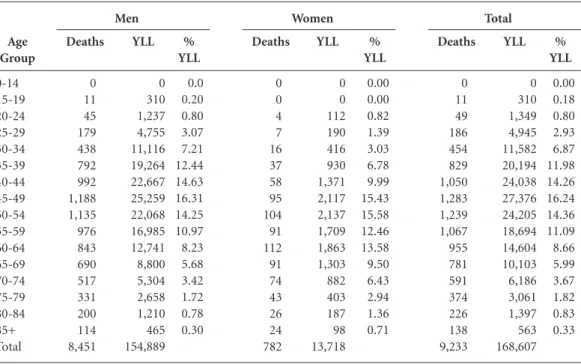
In Table 2, we can see that when the pattern of YLL is analyzed by gender, it exhibits an ear-ly peak in males, indicating that it begins in the age 15 to 19 group and reaches its maximum in the age 45 to 49 group. In women, the peak starts from age 20 to 24 and reaches its maximum point between age 50 and 54. We also found that alco-hol consumption was related to an average loss of years per person of 18.32 for men and of 17.54 for women.
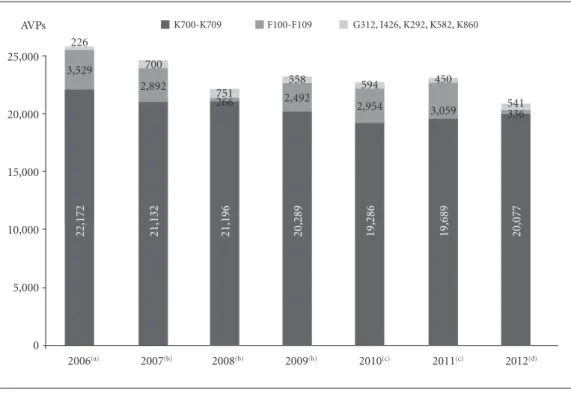
In the comparison of YLL according to the cause of death, it could be observed that degen-eration of the nervous system due to alcohol, alcoholic cardiomyopathy, alcoholic gastritis, al-cohol-induced acute pancreatitis and alcohol-in-duced chronic pancreatitis (G312, I426, K292, K852, K860. ICD-10) contributed fewer years to the total (with 2008 being the year in which the greatest number of YLL was recorded and 2006 being the year with the least YLL), while liver dis-eases (K700 – K709. ICD-10) accounted for the vast majority of YLL [with 2010 being the year with the fewest YLL and 2006 being the year with the greatest number of YLL (Graphic 1)].
Finally, Graphic 2 shows the total annual YLL directly associated with alcohol consump-tion, revealing a downward trend equating to a decrease of 11.92% in 2010 compared with 2006, followed by an increase of 5.01% from 2010 to 2012. The observed trend in annual YLL is best described by a sine function given by y = 24463.0434+1488.3396 sin (0.6481x + 2.6325), with a very good fit (R= 0.9459).
(r + β)2
Pér
ez-Pér
Discussion
YLL is an important health parameter that allows us to define the state of a population’s health and obtain information about temporary changes in premature mortality and differences in mortality attributable to various subpopulations, in
addi-tion to helping to evaluate the effectiveness of interventions24. YLL is a measure that allows us
to determine how many more years people who have died as a result of alcohol consumption25
should have lived.
In Mexico City, among the 9,233 deaths di-rectly related to alcohol consumption during the Year 2006 2007 2008 2009 2010 2011 2012 Total
Table 1. Comparison of overall mortality and mortality directly attributable to alcohol in Mexico City, 2006-2012. Overall 28,818 29,495 30,304 30,672 31,925 31,405 32,779 215,398 Mortality directly attributable to alcohol 1,310 1,230 1,234 1,186 1,137 1,152 1,202 8,451 Percentage 4.5% 4.2% 4.1% 3.9% 3.6% 3.7% 3.7% 3.9% Overall 27,572 28,187 29,144 29,596 30,064 29,300 30,295 204,158 Mortality directly attributable to alcohol 109 124 123 98 104 113 111 782 Percentage 0.40% 0.44% 0.42% 0.33% 0.35% 0.39% 0.37% 0.38% Men Women Deaths Age Group 0-14 15-19 20-24 25-29 30-34 35-39 40-44 45-49 50-54 55-59 60-64 65-69 70-74 75-79 80-84 85+ Total
e C
ole
tiv
a,
21(1):37-44,
2016
study period, a total of 168,607 YLL were deter-mined, with an average loss of 18.32 years for men and 17.54 years for women. The age 45 to 49 group accounted for the most YLL, which could be related to the cumulative effect of alcohol con-sumption. It was also observed that liver diseases
accounted for the greatest number of YLL among the total and that, within the study period, there was a downward trend in the number of YLL from 2006 to 2010, followed by an increase in 2011 and 2012.
We also observed differences in YLL between men and women. When we compared the tality attributable to alcohol versus overall mor-tality, we found that in the men, the former cate-gory was responsible for 3.9% of deaths, while in women, it was responsible for 0.38%. This differ-ence corresponds to the fact that in Mexico, men tend to consume alcohol more frequently and in greater quantities. Nevertheless, in recent years, alcohol consumption in women has risen glob-ally in an ongoing manner, increasingly closing the gap in differences in alcohol consumption between men and women26. In the population of
12- to 65-year-olds in Mexico, 62.6% of women consumed alcohol at some point in their lives; 19.3% of women consumed alcohol with a pat-tern of risk (four drinks or more on a single oc-casion); and 1.8% of women showed symptoms of alcohol dependence5. This speaks to the need
Graphic 1. YLL due to alcohol consumption according to the ICD-10, 2006-2012.
(a) No deaths for K582, K860. (b) No deaths for K292. (c) No deaths for I426. (d) No deaths for I426, K292.
2006(a) 2007(b) 2008(b) 2009(b) 2010(c) 2011(c) 2012(d) 0
5,000 10,000 15,000 20,000 25,000
22,172 21,132 21,196 20,289 19,286 19,689 20,077
3,529
2,892
266 2,492 2,954
3,059 336
226
700
751
558 594 450
541 G312, I426, K292, K582, K860 K700-K709 F100-F109
Graphic 2. Annual YLL associated with alcohol consumption, 2006 – 2012.
2006 2007 2008 2009 2010 2011 2012 2013 22500
23000 23500 24000 24500 25000 25500 26000
Pér
ez-Pér to develop comprehensive prevention and treat-ment strategies directed toward women.
One limitation of this study was that using the data available from official sources, it was not possible to calculate DALYs related to alcohol con-sumption in Mexico City. This information was of particular interest because many of the diseases attributable to alcohol are not fatal27. Another
limitation was that there were no available data on mortality attributable to alcohol for Mexico. Having this information would have allowed us to better approximate the magnitude of the problem, as YLL associated with deaths that are not directly related to alcohol, such as traffic accidents, vio-lence or suicides28, could have been estimated.
One question that arises from this study is re-lated to the cyclical trend of annual YLL, which could be explained by the crisis suffered by the Mexican economy in 2009 as well as the recovery between 2010 and 2012. A clear example of this scenario is provided by the decrease in the con-sumption of alcoholic beverages within the home in 2008 and 2010 compared with 2006, according to the National Household Income and Expen-diture Survey29. This study again shows a higher
prevalence of alcohol consumption by men, even though recent data3 suggest that this difference
could decrease due to new trends of consumption (last month) among female adolescents. We em-phasize the need to conduct longitudinal studies that allow us to understand the relationship be-tween income and diseases such as liver cirrhosis. For example, a study by Bajaj et al.30 showed that
income level is related to overall health according to variables such as quality of life and access to medical services and treatment. It is also import-ant to establish the pathophysiological role of al-cohol in the development of these diseases. For example, scientific evidence shows that the effect of excessive alcohol consumption exhibits a caus-al relationship with liver cirrhosis through three mechanisms31: the production of acetaldehyde,
the production of free radicals and the depletion of antioxidants.
e C
ole
tiv
a,
21(1):37-44,
2016
Collaborations
E Pérez-Pérez participated in the data collection, data analysis and preparation of the manuscript. EL Cruz-López and NF Hernández-Llanes par-ticipated in the data analysis and interpretation of the results. A Gallegos-Cari participated in the interpretation of the results and preparation of the manuscript. RE Camacho-Solís participated in the preparation of the manuscript. MA Men-doza-Meléndez participated in the study design, interpretation of the results, preparation of the manuscript and data analysis.
References
Organización Mundial de la Salud (OMS). Global sta-tus report on alcohol and health. Ginebra: OMS; 2011. Organización Internacional del Trabajo (OIT). Tra-tamiento de cuestiones relacionadas con el alcohol y las drogas en el lugar de trabajo. Ginebra: OIT; 1996. Rehm J, Monteiro M. Alcohol consumption and bur-den of disease in the Americas: implications for alcohol policy. Rev Panam Salud Pública 2005; 18(4/5):241-248. Medina-Mora ME. ¿Cuál es la naturaleza del problema que estamos enfrentando? In: Medina-Mora ME. Alco-hol y Políticas Públicas. México: El Colegio Nacional; 2012: p. 3-17.
Medina-Mora ME, Villatoro-Velázquez JA, Fleiz-Bau-tista C, Téllez-Rojo MM, Mendoza-Alvarado LR, Ro-mero-Martínez M, Gutiérrez-Reyes JP, Castro-Tinoco M, Hernández-Avila M, Tena-Tamayo C, Alvear Sevi-lla C, Guisa-Cruz V. Encuesta Nacional de Adicciones 2011: Reporte de Alcohol. México: INPRF; 2012. [Cited 2014 Feb 10]. Available from: http://www.conadic.sa-lud.gob.mx/pdfs/ENA_2011_ALCOHOL.pdf Consejo Nacional Contra las Adicciones (CONADIC), Instituto Nacional de Psiquiatría Ramón de la Fuente Muñiz (INPRF), Instituto Nacional de Salud Pública (INSP), Secretaría de Salud (SS) y Fundación Gonzalo Río-Arronte. Encuesta Nacional de Adicciones 2008. Mé-xico: INSP; 2009. [cited 2014 Feb 15]. Available from: http://www.conadic.salud.gob.mx/pdfs/ena08/ENA 08_NACIONAL.pdf
Instituto Nacional de Estadística y Geografía (INEGI). Censo de Población y Vivienda 2010 [Internet]. Méxi-co: 2011. [cited 2014 Aug 19]. Available from: http:// www.censo2010.org.mx
World Health Organization. Health statistics and infor-mation. Systems Metrics: Disability-Adjusted Life Year (DALY) [Internet]. [cited 2015 Apr 15]. Available from: http://www.who.int/healthinfo/global_burden_dis-ease/metrics_daly/en/#
Seuc AH, Domínguez E, Díaz O. Introducción a los DALYs. Rev Cubana Hig Epidemiol 2000; 38(2):92-101. Velázquez-Valdivia A. Guía Metodológica para las Esti-maciones Epidemiológicas del Estudio de Carga de En-fermedad. Promoviendo alianzas y estrategias. Lima: Abt Associates Inc; 2006.
Medina-Mora ME, Garcia-Tellez I, Cortina D, Oroz-co R, Robles R, Vázquez-Pérez L, Real T, Chisholm D. Estudio de costo-efectividad de intervenciones para prevenir el abuso de alcohol en México. Salud Mental 2010; 33(5):373-378.
Seuc AH, Emma D. Acerca del cálculo de la carga de las enfermedades por morbilidad. Rev Cubana de Hig Epidemiol 2005; 43(3):1-8.
Jones L, Bellis MA. Updating England-Specific Alco-hol-Attributable Fractions. Liverpool: Centre for Public Health Faculty of Education; 2014.
Jones L, Bellis MA, Dedman D. Alcohol- attributable fractions for england. Alcohol- attributable mortality and hospital admissions. Liverpool: Centre for Public Health & North West Public Health Observatory; 2008. Organización Mundial de la Salud. CIE 10. Décima Re-visión de la Clasificación Internacional de Las Enferme-dades. Madrid: Meditor; 1992.
1. 2.
3.
4.
5.
6.
7.
8.
9. 10.
11.
12.
13.
14.
Pér
ez-Pér National Services Scotland. Alcohol attributable mor-tality and morbidity: alcohol population attributable fractions for Scotland. Edinburgh: ISD Scotland Publi-cations Information Services Division, NHS National Services Scotland; 2009.
Instituto Nacional de Estadística y Geografía (INEGI). Estadísticas de mortalidad general [Internet]. México: 2014 [cited 2014 Aug 19]. Available from: http://www. inegi.org.mx/
Dávila CA, Agudelo M, Gloria LE. Diabetes en México y Colombia: Análisis de la tendencia de años de vida perdidos, 1998-2007. Rev Salud Pública 2011; 13(4): 560-571.
Prüss-Üstün A, Mathers C, Corvalán C y Woodward A. Introduction and methods: assessing the environmental burden of disease at national and local levels. Ginebra: World Health Organization, 2003. (WHO Environ-mental Burden of Disease Series, No. 1).
Murray CJL. Quantifying the burden of disease: the technical basis for disability-adjusted life years. WHO Bulletin 1994; 72(3):429-445.
Valdez-Huarcaya W y Miranda-Monzón J. Carga de en-fermedad en el marco de la implementación de los pilotos de aseguramiento universal en salud Regiones de Apu-rímac, Ayacucho y Huancavelica 2009. Lima: SINCO Editores; 2010.
NU, CEPAL, CELADE, Fondo de Población de las Naciones Unidas. Los datos demográficos Alcances, limitaciones y métodos de evaluación. Serie Manua-les. Santiago de Chile, Chile, 2014. [cited 2014 Jul 17]. Available from: http://repositorio.cepal.org/bitstream/ handle/11362/37145/S1420555_es.pdf?sequence=1 Organización Panamericana de la Salud (OPS), Orga-nización Mundial de la Salud (OMS), Información y Análisis de Salud (HSD/HA). Situación de Salud en las Américas: Indicadores Básicos 2012. Washington: OPS, OMS, HSD/HA; 2012.
Del Valle-Gómez MO, López-González ML, Ar-cos-González PI, Cueto-Espinar A. Análisis de los años potenciales de vida perdidos por cáncer en Asturias y España. Rev San Hig Púb 1993; 67(2):129-144. Arriaga EE. Los años de vida perdidos: Su utilización para medir el nivel y cambio en la mortalidad. Wash-ington: US Census Bureau, 2000. [cited 2014 Jul 20]. Available from: http://www.cepal.org/publicaciones/ xml/0/34410/lcg165_p1.pdf
16.
17.
18.
19.
20.
21.
22.
23.
24.
25.
Grucza RA, Bucholz KK, Rice JP y Bierut LJ. Secular Trends in the Lifetime Prevalence of Alcohol Depen-dence in the United States: A Re-Evaluation. Alcohol Clin Exp Res 2008; 32(5):763-770.
Babor T, Caetano R, Casswell S, Edwards G, Giesbrecht N, Graham K, Grube J, Hill L, Holder H, Homel R, Li-vingston M, Österberg E, Rehm J, Room R, Rossow I. El alcohol: un producto de consumo no ordinario. Inves-tigación y políticas públicas. Washington: Organización Panamericana de la Salud; 2010.
Organización Mundial de la Salud (OMS). Estrategia mundial para reducir el uso nocivo del alcohol. Ginebra: OMS; 2010.
Instituto Nacional de Estadística y Geografía. Encues-ta Nacional de Ingresos y Gastos de los Hogares 2006, 2008 y 2010 [Internet]. México: 2014. [cited 2014 Aug 19]. Available from: http://www.inegi.org.mx/ Bajaj JS, Riggio O, Allampati S, Prakash R, Gioia S, Pi-azza N, Noble NA, White MB, Mullen KD. Cognitive dysfunction is associated with poor socioeconom-ic status in patients with cirrhosis: an international multicenter study. Clin Gastroenterol Hepatol 2013; 11(11):1511-1516.
Pontificia Universidad Católica de Chile. Estudio de carga de enfermedad y Carga Atribuible, chile 2007: Anexo 2. Chile: 2008. [cited 2014 Aug 5]. Available from: http://epi.minsal.cl/wp-content/up-loads/2011/08/1.-Anexos-Capitulo-II_Jul08.pdf
Article submitted 05/11/2014 Approved 21/06/2015
Final version submitted 23/06/2015 26.
27.
28.
29.
30.