Meningococcal Disease in Canada, 1921-1979
National Trend
In the period from 1924 to 1979, a total of 13,671 cases of meningococcal disease have been reported in Canada. The yearly notifications by physicians have ranged from 86 (1966) to 1,465 (1941), with an average of 244 cases. Figure 1 shows that there has been no consistent pattern of periodicity, but increased activities are evident at 12-to 16-year intervals. The largest epidemic began in 1938 and peaked in 1941 with 1,465 cases and 206 deaths reported. This epidemic coincided with the Second World War. By 1947, reported incidences attained a level similar to that of the pre-epidemic period. This pat-tern began to change in 1950 when the incidence rose and remained at a higher level until 1958. It then de-clined and in 1965 reached the lowest rate (0.43 per 100,000 population) ever recorded in Canada. Subse-quent to this, after a period of very low endemicity, a wave of increased activity started to appear in 1972. This reached a peak in 1973 with 446 cases (2 per 100,000 population). In 1979, 303 cases were reported.
Age and Sex Distribution
Meningococcal disease is a serious infection in children especially in the first year of life and results in
Figure 1. Reported Incidence of Meningococcal Disease in Canada, 1924-1979.
z o J QD
O
0
o
o
o-o o
w o-r,
w
10-8
-6
4
2
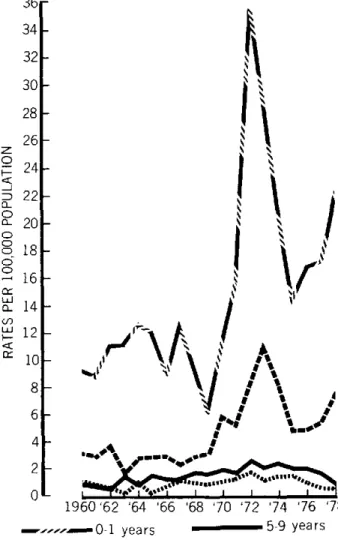
significant morbidity and mortality. Figure 2 shows that infants suffer the highest morbidity, followed by 1-4 year olds. Since 1969, pre-schoolers and infants have followed a similar trend in age-specific incidence. Percentage distribution by age reveals that approximately one-quarter of the cases occurred in infants and over 55 per cent in those under 5 years of age. Figure 2 demonstrates a gradual shift in age distribution since 1960 with an in-creasing proportion of cases occurring in the older age groups. Males accounted for over 57 per cent of all cases.
Figure 2. Age-Specific Incidence of Meningococcal Disease in Canada, 1960-1979.
z o i.
a_ D
o-o
o-o
o-<r
36
34
32
30
28
26
24
22
20
18
16
14
12
10
8
6
4
2
0
-.---- 0-1 years 5-9 yea rs
... 1-4 years ... 10-14 years
.
0
1924 1934 1944 1954 1964 1974
Hospital Morbidity
Figure 3 shows that the number of hospitalizations has exceeded the notifications by physicians in all years since 1960. The difference was much greater prior to 1970. In recent years, while reporting has improved, hospitaliza-tion rates (per 100,000 populahospitaliza-tion) are still 20 per cent higher. In 1977, hospitalized cases required an average of 12.7 days of hospital care.
Mortality
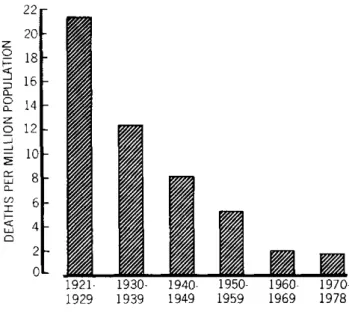
Between 1921 and 1979, a total of 5,639 meningococ-cal deaths were recorded in Canada. Figure 4 shows that since 1921 mortality has declined progressively and in the 1970s the rates were only 8 per cent of those in the 1920. The number of deaths reported yearly has ranged from 24 (1961) to 341 (1929), with an average of 96. Mortality from meningococcal disease continues to occur despite modern therapeutic management. In the past five years, the average number of deaths recorded was 39, men-ingococcemia being responsible for two-thirds of all deaths attributed to meningococcal disease. The
remain-Figure 3. Meningococcal Disease: Reported Incidence and
Hospitalizations, Canada, 1960-1978.
2.2r
z
o
o-o
o
o
C-or
LL
C_ c) w
2.0
1.8
1.6
1.4
1.2
1.0
0.8
0.6
0.4
1-Figure 4. Deaths Due to Meningococcal Disease by Decade, Canada, 1921-1978.
z
o
o
z
o _i-J
aJ
C-
o-LU 22
20
18
16
14 12
10
8 6 4 2
0
1921- 1930- 1940- 1950- 1960-
1970-1929 1939 1949 1959 1969 1978
ing one-third was due to meningococcal meningitis. In-fants under 1 year of age accounted for almost 30 per cent of deaths, and children under 5 years, 55 per cent. Twenty per cent of all deaths were among adults.
Death-to-Case Ratio
The significance of a death-to-case ratio depends upon the accuracy and completeness with which deaths and cases are recorded. Since mortality statistics for acute in-fectious diseases are known to be more complete than cases notified by physicians, figures for death-to-case ratios are likely to be artificially high. In the three decades, 1940, 1950, 1960, there has been a progressive increase in the death-to-case ratios, 26 per cent, 30 per cent, and 34 per cent respectively. In the 1970s this ratio was only 16 per cent. Decline in death-to-case ratio may be explained by (a) improved physician notification of cases by physicians; (b) inclusion of meningococcal car-riers; (c) possible inclusion of greater numbers of atypical meningococcal disease manifesting itself as pneumonia, arthritis, conjunctivitis, or genitourinary infection which normally have a low mortality rate; or (d) early detection and improved therapeutic management.
0.2
-0O0.- I ' I .I .1 , 1 , 1 . 1 , 1 , 1 , I
1960 '64 '68 '72 '76
Hospitalizations
Physician notifications =m=....
Distribution of Meningococcal Serogroups, 1974-1979
Of the 470 typable isolates obtained from cases be-tween 1974 and 1979, group B accounted for 50.6 per
cent; group C, 26.6 per cent; group A, 13.8 per cent; and groups Y,Z,W-135 and 29e for 9 per cent. Those few serologically rough, poly-agglutinating, "non-typable" or untyped strains could not be incorporated for deter-mination of frequency distribution on a national basis.
During the past decade the most notable feature was the decline in group A serogroups from 30 per cent to 7 per cent of the total and the increase in group B distribu-tion from 30 per cent to over 60 per cent of the total isolates.
Laboratory surveillance of meningococcal serogroups and serotypes is becoming increasingly important
because of the introduction of vaccines which are serogroup specific. A change in the serogroup distribu-tion warrants alteradistribu-tion in the recommendadistribu-tion.
Vaccine preparations for groups A and C have been licensed in Canada. There is no vaccine presently available for use in prevention of group B disease.
(Source: Canada Diseases Weekly Report, Vol. 6-49, 6 December 1980.)
Histoplasmosis in Mexico, 1979-1980
Primary pulmonary histoplasmosis in Mexico is a health problem that has not been accurately evaluated, both because of a lack of knowledge among medical and paramedical personnel concerning this mycosis and because it affects residents of rural areas, many of whom are not reached by health care services. In addition, it is not a disease for which reporting is compulsory.
The causal agent, Histoplasma capsulatum. grows abundantly in bat droppings that infect mines, tunnels, and caves. It frequently produces massive infection among workers, in whom the disease is usually serious and often fatal.
The problem causes losses of several billion pesos every year, and has become a serious hindrance to development
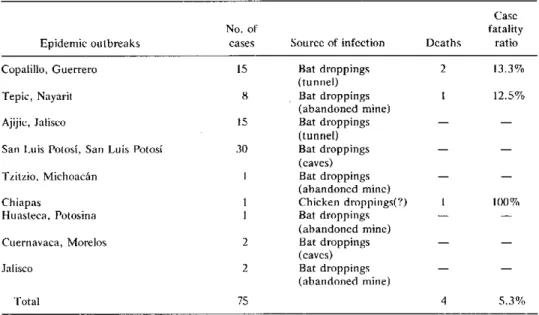
Table 1. Epidemic outbreaks of primary pulmonary histoplasmosis in Mexico in 1979.a
Epidemic outbreaks
Copalillo, Guerrero Tepic, Nayarit Ajijic, Jalisco
San Luis Potosí, San Luis Potosí Tzitzio, Michoacán
Chiapas
Huasteca, Potosina Cuernavaca, Morelos Jalisco
Total
No. of
cases Source of infection
15 Bat droppings (tunnel) 8 Bat droppings
(abandoned mine) 15 Bat droppings
(tunnel) 30 Bat droppings
(caves) 1 Bat droppings
(abandoned mine) I Chicken droppings(?) 1 Bat droppings
(abandoned mine) 2 Bat droppings
(caves) 2 Bat droppings
(abandoned mine)
75
Case fatality Deaths ratio
2 13.3% 1 12.5%
100%
4 5.3%
aSource: Department of Epidemiology. l
12