Determinants of weight gain in pregnant women
attending a public prenatal care facility in Rio de
Janeiro, Brazil: a prospective study, 2005-2007
Determinantes da evolução ponderal em
gestantes atendidas em uma unidade da rede
pública de saúde do Município do Rio de Janeiro,
Brasil: estudo prospectivo, 2005-2007
1 Instituto de Nutrição Josué de Castro, Universidade Federal do Rio de Janeiro, Rio de Janeiro, Brasil. 2 Departamento de Estatística, Universidade Federal do Rio Grande do Norte, Rio Grande do Norte, Brasil.
Correspondence G. Kac
Departamento de Nutrição Social e Aplicada, Instituto de Nutrição Josué de Castro, Universidade Federal do Rio de Janeiro.
Av. Brigadeiro Trompowsky s/n, Bloco J, 2o andar, Rio de Janeiro, RJ 21941-590, Brasil. [email protected] [email protected]
Patricia Lima Rodrigues 1
Elisa Maria de Aquino Lacerda 1
Michael Maia Schlüssel 1
Maria Helena Constantino Spyrides 2
Gilberto Kac 1
Abstract
The objective of this study was to evaluate the determinants of weight gain during pregnancy. The study adopted a prospective cohort de-sign with four follow-up waves and included a sample of 255 pregnant women that received prenatal care at a public health care facility in Rio de Janeiro, Brazil. A mixed-effects linear longitudinal regression model was used, having as the dependent variable the weight assessed in four follow-up waves, and as independent variables: demographic, socioeconomic, re-productive, behavioral, and nutritional data. Mean weight gain was 0.413kg per gestational week, consistent with recommendations by the Institute of Medicine. Per capita family income and smoking were associated with total weight gain during gestation. According to the longi-tudinal multiple linear regression model, age (β = 0.6315), menarche (β = -2.3861), triglycer-ides (β = 0.0437), blood glucose (β = 0.1544), and adequacy of energy consumption (β = -0.0642) were associated with gestational weight gain. Special attention should be given to these sub-groups, due to increased risk of excessive weight gain.
Nutritional Epidemiology; Weight Gain; Preg-nancy
Introduction
Weight gain during pregnancy includes three components: the product of conception (fe-tus, placenta, extracellular and amniotic fluid), maternal tissue expansion (uterus, breasts, and blood volume), and maternal fat reserve 1,2. Nor-mal mean total gestational weight gain is esti-mated at 12.5kg 1,2,3,4.
Weight gain measured at various moments during pregnancy is the most common way of assessing the pregnant woman’s nutritional sta-tus, besides indirectly assessing fetal growth 4,5, since it is more sensitive (as compared to other anthropometric indicators) to acute intra-gesta-tional stress 3. It is thus an important indicator for observing normal evolution of pregnancy and is widely used in prenatal care 4.
Pre-gestational maternal nutritional status and gestational weight gain have been studied systematically, due not only to the growing prev-alence of deviations from their normal values, but especially to their determinant role in gesta-tional outcomes 2 and the lifelong consequences for the mother and child 6,7.
Complex interactions between maternal bio-logical and metabolic factors influence the weight gain pattern during pregnancy, besides numer-ous social factors that can act as determinants. The latter include pre-gestational nutritional status, schooling, socio-demographic situation, skin color, work, physical activity, calorie intake, smoking, alcohol consumption, reproductive history, and prenatal care 2,4,19,20.
Although the amount of gestational weight gain and obstetric outcomes are well document-ed in the scientific literature, the determinants of gestational weight change have received rela-tively little attention. The objective of the current study was thus to investigate demographic, so-cioeconomic, reproductive, behavioral, and nu-tritional determinants of weight change during pregnancy.
Methods
This was a prospective cohort study with a dy-namic sample consisting of pregnant women treated at a primary health care center (Mother Thereza of Calcutta Municipal Clinic), located in the Ilha do Governador neighborhood in the city of Rio de Janeiro, Brazil. Free recruitment of sub-jects occurred for 22 months, from June 2005 to April 2007.
The study included women 18 to 40 years of age, in the 8th to 13th weeks of pregnancy, free of non-communicable chronic diseases (like hy-pertension and diabetes) or infectious diseases (HIV), with singleton pregnancies. The prenatal care service contacted a total of 292 pregnant women who met the eligibility criteria. Of these, 255 agreed to participate in the study and began the follow-up period.
Individual interviews were held in four fol-low-up waves during gestation: 8-13 gestational weeks (baseline), 19-21, 26-28, and 36-40, when anthropometric measures were taken and pre-viously tested questionnaires were applied. The main target covariables for the current study were measured during the first wave. However, various other constructs were also studied, like anxiety, depression, oral hygiene, caffeine con-sumption, and family violence. This information was collected at the other follow-up points, but their use is beyond the scope of the current study. Blood samples were taken at the 1st, 3rd, and 4th waves and were analyzed at the central munici-pal laboratory of Rio de Janeiro.
The dependent variable was weight mea-sured at each follow-up wave to determine weight change. Total weight gain during preg-nancy was calculated as the difference between
weight as measured at the fourth and first follow-up waves.
The covariables used in the current analysis were collected at baseline (8th-13th gestational week) and separated in five blocks: demographic and socioeconomic variables: age (18-24, 25-40 years), self-reported skin color (white, brown, black), marital status (married, living with part-ner, single), schooling (≤ 8, > 8 years), per capita family income (≤ 0.5; 0.5-1.0; > 1.0 times the min-imum wage); and work outside the home (yes, no); reproductive variables: age at menarche (< 12; ≥ 12 years), parity (primiparous, multipa-rous); inter-pregnancy spacing; behavioral vari-ables: smoking (non-smoker, former smoker, smoker), alcohol consumption (non-consumer, former consumer, consumer), intensity of physi-cal activities (sedentary, light activity). Informa-tion on smoking also included quesInforma-tions on age when the individual began smoking, number of cigarettes per day, and time during which the woman smoked. However, none of these vari-ables showed an effect on weight change. The alcohol consumption variable was based on a questionnaire on frequency of alcohol consump-tion that included informaconsump-tion on the type of alcoholic beverage consumed, frequency, and amount, in addition to age when the individual began drinking; nutritional variables: pre-gesta-tional nutripre-gesta-tional status (underweight, normal weight, overweight, obese), adequacy of calorie intake (below adequate, adequate, more than adequate), daily protein, lipid, and carbohydrate energy intake; biochemical variables: hematocrit (%), hemoglobin (g/dL), blood glucose (mg/dL), total cholesterol total (mg/dL), low density cho-lesterol (LDL-chocho-lesterol, mg/dL), high density cholesterol (HDL-cholesterol, mg/dL), and tri-glycerides (mg/dL).
The women were weighed on a digital scale with a minimum capacity of 2.5kg and maximum of 150kg, accurate to 0.1kg (Filizzola PL 150, Filiz-zola Ltda., São Paulo, Brazil). Stature was mea-sured in duplicate with a Harpeden portable sta-diometer (Harpenden Inc., UK) with a minimum capacity of 70.1cm and maximum of 208.5cm, with a maximum allowable variation of 0.5cm between the two measurements. All the anthro-pometric measurements were taken by trained interviewers and standardized according to rec-ommended guidelines 21.
– underweight; 18.5 ≤ BMI < 25.0kg/m2 – normal weight; 25.0 ≤ BMI < 30.0kg/m2 – overweight; and BMI ≥ 30.0kg/m2 – obese) 4. Data on pre-gestational nutritional status were also analyzed using the cutoff points recommended by the In-stitute of Medicine 1 (BMI < 19.8kg/m2 – under-weight; 19.8 ≤ BMI < 26.0kg/m2 – normal weight; 26.0 ≤ BMI < 29.0kg/m2 – overweight; and BMI > 29.0kg/m2 – obese) for purposes of compari-son, in the discussion, with studies that adopted these cutoffs.
The pregnant women’s level of physical ac-tivity was investigated by means of a scale mea-suring the intensity of physical activities 22. First, the mean weekly frequency with which each of the activities listed on the questionnaire was investigated. Subjects were then asked about the mean duration of these activities, and this value was multiplied by the weekly frequency of the respective activity, thus obtaining the mean weekly time for each activity. The mean weekly time for all the activities was then summed. The mean weekly time for each activity was multi-plied by an intensity factor associated with the activity (MET – metabolic equivalent test) 23 and a new sum total was performed. The pregnant women’s level of physical activity was then esti-mated by dividing the second total by the first. Finally, the pregnant women were categorized according to level of physical activity and clas-sified according to the cutoff points proposed by Chasan-Taber et al. 24: sedentary (METgest ≤ 1.5) and light (METgest > 1.5).
Food consumption was measured by means of a semi-quantitative food frequency question-naire (Food Frequency Questionnaire – FFQ) 25, previously validated for adults, containing a food list with 81 items and eight possible an-swers for frequency of current consumption (> 3 times/day, 2-3 times/day, once/day; 5-6 times/ week, 2-4 times/week, once/week, 1-3 times/ month, and never/rarely). The overall frequen-cies thus obtained were transformed into daily frequencies and multiplied by the amounts of foods consumed, thereby obtaining the daily consumption of energy, carbohydrates, lipids, and proteins. The databanks adopted for this purpose were the Brazilian Food Composition Table (TACO) 26, the table of the Brazilian In-stitute of Geography and Statistics (IBGE) 27, and the USDA (United States Department of Agriculture) table 28. The analyses excluded 33 women with energy consumption less than 600 or greater than 6,000kcal, who were considered outliers. The food intake energy adequacy was calculated according to the recommended en-ergy for age, weight 29, and estimated level of physical activity, considering adequate
gesta-tional weight gain 1,30. Energy consumption was considered adequate from 90 to 110%, low when it was less than 90%, and high when it was great-er than 110%.
The blood tests of the pregnant women par-ticipating in the study were done on 5mL blood samples, drawn by a designated professional from the health unit. Subjects had been fasting for at least 12 hours before drawing the blood sample. The samples were stored in the labo-ratory under controlled conditions and stan-dard temperature (6ºC), and were analyzed by a properly trained lab technician. Blood samples were centrifuged (3,000rpm) for plasma sepa-ration and extraction, after which they were immediately frozen at -20ºC for subsequent analysis. Hemoglobin and hematocrit tests were performed using an automatic counter. The en-zymatic method was used to obtain total cho-lesterol and triglycerides, while the colorimetric method was used to obtain HDL-cholesterol. LDL-cholesterol, was measured by the formula proposed by Friedwald et al. 31: [LDL-c = (TC) – (HDL-c) – (TG)/5)].
Data on bodyweight and gestational age were also obtained from medical charts of the pregnant women who began follow-up but who missed any of the subsequent interviews. Weight measurements were also taken at the time of pre-natal visits, by trained health professionals, using only the measurements that fit the period pro-posed for each of the study’s follow-up waves.
Data were entered using Epi Info version 6.02 (Centers for Disease Control and Prevention, At-lanta, USA). The consistency of the resulting da-tabank was confirmed using SPSS 13.0 (SPSS Inc., Chicago, USA) and S-Plus 2000 (Mathsoft Inc., Seattle, USA).
The statistical analysis initially involved the description of the pregnant women partici-pating in the cohort, according to established procedures like means and 95% confidence in-tervals (95%CI) for the continuous variables, in addition to the mean weight measured at each follow-up and the total gestational weight gain according to the selected covariables. The Stu-dent t test and analysis of variance (ANOVA) were used to test the equality of the mean total gestational weight gain.
The mixed-effects procedure generates regres-sion coefficients and their respective standard errors. The explanatory variables displaying a significant association (p-value < 0.20) with the outcome were candidates for the multiple mod-el. The mixed-effects linear model was adopted based on its great statistical efficiency 32.
The pattern of losses was evaluated based on the final follow-up rate (number of pregnant women who began/concluded follow-up). The results were analyzed using the chi-squared test for proportions.
The study was approved by the Institutional Review Board of the Martagão Gesteira Institute of Childcare and Pediatrics at the Federal Uni-versity in Rio de Janeiro and by the Rio de Janeiro Municipal Health Secretariat, and complies with Ruling no. 196/1996 of the Brazilian National
Health Council 33. All of the participants signed a free and informed term of consent, having re-ceived all the necessary clarifications.
Results
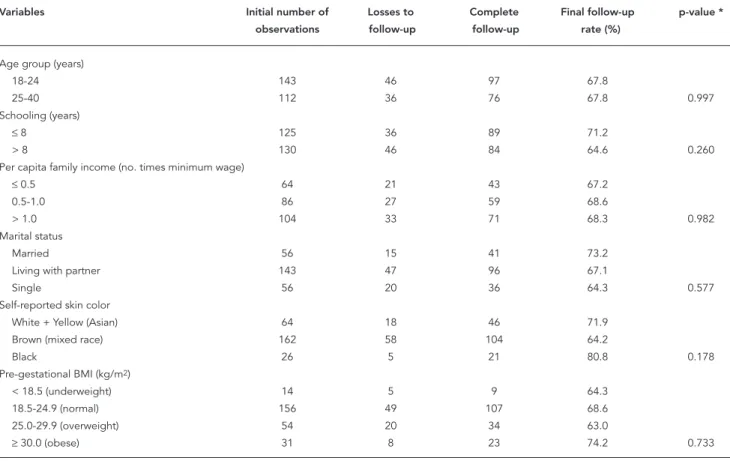
The final rate of loss to follow-up was 32.1%. However, the pattern of losses was random in re-lation to the different variables listed in Table 1.
The data analysis included 255 pregnant women in the first follow-up wave (baseline). Of these, 197 appeared for the second interview, 186 completed the third, and 173 concluded the entire follow-up with the fourth interview, as dis-played in Figure 1. For the sample of pregnant women as a whole, 11.7% (n = 23), 17.9% (n = 33), and 45.1% (n = 78) had their weight data re-trieved from their medical charts at the second, third, and fourth follow-up waves, respectively. No significant differences were found between the mean weights as measured directly and re-trieved from medical charts, after controlling for gestational age.
Table 2 shows the baseline means for several selected variables for the 255 pregnant women
Table 1
Distribution of selected variables comparing losses to complete follow-up and fi nal follow-up rate in pregnant women attending a prenatal clinic in Rio de Janeiro, Brazil, 2005-2007.
Variables Initial number of Losses to Complete Final follow-up p-value *
observations follow-up follow-up rate (%)
Age group (years)
18-24 143 46 97 67.8
25-40 112 36 76 67.8 0.997
Schooling (years)
≤ 8 125 36 89 71.2
> 8 130 46 84 64.6 0.260
Per capita family income (no. times minimum wage)
≤ 0.5 64 21 43 67.2
0.5-1.0 86 27 59 68.6
> 1.0 104 33 71 68.3 0.982
Marital status
Married 56 15 41 73.2
Living with partner 143 47 96 67.1
Single 56 20 36 64.3 0.577
Self-reported skin color
White + Yellow (Asian) 64 18 46 71.9
Brown (mixed race) 162 58 104 64.2
Black 26 5 21 80.8 0.178
Pre-gestational BMI (kg/m2)
< 18.5 (underweight) 14 5 9 64.3
18.5-24.9 (normal) 156 49 107 68.6
25.0-29.9 (overweight) 54 20 34 63.0
≥ 30.0 (obese) 31 8 23 74.2 0.733
BMI: body mass index.
who began the follow-up. On average, the wom-en were 25.7 years old, had eight years of school-ing, a per capita monthly family income of BR$ 353.00 (approximately U$ 220.00), and age at menarche of 12 years. Mean pre-gestational BMI was 24.0kg/m2.
Mean pre-gestational weight at baseline was 61.2kg (95%CI: 59.6-62.7), and mean weight mea-sured at the second, third, and fourth waves was 64.3 (95%CI: 62.6-66.0), 66.8 (95%CI: 65.2-68.5), and 72.8kg (95%CI: 70.8-74.8), respectively (Fig-ure 1). Mean total weight gain was 11.7kg (95%CI: 11.0-12.4). In addition, 33.4% of the women be-gan the pregnancy with excess weight (12.2% with obesity) and 5.5% with pre-gestational un-derweight, according to the WHO cutoff points, while the values according to the Institute of Medicine guidelines were 13.7%, 15.3%, and 18% for overweight, obesity, and underweight, respec-tively (results not shown).
Tables 3 and 4 show the mean weight mea-surements at each follow-up wave and the mean total weight gain according to the selected vari-ables. Mean weight was higher in pregnant wom-en with per capita family income greater than one
minimum wage, as was total weight gain (12.5 versus 10.8kg). Former smokers showed higher total gestational weight gain (13.9kg), as well as higher mean bodyweight throughout pregnancy.
Pre-selection of variables for the mixed-ef-fects linear model (Table 5) showed a positive as-sociation between weight gain and the following covariables: gestational age, age, marital status (married/living with partner), parity, smoking (non or former smoker), alcohol consumption (none/former), pre-gestational BMI, stature, blood glucose, and triglycerides. Meanwhile, age at menarche and adequacy of energy consump-tion were inversely associated with weight gain. The variables inter-pregnancy spacing, alcohol consumption (none/former), and HDL-choles-terol showed statistical significance < 0.20 and were also candidates for the multiple model.
The covariables that remained in the final linear longitudinal regression model (Table 6) as positively and significantly associated with weight gain were: gestational age (β = 0.4132; p < 0.0001), maternal age (β = 0.6315; p < 0.0001), triglycerides (β = 0.0437; p = 0.0231), and blood glucose (β = 0.1544; p = 0.0194), while age at
men-Figure 1
arche (β = -2.5977; p < 0.0001) and adequacy of energy consumption (β = -0.0642; p = 0.0007) were inversely associated.
Discussion
The study’s findings demonstrate that mean gestational weight gain was 0.413kg per week of pregnancy, consistent with the weight gain recommended by the Institute of Medicine for women with pre-gestational BMI within the normal range 1,34. Analyzing the mean weight gain per trimester of pregnancy, our results were similar to those of Nucci et al. 35 based on data
collected by the Brazilian Study on Gestation-al Diabetes from 1991 to 1995 with more than three thousand pregnant women in six Brazilian State capitals. In the current study, mean weight gain was 0.41kg and 0.43kg per week in the sec-ond and third trimesters, respectively (data not shown in tables). In Nucci et al. 35, the figures were 0.43kg and 0.40kg per week for the second and third trimesters, respectively.
The prevalence rates for women who began pregnancy with excess weight and underweight were 33.4% and 5.5%, respectively, based on the WHO cutoff points 4. These figures disagree with those found in health services in the States of São Paulo (24% and 21%) 19, Pernambuco (26.3%
Table 2
Baseline mean, minim, and maximum values and 95% confi dence intervals (95%CI) in pregnant women attending a primary care clinic in Rio de Janeiro, Brazil, 2005-2007.
Variables n Mean Minimum Maximum 95%CI
Demographic and socioeconomic
Age (years) 255 25.7 18.1 40.7 25.0-26.4
Schooling (years) 255 8.1 0.0 20.0 7.7-8.5
Per capita family income (Reais) * 254 353.3 0.0 3.333.0 308.8-397.8
Reproductive
Age at menarche (years) * 252 12.6 8.0 18.0 12.4-12.8
Parity 255 0.8 0.0 6.0 0.7-0.9
Inter-pregnancy spacing (years) *,** 126 5.2 0.0 14.0 4.6-5.8
Behavioral
Intensity of physical activity **,*** 254 2.0 1.0 3.3 2.0-2.1
Nutritional
Reported pre-gestational weight (kg) # 240 59.9 36.0 102.0 58.3-61.5
Measured pre-gestational weight (kg) 255 61.1 39.5 98.1 59.6-62.7
Stature (cm) 255 159.5 143.1 175.8 158.7-160.2
Pre-gestational BMI (kg/m2) 255 24.0 16.3 41.3 23.4-24.5
Energy intake (kcal/day) *** 222 3.405.9 646.0 5.829.0 3.261.5-3.550.6 Protein intake (g/day) *** 222 141.7 33.0 340.0 134.8-148.6
Lipid intake (g/day) *** 222 92.4 0.0 217.0 97.6-96.8
Carbohydrate intake (g/day) *** 222 497.3 99.0 1031.0 474.4-520.2
Biochemical ***
Hematocrit (%) 208 38.5 28.2 50.8 38.0-39.0
Hemoglobin (g/dL) 208 12.9 9.3 17.1 12.7-13.1
Blood glucose (mg/dL) 221 77.1 20.6 175.0 75.5-78.7
Total cholesterol (mg/dL) 219 172.7 90.7 276.0 168.1-177.3
LDL-cholesterol (mg/dL) 202 93.1 31.7 198.8 89.3-96.9
HDL-cholesterol (mg/dL) 210 56.9 31.0 99.1 55.2-58.5
Triglycerides (mg/dL) 207 109.3 29.9 290.0 103.1-115.5
Baseline = from 8th to 13th weeks of gestation. BMI: body mass index.
* Variables with losses < 2% due to absence or inconsistency of collected information; ** “n” refers to 128 non-primiparous pregnant women;
*** Variable with losses of 10 to 20% due to absence or inconsistency of collected information;
and 25.4%) 36, and Paraíba (27% and 23%) 11. A lower prevalence rate for excess pre-gestation-al weight was described by Kac et pre-gestation-al. 13,14, who found 17.5%, based on the results of a cohort of women monitored for nine months postpartum in Rio de Janeiro from 1999 to 2001. A multi-center study by Nucci et al. 16 showed 29% with excess weight and 6% with underweight, similar to our findings. Importantly, the use of differ-ent diagnostic criteria for evaluating pre-gesta-tional nutripre-gesta-tional status can explain the differ-ences in various studies for low pre-gestational weight, since only Nucci et al. 16 and the current study used the WHO cutoff points 4, while Kac et al. 13,14 used the Institute of Medicine crite-ria 1,34 and other studies used the cutoff points proposed by Atalah et al. 37, which differ from the WHO guidelines as to the diagnosis of un-derweight.
According to the linear multiple regression model, maternal age, serum triglycerides and blood glucose, age at menarche, and adequacy of
energy consumption remained associated with gestational weight gain.
For each increase of one year in the wom-an’s age, there was an increase of 0.631kg in weight gain. In other words, comparing 20 and 30-year-old pregnant women, the difference in total weight gain could reach nearly 6kg. Age is a non-modifiable factor and has proven to be an important determinant of anthropometric measurements 38. For pregnant women, the literature shows lower weight gain in younger women 39, which is consistent with the current study’s findings.
We observed an inverse association between weight gain and age at menarche. In other words, the earlier the menarche, the higher the gesta-tional weight gain, on average -2.4kg per year. In the epidemiological context, age at menarche has been inversely associated with excess body-weight in childbearing-age women, and early age at menarche has been reported as an important risk factor for future obesity 40,41. Some authors
Table 3
Mean weight according to different follow-up times for socio-demographic variables in pregnant women attending a prenatal clinic in Rio de Janeiro, Brazil. 2005-2007.
Variables Follow-up time (weeks) * Mean total
8th-13th 19th-21th 26th-28th 36th-40th weight gain (kg)
Age (years)
18-24 58.6 (56.9-60.3) [143] 61.6 (59.8-62.4) [112] 64.5 (62.6-66.3) [105] 71.3 (69.0-73.7) [97] 12.7 ** 25-40 64.4 (61.8-67.1) [112] 67.9 (64.9-70.9) [85] 69.9 (67.0-72.8) [81] 74.2 (71.2-78.0) [76] 10.4 *
Self-reported skin color
White 63.3 (59.8-66.9) [64] 66.0 (62.1-69.9) [49] 69.5 (65.4-73.6) [46] 74.4 (70.1-78.3) [46] 11.9 Brown 60.8 (58.9-62.7) [162] 64.2 (62.1-66.4) [121] 66.0 (64.0-68.0) [114] 72.6 (70.0-75.2) [104] 11.6 Black 58.1 (55.3-61.0) [26] 61.3 (58.4-64.9) [24] 64.7 (62.2-69.3) [23] 69.9 (65.9-73.9) [21] 11.7
Marital status
Married 65.4 (61.7-69.1) [56] 67.9 (63.9-70.0) [43] 69.3 (65.1-73.5) [36] 76.0 (71.3-80.3) [41] 11.2 Living with partner 60.5 (58.5-62.5) [143] 64.2 (62.0-66.3) [104] 66.6 (64.6-68.7) [104] 72.2 (69.6-74.7) [96] 12.0 Single 58.6 (55.5-61.7) [56] 61.5 (58.1-65.0) [50] 65.4 (61.6-69.2) [46] 70.8 (66.2-75.4) [36] 11.3
Schooling (years)
≤ 8 59.7 (57.7-61.6) [125] 63.5 (61.2-65.7) [93] 65.7 (63.5-67.9) [91] 71.2 (68.6-73.8) [89] 11.2 > 8 62.6 (60.2-65.0) [130] 65.1 (62.6-67.6) [104] 67.9 (65.4-70.4) [95] 74.5 (71.4-77.6) [84] 12.2 Per capita income
(in times the minimum wage)
≤ 0.5 58.0 (55.5-60.4) [64] 61.4 (58.5-64.3) [50] 63.0 (60.4-65.6) [44] 68.9 (65.6-72.2) [43] 10.8 *** 0.5-1.0 61.5 (58.7-64.2) [86] 64.3 (61.2-67.4) [65] 67.0 (64.1-69.8) [67] 72.6 (69.0-76.2) [59] 11.3 *** > 1.0 62.9 (60.3-65.4) [104] 66.2 (63.4-68.9) [82] 69.0 (66.1-71.9) [75] 75.3 (71.9-78.6) [71] 12.5 *** Work outside the home
Yes 61.6 (59.5-63.7) [145] 64.5 (62.2-66.8) [113] 66.9 (64.5-69.3) [106] 73.4 (70.5-76.2) [101] 11.6 No 60.5 (58.2-62.9) [110] 64.1 (61.6-66.6) [84] 66.8 (64.5-69.0) [80] 71.9 (69.2-74.6) [72] 11.9
* Mean weight (kg) (95%CI) [n];
suggest that this association can be attributed to excess weight in childhood 42,43. Other stud-ies 44,45 confirm that menarche before 12 years of age can represent predisposition to fat accumu-lation, as well as to the tendency to deposit adi-pose tissue during pregnancy in women without excess pre-gestational weight. Early menarche also leads to early initiation of the reproductive cycle, which can influence hormonal activity and body fat deposition due to physiological imma-turity. Gunderson et al. 44 reported that women with age at menarche ≤ 12 years showed 2.57 times the odds of presenting postpartum over-weight. A study of childbearing-age women in Belo Horizonte by Kac et al. 45 showed a 3.2 odds ratio of obesity in women with age at menarche less than 12 years. Helm et al. 41 found that early menarche was associated with excess weight (OR = 5.0; 95%CI: 2.4-10.6).
Higher triglycerides in early pregnancy were directly associated with weight gain, although the coefficient was relatively small (0.043kg per 1mg/dL). Changes in lipid metabolism during
pregnancy lead to an accumulation of mater-nal fat in early and mid-pregnancy. During early pregnancy, estrogen, progesterone, and insulin levels are increased, favoring lipid deposition and inhibiting lipolysis. Butte 46 demonstrated that lipoprotein lipase activity is increased in adi-pose tissue in the femoral region from the 8th to the 11th week of pregnancy. This hypothesis pro-vides a probable explanation for the association between triglyceride levels in early pregnancy and greater subsequent weight gain.
Serum glucose concentrations were posi-tively associated with weight gain, estimated at 0.154kg per 1mg/dL, meaning, for example, that a woman who begins pregnancy with a blood glucose of 110mg/dL would experience a 4.6kg greater weight gain as compared to women with blood glucose of 80mg/dL. Saldanha et al. 47, studying the relationship between gestational weight gain and glucose tolerance in women, ob-served that weight gain was significantly higher in women with gestational diabetes than in those with normal blood glucose. Studying a cohort of
Table 4
Mean weight according to different follow-up times for nutritional, behavioral, reproductive, and biological variables in pregnant women attending a prenatal clinic in Rio de Janeiro, Brazil, 2005-2007.
Variables Follow-up time (weeks) * Mean total
8th-13th 19th-21th 26th-28th 36th-40th weight gain (kg)
Adequacy of energy intake (%)
< 90 65.7 (62.5-68.8) [73] 69.3 (65.7-72.9) [57] 72.3 (68.7-75.9) [54] 76.8 (73.0-80.6) [54] 11.0 90-110 61.7 (57.5-65.8) [38] 65.4 (61.1-69.7) [24] 69.0 (64.7-73.3) [22] 71.7 (67.2-76.2) [23] 11.9 > 110 59.9 (57.7-62.2) [110] 63.4 (61.1-65.7) [88] 65.1 (63.0-67.2) [86] 71.9 (68.9-74.8) [74] 11.8 Intensity of physical activity
Sedentary 61.2 (57.3-65.0) [44] 64.7 (60.9-68.5) [36] 66.4 (62.5-70.2) [34] 72.9 (68.3-77.6) [30] 12.4 Light 61.2 (59.5-62.9) [210] 64.2 (62.3-66.1) [161] 66.9 (65.1-68.8) [152] 72.8 (70.5-75.0) [143] 11.5
Smoking
Non-smoker 59.8 (58.0-61.5) [161] 63.0 (61.0-64.9) [131] 66.0 (64.0-68.0) [128] 70.7 (68.6-72.9) [114] 10.9 ** Former smoker 64.9 (61.3-68.5) [63] 67.2 (63.7-70.7) [44] 69.7 (66.2-73.3) [37] 78.8 (74.1-83.5) [43] 13.9 ** Smoker 60.8 (55.8-65.4) [31] 66.8 (60.0-73.5) [22] 66.9 (60.4-73.4) [21] 71.1 (62.7-79.40) [16] 11.7 **
Parity
Primiparous 59.6 (57.4 -61.80) [127] 62.4 (60.0-64.89) [100] 65.1 (62.7-67.5) [93] 71.7 (68.7-747) [84] 12.0 Multiparous
Age menarche (years) 62.7 (60.5-64.8) [128] 66.3 (64.0-68.7) [97] 68.6 (66.3-70.9) [93] 73.8 (71.1-76.5) [89] 11.3 < 12 67.3 (63.8-70.8) [63] 69.4 (65.4-73.3) [44] 71.1 (67.2-75.0) [40] 77.7 (72.8-82.5) [40] 11.9 ≥ 12 59.1 (57.5-60.7) [190] 62.9 (61.1-64.8) [150] 65.8 (63.9-67.6) [143] 71.3 (69.2-78.5) [132] 11.7
Triglycerides
1st tertile 59.0 (50.0-61.5) [69] 61.7 (59.0-64.3) [50] 64.6 (61.9-67.4) [50] 71.1 (67.2-75.1) [43] 12.4
2nd tertile 59.8 (56.4-63.2) [67] 61.9 (58.5-65.3) [57] 65.0 (61.4-68.7) [53] 71.1 (67.3-75.0) [53] 11.5 3rd tertile 64.5 (61.4-67.7) [71] 68.3 (65.0-71.6) [60] 70.2 (66.9-73.4) [55] 76.5 (72.9-80.2) [52] 11.1
* Mean weight (kg) (95%CI) [n];
700 women to evaluate the relationship between BMI, glucose tolerance, and gestational out-comes, Bo et al. 48 observed that hyperglycemia in pregnancy was a risk factor for excess gesta-tional weight gain (OR = 1.06; 95%CI: 1.02-1.10). The results of the current study corroborate the findings from the studies quoted above.
An inverse association was observed between adequacy of energy consumption in the first tri-mester and weight gain during pregnancy. For each percentage point drop in adequacy, there was a weight gain of approximately 0.064kg. Im-portantly, bodyweight for the pregnant women was measure up to the 13th week to calculate
ad-equacy of energy consumption 1,34. A possible explanation is that some women may display a significant weight drop in early pregnancy, since they are more susceptible to nausea and vom-iting 1,3. This can overestimate the percentage adequacy for those who lost weight and under-estimate it for those who gained weight. Another plausible explanation is the underreporting of food consumption (as measured by the FFQ) by pregnant women with greater bodyweight. In the study that validated the FFQ used in the present study, Sichieri & Everhart 25 observed that ener-gy consumption by women decreased with the increase in energy expenditure, suggesting that
Table 5
Pre-selection of variables for the weight change mixed-effects model in pregnant women attending a prenatal clinic in Rio de Janeiro, Brazil, 2005-2007.
Variables Estimate (β) Standard error p-value
Gestational age (weeks) 0.4164 0.0121 < 0.0001
Age (years) 0.5678 0.1361 0.0004
Self-reported skin color (brown/white) * 2.0623 1.8620 0.2691 Self-reported skin color (brown/black) * -2.6517 2.6625 0.3203 Marital status (living with partner/married) * 5.0619 1.9726 0.0109 Marital status (living with partner/single) * -2.1721 1.9733 0.2720 Work outside of the home (yes/no) * -0.8478 1.6099 0.5989
Schooling (years) 0.1468 0.2514 0.5596
Per capita family income (Reais) 0.0026 0.0022 0.2397 Age at menarche (years) -2.1533 0.4499 < 0.0001 Parity (number of children) 1.6816 0.7825 0.0326 Inter-pregnancy spacing (years) 0.5791 0.3173 0.0704
Smoking (no/former) * 4.7303 1.8733 0.0122
Smoking (no/yes) * 1.2445 2.4724 0.6152
Alcohol consumption (no/former) * 2.7381 1.7128 0.1112 Alcohol consumption (no/yes) * 0.3252 2.5844 0.9000 Intensity of physical activity (METgest) 1.4359 1.5501 0.3552
Pre-gestational BMI (kg/m2) 2.6601 0.0656 < 0.0001
Stature (cm) 0.7925 0.1246 < 0.0001
Energy intake (kcal/day) -0.0001 0.0008 0.8536
Protein intake (g/day) -0.0075 0.0166 0.6503
Lipid intake (g/day) -0.0099 0.0214 0.6434
Carbohydrate intake (g/day) -0.0001 0.0050 0.9787 Adequacy of energy intake (%) -0.0641 0.0182 < 0.0001
Hematocrit (%) 0.2906 0.2524 0.2510
Hemoglobin (g/dL) 0.3365 0.7163 0.6390
Blood glucose (mg/dL) 0.2136 0.0692 0.0023
Total cholesterol (mg/dL) 0.0214 0.0246 0.3835
LDL-cholesterol (mg/dL) 0.0048 0.0322 0.8811
HDL-cholesterol (mg/dL) -0.1186 0.0740 0.1107
Triglycerides (mg/dL) 0.0559 0.0198 0.0053
β: linear longitudinal regression coeffi cient. BMI: body mass index.
women with excess weight underreported their calorie consumption.
Stulbach et al. 19 evaluated the impact of socio-demographic factors, gestational history, and pre-gestational nutritional status on excess weight gain in pregnancy, and found a high fre-quency, particularly in women with the follow-ing characteristics: more schoolfollow-ing (RR = 1.9; 95%CI: 1.22-2.97), unmarried/without a partner (RR = 1.7; 95%CI: 1.06-2.59), primiparous (RR = 2.1; 95%CI: 1.20-3.85), and pre-gestational over-weight/obesity (RR = 2.0; 95%CI: 1.04-3.92). A recently published study with a similar design and using multilevel analysis identified the effect of schooling, marital status, parity, and baseline BMI on weight gain in pregnant women enrolled in a public prenatal clinic in the city of São Paulo, Brazil 49.
The results of the linear longitudinal regres-sion model in the current study showed an ef-fect on weight gain, particularly from biological and food consumption variables, which may only indirectly reflect the pregnant woman’s so-cioeconomic status, thus partially differing from the findings of Stulbach et al. 19. Meanwhile, the results shown in Tables 3 and 4 showed other as-sociations between total weight gain, income, and smoking.
It is suggested that low schooling and low so-cioeconomic status are associated with increased
risk of insufficient gestational weight gain 2. In the current analysis, lower socioeconomic status of pregnant women, as represented by per capita family income, showed lower total gestational weight gain (10.8kg).
Studies focusing on the association between bodyweight and smoking have produced incon-clusive evidence 50. Smoking and bodyweight show an inverse association, and smokers, espe-cially women, frequently gain weight when they quit the habit. Smoking is known to induce an acute reaction in the metabolic rate that can lead to a reduction in relative food consumption as compared to non-smokers 51. For pregnant wom-en, it has been documented that smokers gain less weight during pregnancy as compared to non-smokers and former smokers 1. Mongoven et al. 52 observed that women who quit smok-ing gained more weight than smokers, regardless of pre-gestational nutritional status. In addition, smokers had a higher risk of low weight gain as compared to those who quit smoking (28% ver-sus 13%) 52. Oslon & Strawderman 53 found an association between smoking and weight gain in pregnancy, whereby women who smoked 1.5 packs a day gained significantly less weight. Hell-erstedt et al. 54 found that smokers showed lower mean weight gain as compared to non-smokers (9.3 and 9.7kg, respectively), when the women were obese at the beginning of pregnancy;
how-Table 6
Final model mixed-effects linear longitudinal regression analysis for weight gain in pregnant women attending a prenatal clinic in Rio de Janeiro, Brazil, 2005-2007.
Fixed effects Estimate (β) Standard error p-value
Intercept 61.7159 9.4001 < 0.0000
Gestational age (weeks) 0.4132 0.0152 < 0.0000 Maternal age (years) 0.6315 0.1473 < 0.0000 Age at menarche (years) -2.3861 0.5209 < 0.0000
Triglycerides (mg/dL) 0.0437 0.0191 0.0231
Blood glucose (mg/dL) 0.1544 0.0654 0.0194
Adequacy of energy intake (%) -0.0642 0.0186 0.0007 -2 Log-likelihood -1.570.3
Akayke Information Criterion (AIC) 3.160.5
Random effects Estimate (95%CI)
σ Intercept 10.9527 (9.8094-12.2292)
σ Gestational age 0.1457 (0.1688-0.1955)
σ Residual 1.2815 (1.2583-1.5189)
ever, women with normal baseline weight gained less weight when they were non-smokers (13.4 versus 15.0kg).
In the current study, smoking was associat-ed with total gestational weight gain. Pregnant women who were former smokers showed the highest total weight gain (13.9kg), followed by smokers (11.7kg) and non-smokers (10.9kg). Our results differ from those of part of the literature, since the current study showed that non-smok-ers gained less weight by the end of pregnancy. One possible explanation for the discordant find-ings is the way the smoking habit was measured, which should have included information on quit-ting, since some women may only have stopped smoking shortly before the first interview.
Losses to follow-up are an important issue for studies with a prospective cohort design, and can thus be considered a potential limitation in the current study. Although care was taken dur-ing the study to minimize this problem, losses by the end of the fourth follow-up interview amounted to 31.8%, consistent with similar studies 19. Meanwhile, no selective losses were observed according to socioeconomic
charac-teristics and pre-gestational nutritional status of women who began follow-up as compared to those who concluded the study. A particularly important aspect of the current study was its sign and analytical approach. A prospective de-sign, for example, allows calculating important indicators like mean gestational weight gain, rarely used due to the difficulty in calculating it. In addition, the use of mixed-effects mod-els is relevant due to the greater precision and the power to detect significant differences as compared to cross-sectional studies or even the results from analyses of variance for repeated measurements 32.
The results of the current study can be ex-pected to be applicable to pregnant women with the same characteristics as this sample. Thus, special attention should be given during prenatal nutritional follow-up for older women, those with early menarche, high serum triglyc-erides and glucose, lower-than-recommended energy consumption for satisfactory weight gain, and specific population sub-groups like former smokers and pregnant women with lower socio-economic status.
Resumo
O objetivo do estudo foi avaliar os fatores determinan-tes da evolução ponderal durante a gestação. Trata-se de uma investigação com desenho do tipo coorte pros-pectiva com quatro ondas de seguimento, composta por 255 gestantes atendidas em pré-natal público da cidade do Rio de Janeiro, Brasil. Utilizou-se o proce-dimento de regressão linear longitudinal com efeitos mistos, tendo como variável dependente o peso aferido em quatro ondas de seguimento, e como independen-tes variáveis demográficas e sócio-econômicas, repro-dutivas, comportamentais e nutricionais. A velocidade média de ganho de peso ponderal foi de 0,413kg por semana de gestação, compatível com o recomendado pelo Institute of Medicine (Estados Unidos). A renda familiar per capita e o hábito de fumar estiveram as-sociados ao ganho de peso total na gestação. O modelo múltiplo de regressão linear longitudinal revelou que a idade (β = 0,6315), menarca (β = -2,3861), triglicé-rides (β = 0,0437), glicose (β = 0,1544) e adequação do consumo energético (β = -0,0642) estiveram associados ao ganho de peso gestacional. Sugere-se atenção espe-cial para esses subgrupos, em decorrência do maior risco de ganho excessivo.
Epidemiologia Nutricional; Ganho de Peso; Gravidez
Contributors
P. L. Rodrigues participated in the data collection, elaboration, statistical analysis, and interpretation and preparation of the final paper. E. M. A. Lacerda col-laborated in the analysis and revision of the final draft. M. M. Schlüssel contributed to the data interpretation and elaboration and revision of the final draft. M. H. C. Spyrides participated in the statistical analysis and critical revision of the final draft. G. Kac participated in all stages of the study, from the planning to the final revision.
Acknowledgements
References
1. Institute of Medicine. Nutrition during pregnancy. Part I: weight gain. Part II: nutrient supplements. Washington DC: National Academies Press; 1990. 2. National Research Council/Institute of Medicine.
Influence of pregnancy weight on maternal and child health: workshop report. Washington DC: National Academies Press; 2007.
3. Amorim AR, Lacerda EMA, Kac G. Uso e interpre-tação dos indicadores antropométricos na avalia-ção do estado nutricional de gestantes. In: Kac G, Sichieri R, Gigante DP, organizadores. Epidemiolo-gia nutricional. Rio de Janeiro: Fundação Oswaldo Cruz/Editora Atheneu; 2007. p. 31-48.
4. World Health Organization. Physical status: the use and interpretation of anthropometry. WHO Expert Committee. Geneva: World Health Organization; 1995. (Technical Report Series, 854).
5. Thame M, Osmond C, Bennett F, Wilks R, Forrester T. Fetal growth is directly related to maternal an-thropometry and placental volume. Eur J Clin Nutr 2004; 58:894-900.
6. Barker D. The best start in life. London: Century Books; 2003.
7. Forsén T, Eriksson JG, Tuomilehto J, Teramo K, Os-mond C, Barker DJP. Mother’s weight in pregnancy and coronary heart disease in a cohort of Finnish men: follow-up study. BMJ 1997; 315:837-40. 8. Thorsdottir I, Torfadottir JE, Birgisdottir BE,
Geirs-son GT. Weight gain in women of normal weight before pregnancy: complications in pregnancy or delivery and birth outcome. Obstet Gynecol 2002; 99:799-806.
9. Schieve LA, Cogswell ME, Scanlon KS, Perry G, Ferre C, Blackmore-Prince C, et al. Prepregnancy body mass index and pregnancy weight gain: as-sociations with preterm delivery. Obstet Gynecol 2000; 96:194-200.
10. Seeds JW, Peng T. Impaired growth and risk of fetal death. Is the tenth percentile the appropriate stan-dard? Am J Obstet Gynecol 1998; 178:658-69. 11. Melo ASO, Assunção PL, Gondim SSR, Carvalho DF,
Amorim MMR, Benício MHDA, et al. Estado nutri-cional materno, ganho de peso gestanutri-cional e peso ao nascer. Rev Bras Epidemiol 2007; 10:249-57. 12. Kac G, Velásquez-Melández G. Ganho de peso
ges-tacional e macrossomia em uma coorte de mães e filhos. J Pediatr (Rio J) 2005; 81:47-53.
13. Kac G, Benício MHDA, Velásquez-Meléndez G, Valente JG, Struchiner CJ. Gestational weight gain and prepregnancy weight influence postpartum weight retention in a cohort of Brazilian women. J Nutr 2004; 134:661-6.
14. Kac G, Benício MHDA, Velásquez-Meléndez G, Va-lente JG. Nine months postpartum weight reten-tion predictors for Brazilian women. Public Health Nutr 2004; 7:661-8.
15. Lacerda EMA, Leal MC. Fatores associados com a retenção e o ganho de peso pós-parto: uma revisão sistemática. Rev Bras Epidemiol 2004; 7:187-200. 16. Nucci LB, Schmidt MI, Duncan BB, Fuchs SC,
Fleck ET, Britto MMS. Nutritional status of preg-nant women: prevalence and associated pregnan-cy outcomes. Rev Saúde Pública 2001; 35:502-7.
17. Abrams B, Altman SL, Pickett KE. Pregnancy weight gain: still controversial. Am J Clin Nutr 2000; 71(5 Suppl):1233S-41S.
18. Caulfield LE, Stoltzfus RJ, Witter FR. Implications of the Institute of Medicine weight gain recom-mendations for preventing adverse pregnancy outcomes in black and white women. Am J Public Health 1998; 88:1168-72.
19. Stulbath TE, Benício MHDA, Andrezza R, Kono S. Determinantes do ganho ponderal excessivo du-rante a gestação. Rev Bras Epidemiol 2007; 10:99-108.
20. Hickey CA. Sociocultural and behavioral influ-ences on weight gain during pregnancy. Am J Clin Nutr 2000; 71(5 Suppl):1364S-70S.
21. Gordon CC, Chumlea WC, Roche AF. Stature, re-cumbent length, and weight. In: Lohman TG, Roche AF, Martorell R, editors. Anthropometric standardization reference manual. Champaign: Human Kinetics Books; 1988. p. 3-8.
22. Takito MY, Benício MHDA, Latorre MRDO. Pos-tura materna durante a gestação e sua influência sobre o peso ao nascer. Rev Saúde Pública 2005; 39:325-32.
23. Ainsworth BE, Haskell WL, Whitt MC, Irwin ML, Swartz AM, Strath SJ, et al. Compendium of physi-cal activities: an update of activity codes and MET intensities. Med Sci Sports Exerc 2000; 32(9 Suppl): S498-516.
24. Chasan-Taber L, Schmidt MD, Roberts DE, Hos-mer D, Markenson G, Freedson PS, et al. Devel-opment and validation of a pregnancy physical activity questionnaire. Med Sci Sports Exerc 2004; 36:1750-60.
25. Sichieri R, Everhart JE. Validity of a Brazilian food frequency questionnaire against dietary re-calls and estimated energy intake. Nutr Res 1998; 18:1649-59.
26. Núcleo de Estudos e Pesquisas em Alimentação, Universidade Estadual de Campinas. Tabela brasi-leira de composição de alimentos. v. 2. Campinas: Universidade Estadual de Campinas; 2006. 27. Instituto Brasileiro de Geografia e Estatística.
Es-tudo Nacional de Despesa Familiar. Rio de Janei-ro: Instituto Brasileiro de Geografia e Estatística; 1981.
28. Agricultural Research Service, U.S. Department of Agriculture. National nutrient database for stan-dard reference, release 18. http://www.nal.usda. gov/fnic/foodcomp/search/ (accessed on 09/ Apr/2007).
29. United Nations University/World Health Organiza-tion/Food and Agriculture Organization. Human energy requirements. Report of a Joint FAO/WHO/ UNU Expert Consultation. Rome: United Nations University/World Health Organization/Food and Agriculture Organization; 2004. (Food and Nutri-tion Technical Report Series, 1).
31. Friedwald WT, Levy RI, Fredrickson DS. Estimation of the concentration of LDL-cholesterol in plasma without the use of a preparative centrifuge. Clin Chem 1972; 18:499-502.
32. Pinheiro JC, Bates DM. Mixed-effects models in S and S-PLUS. New York: Springer Verlag; 2000. 33. Conselho Nacional de Saúde. Resolução nº. 196/96.
sobre pesquisa envolvendo serem humanos. Bioé-tica 1996; 4:415-25.
34. Institute of Medicine. Nutrition during pregnancy and lactation. Washington DC: National Acad-emies Press; 1992.
35. Nucci LB, Duncan BB, Mengue SS, Branchtein L, Schmidt MI, Fleck ET. Assessment of weight gain during pregnancy in general prenatal care services in Brazil. Cad Saúde Pública 2001; 17:1367-74. 36. Andreto LM, Souza AI, Figueroa JN, Cabral Filho
JE. Fatores associados ao ganho ponderal exces-sivo em gestantes atendidas em um serviço públi-co de pré-natal na cidade de Recife, Pernambupúbli-co, Brasil. Cad Saúde Pública 2006; 22:2401-9. 37. Atalah E, Castillo C, Castro R, Aldea A. Propuesta
de un nuevo estándar de evaluación nutricional en embarazadas. Rev Med Chile 1997; 125:1429-36. 38. Han TS, Bijnen FCH, Lean MEJ, Seidell JC.
Sepa-rate associations of waist and hip circumference with lifestyle factors. Int J Obes 1998; 27:422-30. 39. Ximenes FMA, Oliveira MCR. A influência da idade
materna sobre as condições perinatais. Rev Bras Promoção Saúde 2004; 17:56-60.
40. van Lenthe FJ, Kemper CG, van Mechelen W. Rapid maturation in adolescence results in greater obe-sity in adulthood: The Amsterdam Growth and Health Study. Am J Clin Nutr 1996; 64:18-24. 41. Helm P, Munster K, Schmidt L. Recalled menarche
in relation to infertility and adult weight and height. Acta Obstet Gynecol Scand 1995; 74:718-22. 42. Freedman DS, Khan LK, Serdula MK, Dietz WH,
Srinivasan SR, Berensn GS. The relation of men-arche age to obesity in childhood and adulthood: the Bogalusa heart study. BMC Pediatrics 2003. http://www.biomedcentral.com/1471-2431/3/3 (accessed on 09/Jan/2008).
43. Must A, Naumova EN, Phillips SM, Blum M, Daw-son-Hughes B, Rand WM. Childhood overweight and maturational timing in the development of adult overweight and fatness: The Newton girls study and its follow-up. Pediatrics 2005; 116:620-7.
44. Gunderson EP, Abrams B, Selvin S. The relative im-portance of gestational gain and maternal charac-teristics associated with the risk of becoming over-weight after pregnancy. Int J Obes 2000; 24:1660-8. 45. Kac G, Velásquez-Meléndez G, Valente JG. Menar-ca, gravidez precoce e obesidade em mulheres brasileiras selecionadas em um Centro de Saúde de Belo Horizonte, Minas Gerais, Brasil. Cad Saúde Publica 2003; 19 Suppl 1:S111-8.
46. Butte NF. Carbohydrate and lipid metabolism in pregnancy: normal compared with gestation-al diabetes mellitus. Am J Clin Nutr 2000; 71(5 Suppl):1256S-61S.
47. Saldana TM, Siega-Riz AM, Adair LS, Suchindran C. The relationship between pregnancy weight gain and glucose tolerance status among black and white women in central North Carolina. Am J Obstet Gynecol 2006; 195:1629-35.
48. Bo S, Menato G, Signorile A, Bardelli C, Lezo A, Gallo ML, et al. Obesity or diabetes: what is worse for the mother and for the baby? Diabetes Metab 2003; 29(2 Pt 1):175-8.
49. Konno SC, Benício MHDA, Barros AJD. Fatores as-sociados à evolução ponderal de gestantes: uma análise multinível. Rev Saúde Pública 2007; 41:995-1002.
50. Lahti-Koski M, Pietinen P, Heliövaara M, Vartiain-en E. Associations of body mass index and obesity with physical activity, food choices, alcohol intake, and smoking in the 1982-1997 FINRISK Studies. Am J Clin Nutr 2002; 75:809-17.
51. Bray GA. Contemporary diagnosis and manage-ment of obesity. Newtown: Handbooks in Health Care; 1998.
52. Mongoven M, Dolan-Mullen P, Groff JY, Nicol L, Burau K. Weight gain associated with prenatal smoking cessation in white, non-Hispanic women. Am J Obstet Gynecol 1996; 174:72-7.
53. Olson CM, Strawderman MS. Modifiable behav-ioral factors in a biopsychosocial model predict inadequate and excessive gestational weight gain. J Am Diet Assoc 2003; 103:48-54.
54. Hellerstedt WL, Himes JH, Story M, Alton IR, Ed-wards LE. The effects of cigarette smoking and ges-tational weight change on birth outcomes in obese and normal-weight women. Am J Public Health 1997; 87:543-4.
Submitted on 31/Jan/2008