REVISTA PAULISTA
DE PEDIATRIA
Rev Paul Pediatr. 2015;33(2):251–253www.rpped.com.br
1984-1462/© 2015 Sociedade de Pediatria de São Paulo. Published by Elsevier Editora Ltda. All rights reserved.
ERRATUM
Erratum of ‘‘Physical, clinical, and psychosocial
parameters of adolescentes with different degrees
of excess weight’’
Errata de ‘‘Parâmetros físicos, clínicos e psicossociais
de adolescentes com diferentes graus de excesso de peso’’
Vanessa Drieli Seron Antonini*, Danilo Fernandes da Silva,
Josiane Aparecida Alves Bianchini, Carlos Andres Lopera, Amanda Caroline Moreira,
João Carlos Locateli, Nelson Nardo Junior
Universidade Estadual de Maringá (UEM), Maringá, PR, Brazil
DOI of original articles: http://dx.doi.org/10.1016/j.rpped.2015.03.004, http://dx.doi.org/10.1016/j.rpped.2014.04.003 *Corresponding author.
E-mail: [email protected] (V.D.S. Antonini).
Dear editor,
We hereby provide the correct results of Tables 2 and 3 of our article entitled “Physical, clinical, and psychosocial parameters of adolescents with different degrees of excess weight”, published in Revista Paulista de Pediatria, 32(4):342-50,2014.1 Analyzing and discussing our findings,
we observed that the body composition results were not consistent with the anthropometric data analyzed. Checking our spreadsheet, we noticed that there was a misconfigu-ration that mixed information between groups, affecting the results of Tables 2 and 3, related to health-related physical fitness (HRPF) and health-related quality of life (HRQoL) variables.
Therefore, we corrected the tables as we believe them to be highly relevant and having important practical impli-cations, particularly regarding the management of treat-ment programs for adolescents with excess weight,
consid-ering the parameters that are different and the ones that are not, among the different degrees of excess weight.
Following the introduction and methods shown in Antonini et al.,1 we reinforce that variable results shown in Table 1
are correct and should be read and interpreted as they are. Table 2 shows the corrected values for body composition variables and HRPF and Table 3 shows the corrected results for the HRQoL domains.
The main findings of these tables show that cardiorespi-ratory fitness, abdominal strength/resistance and body composition worsened as the degree of excess weight increased. The HGS showed an inverse behavior, as higher values were observed in the group with severe obesity. When separated by gender for analysis, the results were similar. There was no significant difference regarding flexi-bility. Antonini et al.,1 reinforce that, regardless of the
252 Antonini VDS et al.
groups had not been identified at that time. However, after correcting these analyses, we still reinforce the need to improve HRPF of adolescents with all excess weight degrees, as they have lower values than those observed in their peers with normal weight.2 However, considering the clinical
importance of some of these parameters, such as cardiore-spiratory fitness, it is important to highlight the even lower scores in the group with severe obesity. Taking into account that these values are very low, the intervention process may become longer and treatment strategies may need to be adapted to better fit the reality of these adolescents.
Differences were also observed in relation to body com-position, in which the amount of body fat (absolute (kg)
and relative (%)) increased with the degree of excess weight. The absolute lean mass (in kg, determined accord-ing to our bioimpedance assessment model (InBody, model 520), the fat-free mass, without the addition of bone mass) also increased according to the degree of excess weight; however, when assessed in relation to body weight (%), the results were the opposite.
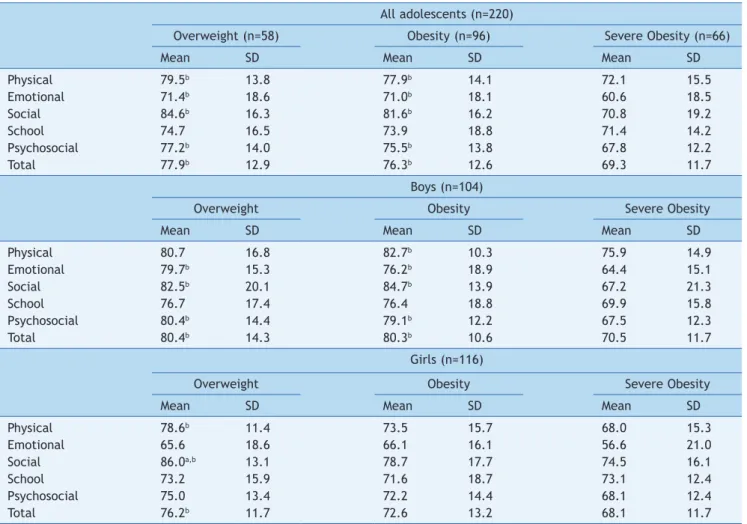
In relation to HRQoL, the results showed that the group with severe obesity had worse scores for the physical, emo-tional, social, psychosocial and overall domains. No differ-ence was observed for the school domain. When separated by gender, these same differences were similar for boys; however, for girls the physical, social, and overall areas
Table 2 Comparison of adolescents with overweight, obesity and severe obesity, for the variables health-related physical
itness and body composition (n=104 for boys and 116 for girls).
All adolescents (n=220)
Overweight (n=58) Obesity (n=96) Severe Obesity (n=66)
Mean SD Mean SD Mean SD
Abdominal (rep) 23.5b,c 7.2 20.1c 10.2 13.6 9.1
Flexibility (cm) 23.8 9.3 23.7 9.6 21.3 8.8
HGS (kgf)a 27.0c 7.6 27.3c 7.9 30.8 7.0
VO2max (mL/kg/min) 28.7 b,c 7.7 25.9c 5.1 22.5 3.7
Body Fat (%) 38.8 b,c 6.7 42.6c 6.1 48.8 4.7
Body Fat (kg) 24.6 b,c 5.6 32.1c 6.4 45.5 7.4
Lean Mass (%) 57.8 b,c 6.1 54.3c 5.7 48.6 4.5
Lean Mass (kg) 37.5 b,c 6.3 42.0c 9.1 46.4 8.4
Boys (n=104)
Overweight Obesity Severe Obesity
Mean SD Mean SD Mean SD
Abdominal (rep) 25.5c 8.8 21.9c 10.6 14.9 9.3
Flexibility (cm) 19.2 8.0 21.1 8.8 17.8 6.5
HGS (kgf)a 27.2c 6.8 29.7 9.3 33.4 7.1
VO2max (mL/kg/min) 28.1c 5.8 28.0c 5.9 23.9 4.5
Body Fat (%) 36.3 b,c 7.2 40.5c 6.3 47.7 5.1
Body fat (kg) 23.1 b,c 6.1 30.4c 5.8 44.9 7.2
Lean Mass (%) 60.6 b,c 6.7 56.4c 5.9 49.7 4.9
Lean Mass (kg) 39.8c 7.6 44.0 11.3 48.2 9.9
Girls (n=116)
Overweight Obesity Severe Obesity
Mean SD Mean SD Mean SD
Abdominal (rep) 22.1c 5.4 18.4c 9.7 12.3 8.8
Flexibility (cm) 27.0 8.8 26.1 9.8 25.1 9.5
HGS (kgf)a 27.0 8.2 25.3 5.8 27.0 5.0
VO2max (mL/kg/min) 29.1 b,c 8.9 24.0c 3.4 21.0 1.6
Body Fat (%) 40.6 b,c 5.7 44.6c 5.3 49.9 3.9
Body Fat (kg) 25.6 b,c 5.0 33.7c 6.6 46.1 7.7
Lean Mass (%) 55.9 b,c 4.9 52.4c 4.8 47.4 3.7
Lean Mass (kg) 35.9 b,c 4.6 40.2c 6.1 44.4 5.9
HGS, Handgrip strength; VO2max, maximal oxygen consumption.
a The n in the group of overweight adolescents was 45 (26 girls); the n in the obesity group was 59 (32 girls) and in the group of
severely obesity was 39 (16 girls) for this variable.
Erratum of ‘‘Physical, clinical, and psychosocial parameters of adolescentes with different degrees of excess weight’’ 253
were higher in the overweight group in relation to the severely obesity group. Moreover for the social domain, the group with obesity also had lower scores than the group with overweight. In Antonini et al.,1 we had suggested that
the degree of excess weight might not influence HRQoL. This is partially correct when comparing adolescents with overweight and obesity. The group with severe obesity, on the other hand, had lower scores in almost all areas, which makes them more susceptible to problems such as depres-sion, anxiety and low self-esteem.3
These results must be taken into consideration during intervention programs, and reinforce the attention that should be given to adolescents with excess weight, espe-cially those with severe obesity, which show higher nega-tive impacts than the other excess weight groups. As the classification of severe obesity proposed by Cole and Lobstein4 is relatively new for children and adolescents, it
is suggested that future studies should demonstrate the
results of interventions on health parameters in this specif-ic group, aiming to contribute to better treatment manage-ment in this population, for both genders.
References
1. Antonini VDS, Da Silva DF, Bianchini JAA, Lopera CA, Moreira ACT, Locateli JC, et al. Physical, clinical and psychosocial parameters of adolescents with different degrees of excess weight. Rev Paul Pediatr. 2014;32:342-50.
2. Aires L, Silva P, Santos R, Santos P, Ribeiro JC, Mota J.
Association of physical itness and body mass index in youth. Minerva Pediatr. 2008;60:397-405.
3. Shin NY, Shin MS. Body dissatisfaction, self-esteem, and
depression in obese Korean children. J Pediatr. 2008;152:502-6.
4. Cole TJ, Lobstein T. Extended international (IOTF) body mass index cut-offs for thinness, overweight and obesity. Pediatr
Obes. 2012;7:284-94.
Table 3 Comparison of overweight, obese and severely obese adolescents, concerning health-related quality of life (n=104 for
boys and 116 for girls).
All adolescents (n=220)
Overweight (n=58) Obesity (n=96) Severe Obesity (n=66)
Mean SD Mean SD Mean SD
Physical 79.5b 13.8 77.9b 14.1 72.1 15.5
Emotional 71.4b 18.6 71.0b 18.1 60.6 18.5
Social 84.6b 16.3 81.6b 16.2 70.8 19.2
School 74.7 16.5 73.9 18.8 71.4 14.2
Psychosocial 77.2b 14.0 75.5b 13.8 67.8 12.2
Total 77.9b 12.9 76.3b 12.6 69.3 11.7
Boys (n=104)
Overweight Obesity Severe Obesity
Mean SD Mean SD Mean SD
Physical 80.7 16.8 82.7b 10.3 75.9 14.9
Emotional 79.7b 15.3 76.2b 18.9 64.4 15.1
Social 82.5b 20.1 84.7b 13.9 67.2 21.3
School 76.7 17.4 76.4 18.8 69.9 15.8
Psychosocial 80.4b 14.4 79.1b 12.2 67.5 12.3
Total 80.4b 14.3 80.3b 10.6 70.5 11.7
Girls (n=116)
Overweight Obesity Severe Obesity
Mean SD Mean SD Mean SD
Physical 78.6b 11.4 73.5 15.7 68.0 15.3
Emotional 65.6 18.6 66.1 16.1 56.6 21.0
Social 86.0a,b 13.1 78.7 17.7 74.5 16.1
School 73.2 15.9 71.6 18.7 73.1 12.4
Psychosocial 75.0 13.4 72.2 14.4 68.1 12.4
Total 76.2b 11.7 72.6 13.2 68.1 11.7