Comparison of two extraoral radiographic
techniques used for nasopharyngeal airway
space evaluation
Mariana de Aguiar Bulhões Galvão*, Marco Antonio de Oliveira Almeida**
Objectives: The goal of this research was to compare lateral cephalometric radiography and cavum radiography in nasopharyngeal airway space evaluation. Methods: The sample of this study consisted of 36 Brazilian mouth breathing children, no racial distinction, with ages ranging from 5 to 12. These children were selected in Recife/PE, Brazil (2005) and divided into 6 groups. In each group, the radiographs were taken on the same day. The sample was composed of 72 radiographs, 36 lateral cephalometric and 36 cavum. Results: The results were based on the Schulhof method and, at the end, an Index representing a summary of all measurements taken was calculated. Student paired t-test, chi-square, Pearson correla-tion and Kappa index scores were calculated to analyze the results. Only the values of the Airway Occupation Percentage were significantly different (p = 0.006) among the analyzed radiographs. A high degree of correlation was found for all measurements, including the Index values. Conclusions: It can be concluded that, both the lateral cephalometric radiog-raphy and the cavum radiogradiog-raphy can be used for nasopharyngeal airway space evaluation. Abstract
Keywords: Adenoids. Nasopharynx. Radiography.
* Specialist in Orthodontics, FOP-UPE. MSc in Orthodontics, UERJ. ** Head Professor of Orthodontics, FO/UERJ. MSc in Orthodontics, UFRJ. INTRODUCTION
Adenoid hypertrophy is very common in children and usually occurs between 2 and 12 years of age, reducing or preventing nasal breathing.11,14 This problem has been
associ-ated with several diseases, such as acute otitis
media, secretory otitis media, increase of the middle turbinates, septal deviation, obstructive sleep apnea syndrome and chronic recurrent pharyngeal infections.8,11 There is also an
clearly defined whether it is the upper airway obstruction that leads to dentofacial deformi-ties, or the existence of such deformities that leads to the airway deficiencies, the right diag-nosis of the coexistence of both abnormalities is necessary, mainly to allow a good orthodontic treatment plan.
Due to the difficulty of establishing a defini-tive diagnosis only by clinical examinations, phy-sicians and dentists use auxiliary exams to help the diagnosis of oral breathing. The additional routine examination for the child with a clinical diagnosis of adenoid hypertrophy is the radio-graphic examination.
Cavum radiograph is used by otorhinolarin-gologists, while orthodontists use lateral cepha-lometric radiography. Although they are distinct X-rays, they have the same purpose in nasopha-ryngeal airway space evaluation.
A mouth-breathing patient requires a mul-tidisciplinary approach in their treatment, mainly involving otorhinolaringologists and or-thodontists, so the comparison of these two ra-diographs would help to determine differences that may exist between the two radiographic techniques, considering the positive and nega-tive factors, and probably avoiding the duplica-tion of radiographs.
The purpose of the present study is to com-pare the lateral cephalometric radiographs, used by orthodontists, and cavum radiographs, used by otorhinolaringologists, taken from mouth-breathing patients in order to:
1. Statistically compare the data obtained for the percentage of the airway space occu-pied by the adenoid tissue and the linear mea-surements in the assessment of nasopharyn-geal airway space.
2. Evaluate the correlation of these values in both radiographic techniques.
3. Establish whether only one of the radio-graphic techniques could satisfy both orthodon-tists and otorhinolaringologists.
MATERIAL AND METHODS
The anamnesis of 150 children, 67 girls and 83 boys was held by a single examiner, an or-thodontist, in the Dental Clinic of Orthodontic Study Group (Ortogeo), in Recife/PE, Brazil. All children have Brazilian nationality, ages ranging from 5 to 12 years, without racial distinction, residents of the metropolitan area of Recife (PE).
The children were selected from three Den-tal Clinics: DenDen-tal Clinic of the Military Police of Pernambuco, Dental Clinic of Padre Antonio Manoel Hospital (Mirueira Hospital) and the Dental Clinic of Ortogeo.
Data regarding medical history were regis-tered on a form specially designed for this study, including, besides personal identification data, questions related to the exclusion and inclusion of children in this study.
Were excluded patients according to the fol-lowing criteria:
- Wearing orthodontic appliance; - Taking any kind of medicine regularly; - Had the adenoids removed;
- Had any congenital anomaly.
The inclusion criterion was the presence of mouth breathing habit. Initially, we considered to be mouth breathing those patients whose parents or guardians reported that their children were mouth breathers. Of a total of 150 children assessed, only 36 (21 boys and 15 girls) met the inclusion criteria established in this study.
The Ethical Committee of Pedro Ernesto University Hospital approved the study (nº 1082, CEP / HUPE) and also the Ethical Committee of Restauração Hospital (nº 0005.1.102.000-05). This study was registered in the SISNEP (Na-tional system of ethics in research).
A speech therapist examined all the pa-tients. In the clinical examination the position of the lips, tongue and cheeks was observed, and speech-language tests were used to investigate proper speaking, breathing, chewing and swal-lowing. The results confirmed that 36 children were indeed mouth breathers.
In the next step, the radiographs of all the patients were taken on the same day using both extraoral radiographic techniques: Lateral cephalometric radiographs and cavum radio-graphs. To allow this, the patients were divided into six groups of six children each.
The lateral cephalometric radiographs were taken in the Radiology Clinic Radioface, Unit Der-by in Recife (PE) and the standards for radiography were those described by Broadbent in April 1931.4
The cavum radiographs were taken in the Restauração Hospital and the standards for ra-diography were those described by Bontrager in March 2003.3
Demarcation of the cephalometric points and collection of the assessed measurements
All 72 radiographs were scanned in the Radio-face Radiology Clinic by a single operator, a radiol-ogy technician, using the Epson Expression 1680 scanner. They were scanned with a 150 dpi resolu-tion and processed in the CefX for Windows (CDT Company - Consultoria, Desenvolvimento, Treina-mento em Informática Ltda., Cuiabá - MT, Brazil) cephalometric program. Using the same program, the cephalometric points were located in the 72 im-ages, using the mouse, by another radiology special-ist. Then, the same program generated the cepha-lometric and radiographic analysis of the adenoids.
The analysis used to evaluate the nasopha-ryngeal airway space was described by Schul-hof.22 This analysis combines four cephalometric
measurements used in the analysis of the naso-pharyngeal region forming a system of four fac-tors for assessing the nasopharyngeal airspace.
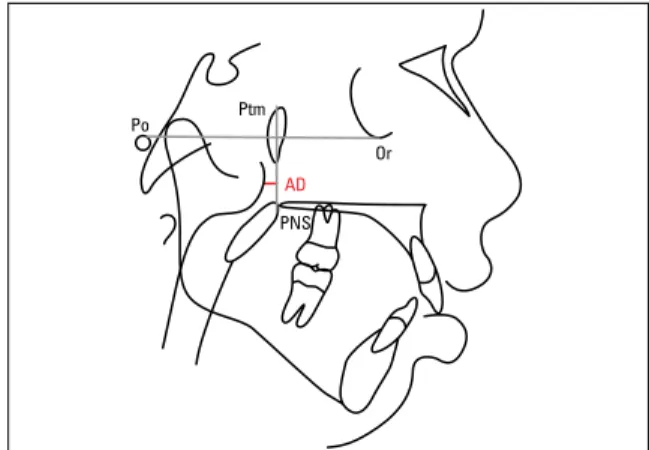
The first factor described by Handelman and
Osborne,10 corresponds to the percentage of
air-way occupied by adenoid tissue in the nasophar-ynx area (Fig 1).
The second factor was described by Linder-Aronson and Henrikson15 and it is represented
by the distance from the point AD1 to the pos-terior nasal spine (D-AD1:PNS) (Fig 2).
The third factor, also described by Linder-Aronson and Henrikson,15 represents the linear
distance from the point AD2 to the posterior nasal spine (D-AD2:PNS) (Fig 3).
The fourth factor described by Schulhof22 is
represented by the linear distance from point AD to a point of pterygoid vertical line 5 mm above the posterior nasal spine (D-PTV:AD) (Fig 4).
Radiograph report
After measuring lateral cephalometric ra-diographs and cavum rara-diographs, a comput-erized report of the nasopharyngeal airway analysis was printed.
According to the CefX program, the assess-ment of each measureassess-ment would be (Table 1):
• Large space: when the percentage of space occupied by adenoid was lower than the normal range in the first factor and the distance was greater than the normal range in the second, third and fourth factors.
• Normal: when the measurement found in the analysis was within normal limits.
• Localized obstruction: when the percentage of space occupied by adenoid was larger than the normal range in the first factor and the distance was shorter than the normal range in the second, third and fourth factors.
At the end of the computerized report an Index representing a summary of all the factors was emitted by the CefX. This Index ranged from 0 to 4:
• 0 and 1: No adenoid hypertrophy problems;
• 2: Possible adenoid hypertrophy problem;
• 3: Probable adenoid hypertrophy problem;
Ba
Ba So
S
Or Ptm
Po
AD1
AD2 AD
were outside the normal range and, finally, In-dex 4 means all four measures were out of the normal range.
Method errors
To calculate the intra-operator method er-ror, all procedures for the nasopharyngeal air-way space analysis were performed in ten lateral cephalometric radiographs and ten cavum radio-graphs. Starting with the scanning and ending with obtaining the radiographic measurements. These operations were repeated three times with a five-day interval between each essay. The results were statistically analyzed to verify the Kappa index score.
FIGURE 1 - Schematic drawing of the first factor (percentage of air-way occupied by adenoid tissue), represented in red.
FIGURE 3 - Schematic drawing of the third factor (D-AD2:PNS) repre-sented by the red line.
FIGURE 2 - Schematic drawing of the second factor (D-AD1:PNS) repre-sented by the red line.
FIGURE 4 - Schematic drawing of the fourth factor (D-PTV:AD) repre-sented by the red line.
TABLE 1 - Interpretation of nasopharyngeal airway space radiographic evaluation.
RESULT 1st FACTOR 2nd, 3rd and 4th FACTORS
Large space Values lower than the standard Values greater than the standard
Normal space Values equal to the standard Values equal to the standard
Localized obstruction
Values greater than the standard
Values lower than the standard
A zero Index means that all examined mea-sures were within normal limits; Index 1 means only one measure was out of the normal range; Index 2 means two measures were out of the normal range; Index 3 means three measures
PNS
The result showed an excellent intra-opera-tor agreement level. The Kappa index score of agreement for the assessment of intra-operator test was k = 0.89 (Table 2).
Statistical Analysis
In the statistical analysis of results, paired t-test and chi-square (X2) were performed. The
computations were performed using the SPSS statistical software (Statistical Package for So-cial Sciences) version 14.0 for Windows operat-ing system (SPSS Inc, Chicago, IL.).
This research adopted a 5% probability sig-nificance level (p <0.05).
RESULTS
Statistical evaluation of results
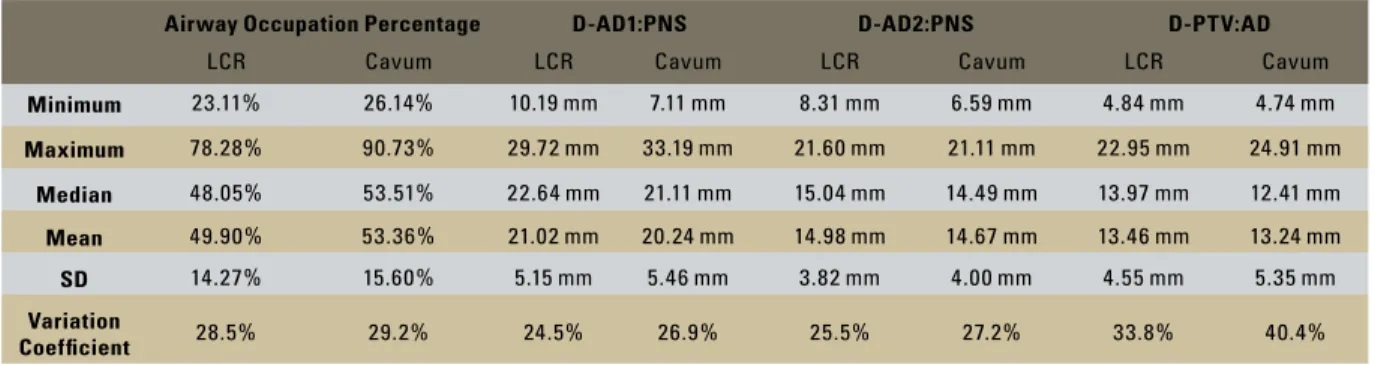
After obtaining the measurements, the minimum and maximum values, medians, standard deviations, and coefficient of varia-tion of variables (percentage of airway space, D-AD1:PNS, D-AD2:PNS, D-PTV:AD) were calculated (Table 3).
When the paired t-test was applied, a sta-tistically significant difference between the lat-eral cephalometric radiographs and cavum (p = 0.006) was found, on data obtained from the percentage of airway space analysis.
For the others variables (D-AD1:PNS, D-AD2: PNS and D-PTV:AD) the paired t-test showed no statistically significant difference between the
two radiographic techniques and the values of p = 0.05, p = 0. 25 and p = 0.62, respectively.
The Pearson correlation coefficient was used with the objective of correlating the values ob-tained from lateral cephalometric radiographs and cavum radiographs.
In all variables, the results of the correlation coefficient showed that there was a high corre-lation (Table 4).
In the statistical analysis of the variable In-dex, chi-square (X2) was applied to compare the
frequency distribution of this variable on lateral cephalometric and cavum radiographs. It was observed that there was no statistical significant difference in this variable in both x-rays in na-sopharyngeal airway space analysis (p = 0.71).
The Kappa index score was used to check the degree of agreement of values obtained in the variable Index and the value obtained was good (k = 0.63), according to the values listed in Table 2.
Table 5 shows the percentages of the Index variable in the lateral cephalometric radiographs and cavum radiograph.
DISCUSSION
There are several causes to nasal obstruc-tion: nasal septum deviation, tonsils and ad-enoids hypertrophy and increase of the middle turbinates.8,19 However, there is a consensus in
the literature that adenoid hypertrophy is the most important etiological factor that induces nasal obstruction.9,17,19,24
The accuracy of radiographic methods for the assessment of nasopharyngeal airway space has been questioned, due to the static two-di-mensional viewing generated by radiographs for the evaluation of a three-dimensional dynamic structure. Several studies have shown a signifi-cant correlation between the results obtained in the radiographic evaluation and those obtained in the clinical evaluation,20 in the direct
obser-vation during surgery,6 in posterior rhinoscopy14
and nasal endoscopy.12,18,25
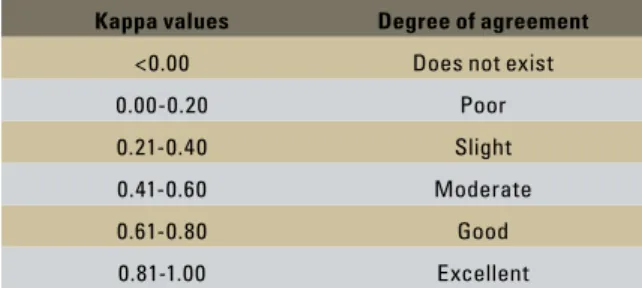
TABLE 2 - Values used for the interpretation of the Kappa agreement index, according to Landis and Koch.13
Kappa values Degree of agreement
<0.00 Does not exist
0.00-0.20 Poor
0.21-0.40 Slight
0.41-0.60 Moderate
0.61-0.80 Good
Airway Occupation Percentage D-AD1:PNS D-AD2:PNS D-PTV:AD
LCR Cavum LCR Cavum LCR Cavum LCR Cavum
Minimum 23.11% 26.14% 10.19 mm 7.11 mm 8.31 mm 6.59 mm 4.84 mm 4.74 mm
Maximum 78.28% 90.73% 29.72 mm 33.19 mm 21.60 mm 21.11 mm 22.95 mm 24.91 mm
Median 48.05% 53.51% 22.64 mm 21.11 mm 15.04 mm 14.49 mm 13.97 mm 12.41 mm
Mean 49.90% 53.36% 21.02 mm 20.24 mm 14.98 mm 14.67 mm 13.46 mm 13.24 mm
SD 14.27% 15.60% 5.15 mm 5.46 mm 3.82 mm 4.00 mm 4.55 mm 5.35 mm
Variation
Coeficient 28.5% 29.2% 24.5% 26.9% 25.5% 27.2% 33.8% 40.4%
TABLE 3 - Minimum and maximum values, medians, means, standard deviations and variation coefficients of continuous variables.
TABLE 4 - Values obtained in the linear correlation statistical analysis for the variables used in this study.
Variables % airway
space D-AD1:PNS D-AD2:PNS D-PTV:AD
Correlation r = 0.89 r = 0.90 r = 0.91 r = 0.87
TABLE 5 - Percentage of Index variable in the lateral cephalometric ra-diography and cavum rara-diography.
RADIOG-RAPHY
INDEX
0 1 2 3 4
LCR 63.89% 13.89% 5.55% 13.89% 2.78%
Cavum 72.22% 5.55% 2.78% 13.89% 5.56%
The big difference between the lateral ceph-alometric radiography and the cavum radio-graph is that the former uses the cephalostat to stabilize the patient’s head. In the cavum radi-ography, the absence of the cephalostat during the procedure allows the patient to change the head position and requires more attention from the radiology technician.
According to Oliveira, Anselmo-Lima and Souza19 and Malkoc et al,16 a slight change in the
patient’s head position while the radiologic ex-amination is performed could lead to important changes in the distances between the structures involved to assess the degree of obstruction of
nasopharyngeal airway space.
In this research, two different radiographic techniques were used to evaluate the nasopha-ryngeal airway space, and not the size of the adenoids, because there is a consensus among authors that it is not the size of adenoids that should be evaluated, but rather the space in which it is inserted.5,7,15,21,23
The Schulhof22 analysis was used in this
study because it combines four cephalometric measurements, used in the nasopharyngeal re-gion analysis, forming a system of four factors for assessing the nasopharyngeal airspace.
Regarding the data obtained through the evaluation of nasopharyngeal airway space, the averages of the D-AD1:PNS, D-AD2:PNS and D-PTV:AD were within the limits of na-sal breathing according to Haldelman and Os-borne;10 Linder-Aronson14 and Schullof.22 But
our aim was not to verify the presence or absence of adenoid hypertrophy, but rather, to compare two radiographic methods used to measure the nasopharyngeal airway space.
The use of lateral radiographs in nasopharyngeal airway space evaluation is a practical and simple way to diagnose nasopharynx obstruction. Besides, it’s a simple and low-cost available technique.1,2
Since studies comparing the two techniques used in this research were not found in the literature, it’s essential that new studies us-ing the Schullof22 method or other methods of
LCR = lateral cephalometric radiographs.
nasopharyngeal airway space measurement be compared with the results found in this research.
CONCLUSION
Based on the results of this research, it can be concluded that:
1. Only in the percentage of airway occu-pied by adenoid tissue there were significant differences between lateral cephalometric ra-diographs and cavum rara-diographs. However, in the other measures (linear variable D-AD1:PNS, D-AD2:PNS, D-PTV:AD) and the Index there were no statistically significant differences be-tween the two radiographic techniques.
2. A high degree of correlation was found in all variables used to analyze the nasopharyngeal airway space in both radiographs, demonstrating equivalence between the two techniques.
3. For the nasopharyngeal airway space analy-sis, the lateral cephalometric radiograph or the cavum radiograph satisfy the needs of both or-thodontists and otorhinolaryngologists.
ACKNOWLEDGMENTS
The authors would like to thank Dr. Tatiana de Aguiar Bulhões and the Research Centers Or-togeo, Restauração Hospital and Radioface that made possible the execution of this research.
1. Araújo SA Neto, Queiroz SM, Baracat ECE, Pereira IMR.
Avaliação radiográica da adenóide em crianças: métodos de mensuração e parâmetros da normalidade. Radiol Bras. 2004; 37(6):445-8.
2. Battagel JM, Johal A, Kotecha B. A cephalometric comparison of subjects with snoring and obstructive sleep apnoea. Eur J Orthod. 2000 Aug;22(4):353-65.
3. Bontrager KL. Crânio e ossos do crânio. In: Bontrager KL. Tratado de técnica radiológica e base anatômica. 5ª ed. Rio de Janeiro: Guanabara Koogan; 2003. cap.12, p.353-376.
4. Broadbent BH. A new X-ray technique and its application to orthodontia. Angle Orthod. 1931 Apr;1(2):45-66.
5. Cohen D, Konak S. The evaluation of radiographs of the nasopharynx. Clin Otolaryngol Allied Sci. 1985 Apr;10(2):73-8. 6. Cohen LM, Koltai PJ, Scott JR. Lateral cervical radiographs
and adenoid size: do they correlate? Ear Nose Throat J. 1992 Dec;71(12):638-42.
7. Dunn GF, Green LJ, Cunat JJ. Relationships between variation of mandibular morphology and variation of nasopharyngeal airway size in monozygotic twins. Angle Orthod. 1973 Apr;43(2):129-35.
REFERENCES
8. Slie RD, Massler M, Zwemer JD. Mouth breathing: etiology and effects (a review). J Am Dent Assoc. 1952 May;44(5):506-21.
9. Gonçalves M, Haiter F Neto, Gonçalves A, Almeida SM. Avaliação radiográica da cavidade nasofaríngea em indivíduos com idades entre quatro e dezoito anos. Rev Odontol Univ São Paulo. 1996 jan-mar;10(1):1-7.
10. Handelman CS, Osborne G. Growth of the nasopharynx and adenoid development from one to eighteen years. Angle Orthod. 1976 July;46(3):243-59.
11. Hungria H. Otorrinolaringologia. 8ª ed. Rio de Janeiro: Guanabara Koogan; 2000. cap. 19, p. 167-70. 12. Ianni D Filho, Bertolini MM, Lopes ML. Hipertroia das
adenóides e espaço aéreo nasofaringeano livre: estudo comparativo entre telerradiograia cefalométrica lateral e videoendoscopia nasofaringeana. Rev Soc Bras Ortod. 2005 jul-dez;5(1):29-37.
20. Paradise JL, Bernard BS, Colborn DK, Janosky JE. Assessment of adenoidal obstruction in children: clinical signs versus roentgenographic indings. Pediatrics. 1998 Jun;101(6):979-86. 21. Ricketts RM. The cranial base and soft structures in cleft
palate speech and breathing. Plast Reconstr Surg (1946). 1954 Jul;14(1):47-61.
22. Schulhof RJ. Consideración de la vía aérea en Ortodoncia. In: Ricketts RM, Berch RW, Gugino CF, Hilgers J, Schulhof RJ. Técnica bioprogressiva de Ricketts. 2ª ed. Buenos Aires: Panamericana; 1998. cap. 2, p. 360-4.
23. Sorensen H, Solow B, Greve E. Assessment of the
nasopharyngeal airway. A rhinomanometric and radiographic study in children with adenoids. Acta Otolaryngol. 1980 Mar-Apr;89(3-4):227-32.
24. Subtelny JD. The signiicance of adenoid tissue in orthodontia. Angle Orthod. 1954 Apr;24(2):59-69.
25. Vasconcelos OV, Souza VB, Agneta K, Ianni D Filho, Monteiro
AA, Koch HA. Evaluation of the nasopharyngeal free airway space based on lateral cephalometric radiographs and endoscopy. Orthodontics. 2004;1(3):215-23.
Contact address
Mariana de Aguiar Bulhões Galvão
Av. Dr. Alberto Benedetti, 348, sala 01, Vila Assunção CEP: 09.030-340 – Santo André / SP, Brazil
E-mail: [email protected]
Submitted: December 2006 Revised and accepted: January 2007 14. Linder-Aronson S. Adenoids: their effect on mode of breathing
and nasal airlow and their relationship to characteristics of the facial skeleton and dentition. Acta Otolaryngol Suppl. 1970;265:1-132.
15. Linder-Aronson S, Henrikson CO. Radiocephalometric analysis of anteroposterior nasopharyngeal dimensions in 6 to 12 year-old mouth breathers compared with nose breathers. ORL J Otorhinolaryngol Relat Spec. 1973;35(1):19-29.
16. Malkoc S, Sari Z, Usumez S, Koyuturk AE. The effect of head rotation on cephalometric radiographs. Eur J Orthod. 2005 Jun;27(3):315-21.
17. Mocellin M, Faria JG. Respirador bucal. In: Sih T.
Otorrinolaringologia pediátrica. Rio de Janeiro: Revinter; 1998. cap.54, p.290-4.
18. Monteiro ECM, Pilon RR, Dall’Oglio GP. Estudo da hipertroia adenoideana: endoscopia x radiograia de nasofaringe. Rev Bras Otorrinolaringol. 2000 jan-fev;66(1):9-12.