ON L I N E AR T I C L E*
Dental Press J Orthod 40 2010 Sept-Oct;15(5):40-1 * Access www.dentalpress.com.br/journal to read the full article.
Editor’s summary
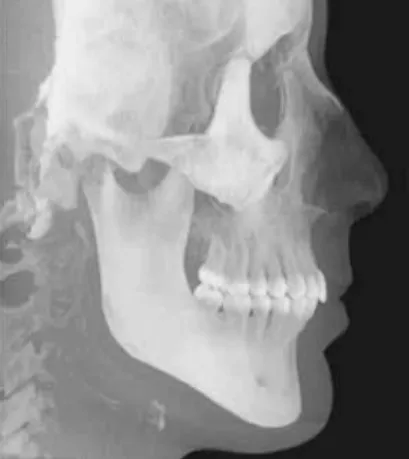
Cone-Beam Computed Tomography (CBCT) offers the advantage of enabling image reconstruc-tion from a lateral radiograph in convenreconstruc-tional orth-odontic cephalometry. This investigation aimed to compare how reliably cephalometric landmarks can be identified when viewed on conventional radio-graphs (Fig 1), and when viewed on two different
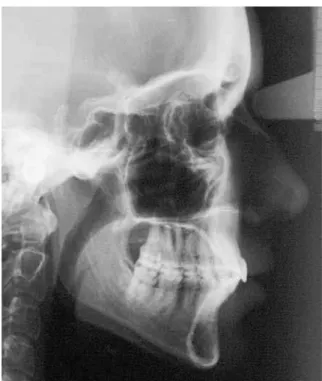
CBCT images, i.e., conventional 2D reconstruc-tion and maximum intensity projecreconstruc-tion (MIP), depicted in Figures 2 and 3, by analyzing the dis-persion of the values obtained from measurements performed on each image. CBCT-generated images were printed on photographic paper and cephalo-metric tracings were manually performed by 10 examiners at two different times.
2D / 3D Cone-Beam CT images or
conventional radiography:
Which is more reliable?
Carolina Perez Couceiro**, Oswaldo de Vasconcellos Vilella***
Objective: To compare the reliability of two different methods used for viewing and
iden-tifying cephalometric landmarks, i.e., (a) using conventional cephalometric radiographs, and (b) using 2D and 3D images generated by Cone-Beam Computed Tomography. Meth-ods: The material consisted of lateral view 2D and 3D images obtained by Cone-Beam Computed Tomography printed on photo paper, and lateral cephalometric radiographs, taken in the same radiology clinic and on the same day, of two patients selected from the archives of the Specialization Program in Orthodontics, at the School of Dentistry, Fluminense Federal University (UFF). Ten students from the Specialization Program in Orthodontics at UFF identified landmarks on transparent acetate paper and measure-ments were made of the following cephalometric variables: ANB, FMIA, IMPA, FMA, interincisal angle, 1-NA (mm) and 1-NB (mm). Arithmetic means were then calculated, standard deviations and coefficients of variance of each variable for both patients. Results
and Conclusions: The values of the measurements taken from 3D images showed less
dispersion, suggesting greater reliability when identifying some cephalometric landmarks. However, since the printed 3D images used in this study did not allow us to view intra-cranial landmarks, the development of specific software is required before this type of examination can be used in routine orthodontic practice.
Abstract
Keywords: Cone-Beam Computed Tomography. Radiography. Orthodontics.
** Specialist in Orthodontics, Fluminense Federal University.
Couceiro CP, Vilella OV
Questions to the authors
1) Did the examiners report any difficulties in marking the points on the 3D image?
No, the cephalometric landmarks were easily identified on the 3D image and the lines and angles were easily traced and measured, respectively. Not many differences were found compared to cephalo-metric tracings commonly performed by examiners on a conventional cephalometric image.
2) Did the examiners notice any differences in structure identification between conven-tional cephalometric images and 2D CBCT reconstruction?
The investigators reported greater difficulty in
(A), supramentale (B) and nasion (N). Likewise, the inferior mandibular border seemed easier to identify. Nevertheless, 3D images do not seem to be as reliable when identifying the intersec-tion of the long axes of maxillary and mandibular central incisors. It is interesting to note also that printed 3D images, as used in this study, did not allow the viewing of intracranial points, often es-sential for cephalometric analysis. No difference was pointed out between conventional images and 2D Cone-Beam CT reconstruction.
Coefficient of variance was applied with the purpose of assessing the dispersion of cephalo-metric values. Values from the measurements performed on the 3D CBCT images showed less dispersion in seven situations. This result was re-peated—considering the data of patients 1 and 2, for the FMA angle only. This finding seems to suggest that three-dimensional images are more reliable for identifying some cephalometric land-marks which are difficult to detect in 2D images, such as porion (Po), orbitale (Or), subspinale
FIGURE 1 - Lateral cephalometric radiograph. FIGURE 2 - 2D image obtained with Cone-Beam Computed Tomography, in lateral view.
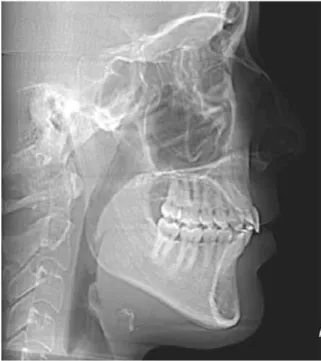
FIGURE 3 - 3D image obtained with the Cone-Beam Computed Tomography, in lateral view.
identifying cephalometric landmarks and in per-forming cephalometric tracings on the 2D CBCT-generated reconstruction.
3) Do the authors find it feasible to use 2D CBCT-generated reconstruction in cepha-lometry?
Yes. Not only in 2D but in 3D as well, provided that cephalometric analyses are adapted to three-dimensional images.
Contact address Carolina Perez Couceiro
OR I G I N A L AR T I C L E
Dental Press J Orthod 1 2010 Sept-Oct;15(5):40.e1-8
2D / 3D Cone-Beam CT images or
conventional radiography:
Which is more reliable?
Carolina Perez Couceiro*, Oswaldo de Vasconcellos Vilella**
Objective: To compare the reliability of two different methods used for viewing and
iden-tifying cephalometric landmarks, i.e., (a) using conventional cephalometric radiographs, and (b) using 2D and 3D images generated by Cone-Beam Computed Tomography. Meth-ods: The material consisted of lateral view 2D and 3D images obtained by Cone-Beam Computed Tomography printed on photo paper, and lateral cephalometric radiographs, taken in the same radiology clinic and on the same day, of two patients selected from the archives of the Specialization Program in Orthodontics, at the School of Dentistry, Fluminense Federal University (UFF). Ten students from the Specialization Program in Orthodontics at UFF identified landmarks on transparent acetate paper and measure-ments were made of the following cephalometric variables: ANB, FMIA, IMPA, FMA, interincisal angle, 1-NA (mm) and 1-NB (mm). Arithmetic means were then calculated, standard deviations and coefficients of variance of each variable for both patients. Results
and Conclusions: The values of the measurements taken from 3D images showed less
dispersion, suggesting greater reliability when identifying some cephalometric landmarks. However, since the printed 3D images used in this study did not allow us to view intra-cranial landmarks, the development of specific software is required before this type of examination can be used in routine orthodontic practice.
Abstract
Keywords: Cone-Beam Computed Tomography. Radiography. Orthodontics.
* Specialist in Orthodontics, Fluminense Federal University.
** PhD in Biological Sciences (Radiology), Federal University of Rio de Janeiro and Professor of Orthodontics, –Fluminense Federal University.
IntROduCtIOn
With the advent of the first standardized cephalograms obtained with the aid of the ceph-alostat, developed by Broadbent2 and Hofrath8 as
of 1931, it became possible to identify previously inaccessible reference points in living beings and dry skulls.16 Since then, cephalometric
examina-tion has become essential for orthodontists, who can now count on a more reliable guide to
diag-nose, plan and predict malocclusion cases.16
Nonetheless, several factors can influence the identification of these points, such as definition accuracy, reproducibility of landmark location and image quality. Moreover, these points—es-pecially those outside the sagittal plane—are subject to distortion.1,11 Despite these potential
2D / 3D Cone-Beam CT images or conventional radiography: Which is more reliable?
In the 1980s, devices emerged in the United States that employ the Cone-Beam technique. Cone-Beam is a special type of computed tomog-raphy in which the X-ray beam that generates the image features a special conic shape, unlike conventional CT (CCT), which uses a fan-shaped beam known as fan beam. Tomography obtained with this technology is also called volumetric computerized tomography (VCT).5 The images
are obtained in three dimensions and it is also possible to render 2D images through software.
These advances in imaging have improved considerably the identification of hard-to-detect structures, which may increase the accuracy and reliability of orthodontic diagnosis and treat-ment planning.14 In comparison with
conven-tional radiography, examination with computed tomography can potentially provide a wealth of additional information. Cone-Beam CT allows all conventional dental radiographs (panoramic, lateral and frontal cephalograms, occlusal, peri-apical and bite-wings) to be reconstructed and then added to the multiplanar and 3D recon-structions. Furthermore, measurements made from volumetric CT feature a 1:17 ratio, unlike
conventional cephalometric radiography, whose magnification may vary from 4.6% to 7.2%.1
Considering that these two tests are cur-rently available to orthodontists, this investiga-tion aimed to compare how reliably cephalo-metric landmarks can be identified (a) when viewed on conventional radiographs, and (b) when viewed on 2D and 3D images generated by Cone-Beam CT, by analyzing the dispersion of the values obtained from the measurements performed on each image.
MAteRIAl And MethOds Material
In this study, we used the examinations of two patients selected from the files of the Spe-cialization Program in Orthodontics, School of Dentistry, Fluminense Federal University (UFF).
The material consisted of lateral 2D and 3D images obtained by Cone-Beam computed to-mography and printed on photo paper at 1:1 ratio, and conventional cephalometric radio-graphs, taken in the same radiology clinic on the same day.
Methods
Cephalometric examination
Profile cephalometric radiographs were ob-tained by following the standards established during the First Roentgenographic Cephalomet-ric Workshop, held in 1957 in the city of Cleve-land, United States of America.15
The radiographs were taken after the pa-tient’s head had been immobilized in a cephalo-stat positioned in the Frankfurt horizontal plane. The head was fixed so that the sagittal plane re-mained parallel to the film and perpendicular to the ground (Fig 1).
Couceiro CP, Vilella OV
Dental Press J Orthod 3 2010 Sept-Oct;15(5):40.e1-8
Ct scan
The CT scans were obtained using i-CAT Volumetric Cone-Beam Computed Tomography device (Imaging Sciences). During image acquisi-tion, patients sat in an open environment in their natural anatomic position while the equipment took one 360º spin around the head, which lasted from 20 to 40 seconds. The 3D images captured in the scanner were then exported to software viewer Visio i-CAT, which helped us to render 2D and 3D images (Figs 2 and 3).
These images were printed on the same type of photo paper.
Cephalometric landmark tracing
The landmarks were identified on transparent acetate paper, measuring 20.0 by 18.5 cm, and marked with black pencil. A light box (illumina-tor) was used for viewing the X-rays.
- Nasion (N): foremost point of the frontonasal suture, seen in lateral view.16
- Subspinale (A-point): deepest point in the
contour of the premaxilla.16
- Supramentale (B-point): deepest point in the contour of the mandibular alveolar process.16
- Menton (Me): inferiormost point in the con-tour of the mandibular symphysis.16
- Orbitale (Or): inferiormost point on the infe-rior margin of the left orbit.16
- Porion (Po): highest point of the external au-ditory conduit.16
Planes and lines
- NA Line: joining the nasion (N) and subspi-nale (A) points.
- NB Line: joining the nasion (N) and supra-mentale (B) points.
- Long axis of upper central incisor. - Long axis of lower central incisor.
- Mandibular plane: tangent to the lower border of the mandible in the posterior region, and to the menton (Me) in the symphysis region. - Frankfurt horizontal plane: joining porion
(Po) and orbitale (Or).
FIGURE 2 - 2D image obtained with Cone-Beam Computed Tomography, in lateral view.
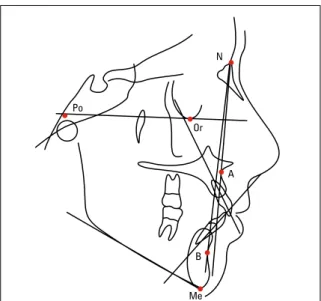
Po
Me B
A Or
N
2D / 3D Cone-Beam CT images or conventional radiography: Which is more reliable?
Measurements (Fig 4)
- ANB: intersection of lines NA and NB.
- FMIA: intersection of the Frankfurt horizontal plane with the long axis of the lower central incisor.
- IMPA: intersection of the long axis of the lower central incisor with the mandibular plane. - FMA: intersection of the mandibular plane
with the Frankfurt horizontal plane.
- Interincisal angle: intersection of the long axes of the upper and lower central incisors.
- NA (mm): linear distance measured from the most prominent maxillary point on the central incisor crown to line NA.
- 1-NB (mm): linear distance measured from the most prominent maxillary point on the central incisor crown to line NB.
All measurements were performed by ten ex-aminers, students from the Specialization Program in Orthodontics, Universidade Federal Fluminense (UFF). After one week the measurements were re-peated in order to evaluate intraobserver error.
The examiners were calibrated and briefed on the landmarks, planes and angles to ensure homo-geneous measurements. The linear measurements were obtained with the aid of a millimeter ruler.
statistical Analysis
Means, standard deviations and coefficients of variance were calculated. The Shapiro-Wilk test was used to check normality between the values obtained on two measurement occasions. When the existence of normal value distribution was noted, the paired t-test was applied to obtain the level of statistical significance. Otherwise, the sign test was used. In both cases a significance level of 1% was used.
Results
Tables 1 and 2 show the means, standard de-viations and coefficients of variance for the mea-surements taken on the lateral cephalometric radiographs and on the 2D and 3D images gener-ated by Cone-Beam Computed Tomography.
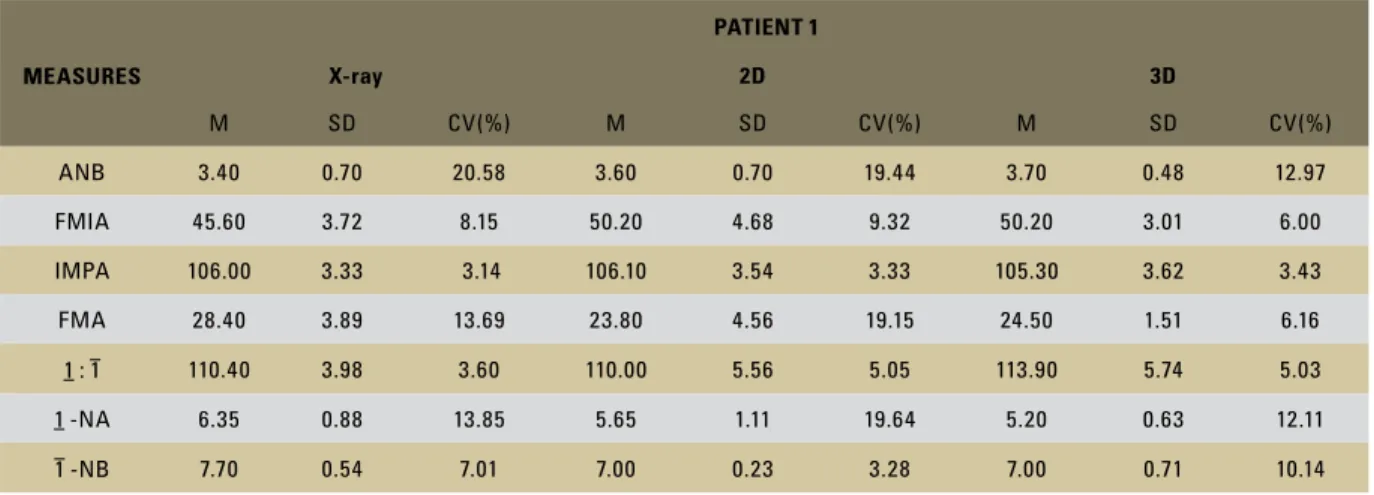
Patient 1 was found to exhibit values of stan-dard deviations and coefficients of variance that were lower—in the 3D images—for ANB, FMIA, FMA, and 1-NA (mm). Regarding IMPA and the interincisal angle, standard deviations and coeffi-cients of variance were lower in the conventional radiographs. For variable 1-NB (mm), the standard deviation and coefficient of variance were smaller in the 2D images (Table 1).
Patient 2 was found to exhibit values of stan-dard deviations and coefficients of variance that were lower—in the 3D images—for IMPA, FMA, and 1-NB (mm). For variables ANB, interincisal angle and 1-NA (mm) standard deviations and co-efficients of variance were smaller in the 2D im-ages. For angle FMIA, the standard deviation and coefficient of variance were lower in the conven-tional radiographs (Table 2).
A comparison between the two measurements (Table 3) showed that there were no statistically significant differences at 1% probability.
Couceiro CP, Vilella OV
Dental Press J Orthod 5 2010 Sept-Oct;15(5):40.e1-8
TABLE 1 - Values of means (M), standard deviations (SD) and coefficient of variance (CV) of the measurements in lateral cephalometric radiography and CT images, in 2D and 3D, Patient 1.
MEASURES
PATIENT 1
X-ray 2D 3D
M SD CV(%) M SD CV(%) M SD CV(%)
ANB 3.40 0.70 20.58 3.60 0.70 19.44 3.70 0.48 12.97
FMIA 45.60 3.72 8.15 50.20 4.68 9.32 50.20 3.01 6.00
IMPA 106.00 3.33 3.14 106.10 3.54 3.33 105.30 3.62 3.43
FMA 28.40 3.89 13.69 23.80 4.56 19.15 24.50 1.51 6.16
1 : 1 110.40 3.98 3.60 110.00 5.56 5.05 113.90 5.74 5.03
1 -NA 6.35 0.88 13.85 5.65 1.11 19.64 5.20 0.63 12.11
1 -NB 7.70 0.54 7.01 7.00 0.23 3.28 7.00 0.71 10.14
TABLE 3 - P-values for the paired t-test and sign test, according to the normal (or not normal) distribution of the variable values measured on two different occasions, for each image.
n.s. = non significant (p>0.01).
MEASURES
PATIENT 1 PATIENT 2
X-ray 2D 3D X-ray 2D 3D
ANB 0.754n.s. 0.344n.s. 0.344n.s. 0.344n.s. 0.754n.s. 0.109n.s.
FMIA 0.031n.s. 0.016n.s. 0.109n.s. 0.344n.s. 0.098n.s. 0.294n.s.
IMPA 0.270n.s. 1.000n.s. 0.535n.s. 0.671n.s. 0.625n.s. 0.109n.s.
FMA 0.379n.s. 1.000n.s. 0.754n.s. 0.754n.s. 0.145n.s. 1.000n.s.
1 : 1 0.109n.s. 0.228n.s. 0.109n.s. 0.754n.s. 0.522n.s. 0.229n.s.
1 -NA 1.000n.s. 0.021n.s. 0.344n.s. 0.754n.s. 0.344n.s. 0.344n.s.
1 -NB 0.109n.s. 0.109n.s. 1.000n.s. 1.000n.s. 0.754n.s. 0.344n.s.
TABLE 2 - Values of means (M), standard deviations (SD) and coefficient of variance (CV) of the measurements in lateral cephalometric radiography and CT images, in 2D and 3D, Patient 2.
MEASURES
PATIENT 2
X-ray 2D 3D
M SD CV(%) M SD CV(%) M SD CV(%)
ANB 8.30 0.95 11.44 8.50 0.71 8.35 7.85 0.67 8.53
FMIA 45.10 1.37 3.04 49.10 2.81 5.72 46.80 2.35 5.02
IMPA 103.60 2.22 2.14 103.00 2.45 2.38 102.70 1.89 1.84
FMA 31.40 1.90 6.05 27.90 3.60 12.90 30.50 1.58 5.18
1 : 1 128.80 2.74 2.13 132.50 2.71 2.04 128.90 3.24 2.51
1 -NA 3.25 1.62 49.85 2.25 0.54 24.00 2.80 0.88 31.43
2D / 3D Cone-Beam CT images or conventional radiography: Which is more reliable?
dIsCussIOn
Since the introduction of the cephalostat, Broadbent (1931) underlined the importance of coordinating the lateral and posteroanterior cephalometric films (two extraoral radiographs orthogonal to each other would be taken to ac-quire a three-dimensional image of the patient) in order to arrive at a distortion-free definition of the craniofacial skeleton. But this approach is not truly three-dimensional as it relies on identifying the same spot in both radiographs and on the use of geometry to calculate the three-dimensional position. The major limitations of this method were obvious. Accuracy depended on a proper correspondence between the landmark locations in the two radiographs, and non-visible points could not be used.6
Nevertheless, innovations in digital imaging are changing the way these common methods are used in diagnosis and treatment planning.14 Volumetric
computerized tomography or Cone-Beam, was introduced into dentistry in 2000 at Loma Linda University (USA), and since then its clinical appli-cation has been widespread, side by side with sig-nificant technological development, bringing with it faster results and higher resolution images.10
These advances in imaging will certainly im-prove the ability to identify anatomical land-marks that are not easily detectable in the images currently available, thereby increasing the accu-racy and reliability of orthodontic diagnosis and treatment planning.14
Some systems allow CT scan reconstructions that are comparable to cephalometric projec-tions.4 The purpose of this study was to compare
how reliably different cephalometric landmarks could be identified when visualized on conven-tional radiographs versus on 2D and 3D images generated by Cone-Beam CT, by analyzing the dispersion of the values of measurements taken on each image.
The examiners were calibrated prior to iden-tifying the landmark and taking the
measure-ments, which were repeated after a one week interval in order to test intraobserver reliability. The results showed no statistically significant dif-ferences at 1% probability (Table 3). Thus, the values obtained at the time were acceptable for use in this research.
Couceiro CP, Vilella OV
Dental Press J Orthod 7 2010 Sept-Oct;15(5):40.e1-8 variance in four situations. This ANB angle
re-sult was repeated in the examination of patients 1 and 2, which suggests that the subspinale (A) and supramentale (B) points are difficult to visu-alize radiographically.
The values of the variables measured on the 2D Cone-Beam CT images showed less disper-sion in four situations. However, none of these was repeated in two patients (Tables 1 and 2), which seemed to indicate that this result is re-lated to the anatomical peculiarities inherent in each image. The highest coefficients of variance were found in seven situations, considering the joint results of the two patients. It should be borne in mind, however, that the images of ana-tomical structures in the radiographic examina-tion were visualized with the aid of a light box, unlike the 2D Cone-Beam CT images, which may be construed as an advantage for the former.
Measures 1-NB and ANB showed very dis-crepant results with respect to the coefficient of variance of the three images of patient 1, but this was not the case with patient 2. It is likely that this fact can be ascribed to their anatomical differences.
The results of this study are consistent with the findings published in 2005 by Nakajima et al13 who, after evaluating Cone-Beam CT
tech-nology, concluded that 3D images provide useful information for orthodontic diagnosis and treat-ment planning.
Furthermore, it is relevant to mention that the measurements made by Cone-Beam Computed Tomography feature a 1:13,7 ratio while
conven-tional radiography exhibits a magnification of up to 7.2%, according to Bergensen.1
One need not, however, abandon convention-al two-dimensionconvention-al cephconvention-alometric measurements in moving to three-dimensional technology since 3D images can be rendered in 2D, similarly to a radiograph. Besides, cephalometric landmarks can also be traced on 3D images. According to Halazonetis,6 new cephalometric landmarks are
likely to be introduced and many new cephalo-metric analyses, similar to existing two-dimen-sional analyses, are bound to be created.
COnClusIOns
2D / 3D Cone-Beam CT images or conventional radiography: Which is more reliable?
1. Bergensen EO. Enlargement and distortion in cephalometric radiography: compensation tables for linear measurements. Angle Orthod. 1980 Jul;50(3):230-44.
2. Broadbent HB. A new X-ray technique and its application to orthodontia. Angle Orthod. 1931 Apr;1(2):45-66.
3. Capelozza L Filho, Fattori L, Maltagliati LA. Um novo método para avaliar as inclinações dentárias utilizando a tomograia computadorizada. Rev Dental Press Ortod Ortop Facial. 2005 set-out;10(5):23-9.
4. Farman AG, Scarfe WC. Development of imaging selection criteria and procedures should precede cephalometric assessment with cone-beam computed tomography. Am J Orthod Dentofacial Orthop. 2006 Aug;130(2):257-65. 5. Garib DG, Raymundo R Jr, Raymundo MV, Raymundo DV,
Ferreira SN. Tomograia computadorizada de feixe cônico (cone beam): entendendo este novo método de diagnóstico por imagem com promissora aplicabilidade na ortodontia. Rev Dental Press Ortod Ortop Facial. 2007 mar-abr;12(2):139-56. 6. Halazonetis DJ. From 2-dimensional cephalograms to
3-dimensional computed tomography scans. Am J Orthod Dentofacial Orthop. 2005 May;127(5):627-37.
7. Hilgers ML, Scarfe WC, Scheetz JP, Farman AG. Accuracy of linear temporomandibular joint measurements with cone beam computed tomography and digital cephalometric radiography. Am J Orthod Dentofacial Orthop. 2005 Dec;128(6):803-11. 8. Hofrath H. Die bedeutung der rontgenfern-und
abstandsaufnahme fur die diagnostik der kieferanomalien. Fortschr Orthod. 1931 Apr-Jul;1:232-58.
ReFeRenCes
9. Lagravère MO, Major PW. Proposed reference point for 3-dimensional cephalometric analysis with cone-beam computerized tomography. Am J Orthod Dentofacial Orthop. 2005 Nov;128(5):657-60.
10. Mah J, Hatcher D. Three-dimensional craniofacial imaging. Am J Orthod Dentofacial Orthop. 2004 Jun;126(3):308-9. 11. Major PW, Johnson DE, Hesse KL, Glover KE. Landmark
identiication error in posterior anterior cephalometrics. Angle Orthod. 1994;64(6):447-54.
12. Moyers RE, Bookstein FL. The inappropriateness of conventional cephalometrics. Am J Orthod. 1979 Jun;75(6):599-617.
13. Nakajima A, Sameshima GT, Arai Y, Homme Y, Shimizu N, Dougherty H Sr. Two and three-dimensional orthodontic imaging using limited cone beam computed tomography. Angle Orthod. 2005 Nov;75(6):895-903.
14. Quintero JC, Trosien A, Hatcher D, Kapila S. Craniofacial imaging in orthodontics: Historical perspective, current status, and future developments. Angle Orthod. 1999 Dec;69(6):491-506.
15. Salzmann JA. Résumé of the workshop and limitations of the technique. Am J Orthod. 1958 Dec;44(12):901-32. 16. Vilella OV. Manual de cefalometria. 3ª ed. Rio de Janeiro:
Revinter; 2009.
Contact address Carolina Perez Couceiro
Rua Senador Vergueiro, 50/401 – Flamengo CEP: 22.230-001 – Rio de Janeiro / RJ, Brazil E-mail: [email protected]