Original Article
Artigo Original
Evaluation of the hearing protector in a real
work situation using the
field-microphone-in-real-
ear method
Avaliação do protetor auditivo em situação real
de trabalho pelo método field
Microphone-in-real-ear
Clayton Henrique Rocha1 Isadora Altero Longo1 Renata Rodrigues Moreira2 Alessandra Giannella Samelli1
Keywords
Noise Hearing Loss, Noise-induced Hearing Protection Devices Program of Risk Prevention on
Working Environment Occupational Health
Descritores
Ruído Perda Auditiva Provocada por Ruído Dispositivos de Proteção das Orelhas Programa de Prevenção de Riscos no
Ambiente de Trabalho Saúde do Trabalhador
Correspondence address: Alessandra Giannela Samelli Rua Cipotânea, 51, Cidade
Universitária, São Paulo (SP), Brazil, CEP: 05360-160.
E-mail: [email protected]
Received: August 15, 2014
Study carried out at the Audiology Sector of the University Hospital, Universidade de São Paulo – USP - São Paulo (SP), Brazil.
1 Department of Physical Therapy, Speech-Language Pathology and Audiology and Occupational Therapy, School of Medicine, Universidade de São Paulo – USP - São Paulo (SP), Brazil.
2 University Hospital, Universidade de São Paulo – USP - São Paulo (SP), Brazil.
Financial support: none.
Conlict of interests: nothing to declare. ABSTRACT
Purpose: To evaluate the effectiveness of the attenuation of a hearing protector (HP) in a real work situation
using the ield-microphone-in-real-ear method (f-MIRE). Methods: Eighteen individuals of both genders (mean
age of 47.17±8 years) participated in this study. In the workplace, the personal attenuation level of the HP was assessed using the f-MIRE method, followed by orientation about the importance of using the HP, cleaning and
storing the device, and training for effective placement. Results: The analyses showed a signiicant statistic
attenuation for all of the collected data (total noise, by frequency band and dose) when the noise levels in
the lapel microphone and the probe microphone were compared. In the comparison of the attenuation values
provided by the manufacturer and those found in this study, we observed higher values for the manufacturer in all frequency bands. No difference was observed for the noise levels in the different activities and times evaluated. Conclusion: The indings of this study enabled us to know the personal level of attenuation of
the HP during a real work situation, which was within the limits of tolerance. It was also possible to collect
information about the environmental noise to which these workers are exposed. We noticed situations where
this level exceeded the safety values, and therefore it is recommended the use of the HP. It is important that more studies are conducted using the f-MIRE method, because it may be an ally to assess the effectiveness of
the HP attenuation in the workplace.
RESUMO
Objetivo: Avaliar a eicácia da atenuação de um protetor auditivo em uma situação real de trabalho utilizando o
método f-Microphone-in-real-ear (f-MIRE). Métodos: Participaram 18 indivíduos, de ambos os gêneros (média de idade 47,17±8 anos). No local de trabalho, foi realizada a avaliação do nível pessoal de atenuação do Protetor Auditivo (PA) pelo método Field Microphone-in-Real-Ear (f-MIRE), seguido por orientações sobre a importância do uso do PA, higienização, armazenamento e treinamento para sua colocação efetiva. Resultados: As análises
mostraram que houve atenuação estatisticamente signiicante para todos os dados coletados (ruído total, por
INTRODUCTION
The exposure to noise can cause several health problems, such as hearing loss, tinnitus, alterations in the sleep and in the cardiovascular function, damage to the work, among others(1).
Noise induced hearing loss (NIHL) is the second occupational
illness most reported by workers(2), and the second most important
cause of sensorineural hearing loss after presbycusis(3).
To avoid the damage caused by noise exposure, companies should develop hearing loss prevention programs (HLPP)(4) that,
according to the legislation of Brazil and developed countries, must include, among other aspects, noise monitoring, training and education of the workers, use of hearing protector (HP), and audiometric monitoring(5,6). For the HLPP to succeed, the workers
must be well informed about the reasons and objectives of the program, besides being trained about how to insert the HP(7,8).
However, the eficacy of the HP insertion is usually not
evaluated within the HLPP, which contributes to the lack of knowledge about the effectiveness of the actions developed in the programs. For this reason, methods that evaluate the insertion of the HP are key to verify if the protection provided is adequate for a particular individual.
Previous studies have been conducted to quantify the attenuation provided by the HPs for each individual, in conditions closer to real situations(9). However, there was no correspondence
between the attenuation provided by the HP on the ield with
the values obtained in the laboratory, and the latter exceeded
the attenuation values veriied on the ield(10-12).
Because of the discrepancies in values between the ield and
the laboratory, some authors suggested that individual assessments of the HPs should be routinely performed, as a way to ensure
the eficacy of these devices in preventing hearing loss(11,12).
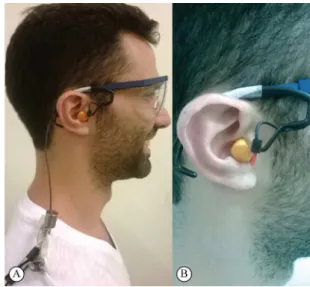
Among the available methods of individual evaluation
of the HP insertion, there is the ield-microphone-in-real-ear (f-MIRE) approach, an objective method in which the measuring
is performed with two microphones, one placed inside the external auditory meatus (EAM) and another on the lapel, close to the auricular pavilion (Figure 1). Besides the objectivity of this method, the brevity of the measuring is its main advantage as two microphones pick up, simultaneously, both the external and the internal sound pressure levels to the HP(13-15).
Another advantage of this method is the possibility to conduct the study in the work environment, which generates more reliable data about the attenuation of the HP(16,17) and
provides information closer to reality about HP attenuation for employees and employers.
In addition, the evaluation method can be incorporated into
the training of the user for proper insertion of the HP; the process of selecting plug-type HPs, enabling us to consider factors such as comfort and convenience; the process of assessing the effectiveness of the HLPP, among others(9,11,12).
Thus, to evaluate the attenuation of the HP in real work situations is of paramount importance for health and security professionals, as it can provide a variety of information about
the eficacy of the HP, to assist in promoting the proper use of
this device and monitoring the protection routinely offered.
Information as those previously presented can resolve some
doubts involving workers exposed to noise, who use “adequately” and “routinely” the HP, but that still show onset or worsening of unilateral or bilateral sensorineural hearing loss, without other factors to justify these alterations.
The objective was to evaluate the effectiveness of the
attenuation of an HP in a real work situation using the f-MIRE
method.
METHODS
This study was conceived as descriptive cross-sectional. The participants were 18 individuals (mean age of 47.17±8 years),
with ive men (mean age of 40.8±3.49 years, minimum 36,
maximum 45) and 13 women (mean age of 49.83±7.91 years, minimum 39, maximum 64), who were part of the staff of a hospital nutrition and dietetic service (NDS), in a convenience sample.
All the employees had the same job (kitchen assistant) and performed the same activities, divided into morning (7h-13h), afternoon (13h-19h) and night (19h-7h) shifts. The working day of the employees was 6 hours, including also an on-call of 12 hours for the morning and afternoon shifts, and of 12-36 hours for the night shift employees.
Regarding the work environment and the activities performed, in which there is exposure to noise, the employee basically remains in front of a ramp where dishes and trays are deposited. This ramp has a connection with the dish washer. The employee pulls the support with the dishes and trays from the ramp toward the machine and waits on the other side to remove the clean
dishes and trays, then storing them in the carts. It is noteworthy
that both ears have similar levels of noise exposure.
Because of the work of the medical residents in the research area of occupational health of the Multidisciplinary Residency Program in NDS with the workers of this sector, as well as to improve the HLPP, in partnership with the Specialized Service in Safety and Occupational Medicine (SESMT), we decided to
choose this location to carry out this study. It should also be
noted that, according to the latest environmental risk prevention program (PPRA) conducted for the mentioned sector, the noise level reaches 85 dBA.
Individuals were asked to take part voluntarily. If accepted,
they would sign the informed consent, approved by the Research Ethics Committee of the institution, under the process number 858/08.
All the participants underwent hearing assessment before the study, as part of the annual monitoring of the HLPP. When necessary, they were referred to an otorhinolaryngologist.
It is noteworthy that six individuals had hearing loss with characteristics consistent with NIHL.
Before the beginning of the measuring with the f-MIRE
method, a meatoscopy was performed to ensure that there was no excess cerumen that could interfere with the other results.
The attenuation levels of the HP were evaluated at the workplace of the participants during their activities with exposure to noise. They were evaluated at breakfast, lunch, and dinner activities, at hours considered typical and with no alteration in
the routine. Nine employees from the morning shift, ive from
the afternoon shift, and four from the night shift attended.
It is important to mention that the Occupational Hygiene
Standard (NHO-01)(18) suggests that the set of performed noise
measurements should be representative of the actual and usual conditions of occupational exposure of the studied group of workers. Thus, the sampling period should be properly chosen (within usual activities) and, if it cannot cover the whole working day, the stipulated dose for the measured period should be projected for the actual daily working hours.
In view of this, as it was not possible to measure with the
dosimeter throughout the working day, within this period of usual activity, one 15-minute break for measuring was chosen for each employee, and 16 individuals participated in two collections on different days, and two individuals participated in only one collection (for organizational reasons of the sector).
To evaluate the level of attenuation of the HP, the noise dosimeter SV-102, of the Svantek brand, was used. This equipment has two microphones, one probe microphone (PM) and one lapel microphone (LM), which are connected to the unit of information processing and storage.
The PM consists of a plastic holder attached to the frame of the safety glasses, ensuring the smallest possible displacement. At one end, the microphone is connected to the silicone probe, which is 58 mm long. Nevertheless, only 28 mm was inserted into the EAM of the participants, value adopted by the geometric method(19), thereby ensuring that the probe would not be
obstructed by the HP, which was 25 mm long. To assist with inserting the probe on the EAM, an otoscope and a pre-molding
lashlight were used.
The probe also has a red mark that enables us to standardize
the length to be inserted into the EAM. In the study, this mark
was positioned toward the antitragus to guarantee its insertion in the same depth of the EAM in different individuals. We stress that, before each collection, this marking on the probe was measured to check the length (28 mm).
The SV-102 provides various information, such as the sound pressure level (SPL), equivalent noise level (Leq), dose (D), projected dose (Dproj), statistical levels of prevalence of noise and exposure by frequency bands. The equipment has a microcomputer, programmed to do all settings and technical corrections automatically.
The equipment was conigured following the manufacturer’s technical speciication, the Regulatory Standard 15 (NR-15)
(20) and the NHO-01(18). For continuous noise, these parameters
deine that the weighting circuit must be “A,” with slow response,
benchmark of 85 dB(A) for the NR-15 and of 80 dB(A) for the
NHO-01, doubling rate of ive for NR-15 and three for NHO-01,
and measurement range up to 115 dB. Before each collection, the microphones were calibrated.
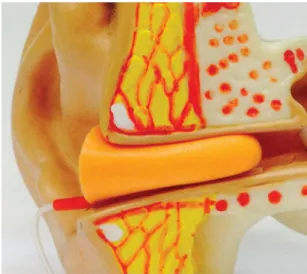
The PM was always inserted in the EAM of the right ear, arbitrarily chosen to perform the measurements, to assess the present level of noise in the ear with the HP (Figure 2). We used a 25-mm-long foam plug HP.
The LM was placed on the shoulder, near the auricular pavilion, to check the level of noise in the workplace, following the recommendations of NHO-01(18). Thus, it is possible to have
control of the level of environmental noise to determine whether
it was similar in all sample collections, or had variations. It was
also used to calculate the attenuation value of the HP, with the subtraction of the PM value from the LM value.
During the procedure, the participants used the HP provided by the researcher in both ears. To reduce the variations, the researcher inserted the HP in the EAM of all participants at all data collection periods.
After the collections, the employees received guidelines of how to use, sanitize, and properly store the HP, as well as information about the importance of using protectors and
information about hearing care, such as use of lexible cotton
stems and headphones, as well as the importance of monitoring the hearing through exams.
For the analysis of the evaluation of the HP attenuation level, the parametric test of simple variance analysis, with 5%
signiicance level, was used. To conirm the hypothesis that the
HP was effective, the analysis of simple paired variance was
used, comparing the indings of LM and PM. To conirm the
hypothesis that the noise level was not altered by activity, the analysis of simple unpaired variance was used.
RESULTS
In all the analyses, the values obtained by the LM were higher than those of the PM, with statistically signiicant
differences (Table 1).
The calculation of the exposure dose during 15 minutes of collection on the LM was 2.89% with a standard deviation (SD) of 1.14%, higher than the PM, which recorded dose of 0.51% with SD of 0.39% (DF: 1, F: 156.32; p<0.001). When the DProj
was calculated for shifts, we obtained the value of 84.42% with SD of 35.71% for the LM and that of 16.11% with SD of 11.29% for the PM (DF: 1; F: 127.86; p<0.001). The data showed that, comparing the two microphones, the PM presented values less
than those of the LM, with a statistically signiicant difference.
Regarding the noise levels present in 10%, 50%, and 90% of the measuring periods, we observed that, most of the time (90%), the noise was around 72.22 dB(A) at the LM and 56.71 dB(A)
at the PM. In 10% of the time, the noise was of 87.04 dB(A) at
the LM and of 74.14 dB(A) at the PM.
In the evaluation by frequency bands, lower values at the PM
were also observed when compared to the LM, with a statistically
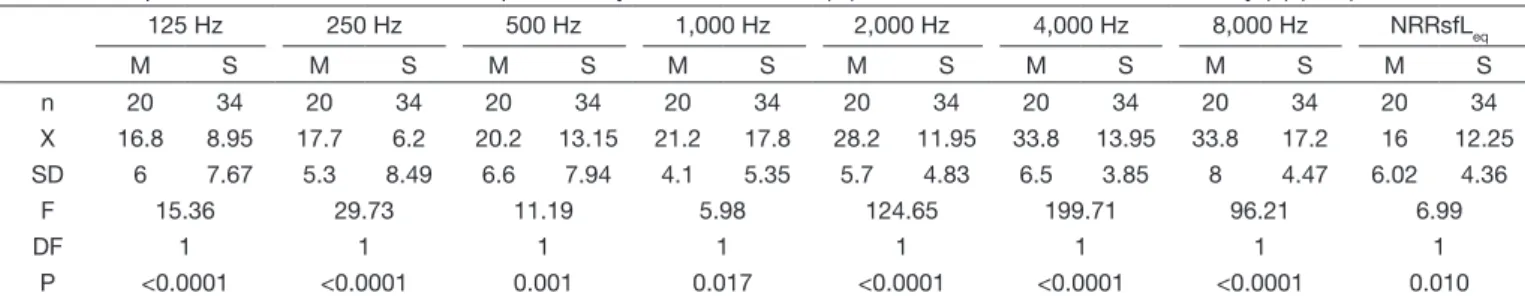
signiicant difference in all frequencies, as shown in Table 2. Comparing the attenuation values provided by the manufacturer and those found in this study, we observed higher values for the
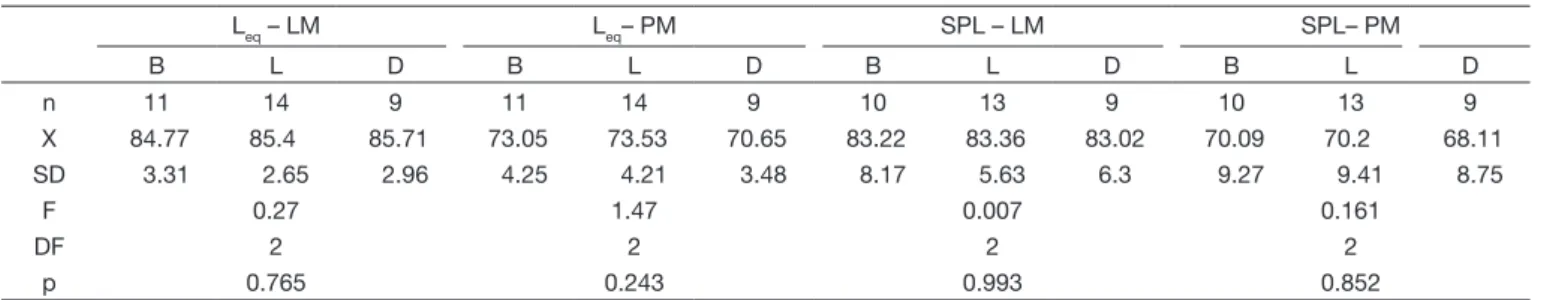
manufacturer with a statistically signiicant difference (Table 3). When comparing the shifts and activities, no differences were observed in noise levels at the LM, which shows that the noise remained constant during different sample collections (Table 4).
DISCUSSION
This study aimed to evaluate the effectiveness of the attenuation of an HP in a real work situation, using an objective
method (f-MIRE). The results of the study showed that the HP
was effective in all situations, as the values measured by the PM
were lower than those of the LM, with statistically signiicant
differences for all the analyses (Tables 1 and 2).
The Leq values obtained at the PM showed that the mean noise was of 72.61±4.11 dB(A) and the dose of 0.51±0.39%
Table 1. Values obtained in the objective assessment for Leq, SPL, Max, Min, and PEAK in dBA (n = 34)
Leq SPL MAX MIN PEAK
LM PM LM PM LM PM LM PM LM PM
X 85.28 72.61 83.22 69.58 99.23 87.11 67.38 54.68 123.79 110.3
SD 2.89 4.11 6.47 8.93 5.65 6.23 4.97 4.51 6.74 7.41
F 290.76 171.91 212.21 319.57 144.34
DF 1 1 1 1 1
p <0.0001 <0.0001 <0.0001 <0.0001 <0.0001
Caption: Leq = equivalent noise level; SPL = sound pressure level; Max = maximum level of noise; Min = minimum level of noise; PEAK = noise peak; N = number of
samples; X = mean; SD = standard deviation; F = Fisher’s value; DF = degree of freedom; p =p-value
Table 2. Comparison of the noise by frequency bands in dBA (n = 34)
125 Hz 250 Hz 500 Hz 1,000 Hz 2,000 Hz 4,000 Hz 8,000 Hz
LM PM LM PM LM PM LM PM LM PM LM PM LM PM
X 60.28 51.07 67.82 60.57 75.78 62.18 79.07 60.89 79.58 67.32 79.61 65.1 73.62 56.49 SD 1.75 7.39 1.65 8.43 2.19 7.93 2.91 5.23 3.37 4.45 3.17 4.02 3.25 4.53
F 49 24.76 99.73 393.32 219.04 482.06 498.43
DF 1 1 1 1 1 1 1
p <0.0001 <0.0001 <0.0001 <0.0001 <0.0001 <0.0001 <0.0001
Caption: Hz = hertz; LM = lapel microphone; PM =probe microphone; N = number of samples; X = mean; SD = standard deviation; F = Fisher’s value; DF = degree of freedom; p = p-value
Table 3. Comparison of the attenuation values provided by the manufacturer (M) and the values obtained in this study (S) (dBA)
125 Hz 250 Hz 500 Hz 1,000 Hz 2,000 Hz 4,000 Hz 8,000 Hz NRRsfLeq
M S M S M S M S M S M S M S M S
n 20 34 20 34 20 34 20 34 20 34 20 34 20 34 20 34
X 16.8 8.95 17.7 6.2 20.2 13.15 21.2 17.8 28.2 11.95 33.8 13.95 33.8 17.2 16 12.25 SD 6 7.67 5.3 8.49 6.6 7.94 4.1 5.35 5.7 4.83 6.5 3.85 8 4.47 6.02 4.36
F 15.36 29.73 11.19 5.98 124.65 199.71 96.21 6.99
DF 1 1 1 1 1 1 1 1
P <0.0001 <0.0001 0.001 0.017 <0.0001 <0.0001 <0.0001 0.010
for 15 minutes. When the projected dose for work shift was calculated, the value was found to be 16.11±11.29%. These values showed that the noise to which the employee is exposed when using the HP properly is within the limits recommended by the NHO-01(18) and also within the tolerance limits regulated by
the NR-15(20), ensuring a safe work regarding the noise effects.
In the analysis by frequency bands (Table 2), it can be
noted that the frequencies of 500, 1000, 2000, and 4000 Hz showed higher values at the LM, which may indicate that the predominant noise in the working environment is within these
frequency bands. Regarding the intensities veriied by the PM
at each of the frequencies (Table 2), we should mention that the depth of the probe insertion can interfere with the results due to the presence of the standing waves, particularly for higher frequencies(19), which could change the level of sound pressure
measured in real-ear measurements(21).
A previous study(21) stressed that, using the method of constant
insertion (similar to the one applied in this study), the probe would be located next to the tympanic membrane and there
would be no signiicant variation in the sound pressure levels
measured for the majority of individuals, particularly regarding low and medium frequencies; only for a few individuals with long auditory canals and for higher frequencies (3–6 kHz), there might be some variability in the measurements. However, the depth of the probe insertion was controlled in this study, as described earlier in method, and, thus, we believe that this
variable did not interfere signiicantly in the results for the
difference observed between the values measured in the PM along the frequencies.
Other studies have also mentioned that anatomical and physiological conditions of the external and/or middle ear, such as the volume of the auditory canal and the age of the participant,
could have an inluence on the resonance of EAM(22,23) and in
the real-ear measurements.
Furthermore, observing Tables 2 and 3, we can verify that the attenuation for frequency band provided by the HP reached highest values between 1000 and 8000Hz, data similar to those obtained in another study(24).
This difference between the attenuation values of the HP for each frequency was expected, as the conventional hearing protectors do not have linear attenuation characteristics. An insertion-type HP of nonlinear attenuation normally includes a sound path with an acoustic impedance according to the velocity of the particle. This impedance is linked to its viscous
resistance, which has a nonlinear component proportional to the velocity of the particle(25).
The characteristics involved in the HP resistance are determined mainly by the following variables: the mass of the HP, the characteristics of its material (density, rigidity, dampening, among others), and the interface between the HP and the auditory canal(26). These variables will determine the
greater or lesser degree of attenuation in certain frequency bands.
It should be noted that the different indings displayed in
some studies in the literature concerning the attenuation of hearing protectors can be linked exactly to the features and materials of the different types of HPs used in various studies, as these may determine different acoustic characteristics(27), as
mentioned earlier. We must also consider the different equipment available, used in the studies, which have different correction factors for each type of probe and evaluated HP.
Other important data observed in this study are that the standard deviations of the LM measurements were low for all the frequencies, unlike the PM, which showed higher standard deviations, especially for the frequencies of 125, 250, and 500 Hz, and relatively lower for other frequencies. Probably this difference is indicative of interference caused by individuals talking during data collections; the resonance of the EAM; the position of the probe in the EAM, which can vary between individuals (although the mean length of insertion has been controlled); and a possible displacement of the HP during data collections. These variables should be further investigated in the future because in situations where there is a predominance of low-frequency noise, the attenuation values for these frequencies can be lower and thus there may be greater risk of underprotection, if these factors are not controlled day by day.
When we compared the HP attenuation values by bands and of the Leq veriied in the study with the values provided by the manufacturer (Table 3), we found a statistically signiicant difference, with higher attenuation values provided by the
manufacturer. It is important to stress that the methodology for the certiication of the HPs is different, using a subjective
method and carried out in the laboratory(28).
However, the differences between the values provided by the manufacturer and those obtained in real work situations should be taken into consideration when the HPs are selected for environments with noise, as the attenuation values provided by
the manufacturer will not always be consistent with the workers’ needs, with the possibility of exposure to a signiicant risk to
Table 4. Equivalent noise level and sound pressure level by activities (Leq in dB(A) and SPL in dB SPL)
Leq – LM Leq– PM SPL – LM SPL– PM
B L D B L D B L D B L D
n 11 14 9 11 14 9 10 13 9 10 13 9
X 84.77 85.4 85.71 73.05 73.53 70.65 83.22 83.36 83.02 70.09 70.2 68.11 SD 3.31 2.65 2.96 4.25 4.21 3.48 8.17 5.63 6.3 9.27 9.41 8.75
F 0.27 1.47 0.007 0.161
DF 2 2 2 2
p 0.765 0.243 0.993 0.852
Caption: Leq = equivalent noise level; SPL = sound pressure level; LM = lapel microphone; PM = probe microphone; B = breakfast; L = lunch; D =dinner; N = number
health and safety. In the case of the participants in this study,
because the level of noise to which they are exposed is close to the tolerance limits regulated by the NR-15(20), the selection
of an effective HP is simpler, but in environments with higher noise, this question is more problematic, and the difference between the values provided by the manufacturer and the actual attenuation of the HP should be very well thought out.
Regarding the noise level measured in the different activities, Table 4 shows that there was no signiicant difference in the level of noise between them. However, it was possible to perceive that, in the activity of lunch, the noise level reached higher levels, possibly due to the greater quantity of tableware, as
this is a period with a greater low of people in the restaurant. It is important to mention that there are few studies that used the f-MIRE method in the workplace, as there are still technical dificulties to adapt the probe of the dosimeter to the HP. In addition to this dificulty, one must have caution during the measuring, because the worker’s movement and conversation
can alter the result of the measurements, especially the value of the PEAK. Some studies have found that the personal dosimeter can provide higher values, with a difference, on average, of 2.5 dB(A) when these workers were very close to the sound source or made many movements(29).
However, the mentioned method adopted to evaluate the HP has proven reliable in this study, as the measurement values (in the PM) showed small variations, with relatively small standard deviations, especially when compared to previous studies(24). It is worth mentioning that some authors have cited
the beneit of using the f-MIRE method to evaluate the use of
the HP, mainly for the training of workers for its insertion(30).
In addition, the f-MIRE method can be incorporated into
the HLPP, improving efforts to prevent hearing loss in various situations, such as showing the user the difference between the correct and incorrect insertion of the HP; supporting the selection of plug-type HPs, considering the comfort and attenuation
provided by various devices; determining the suficiency of
protection or the existence of overprotection; recording the procedures that assisted in the selection of HPs; recording the activities involved in training workers for the insertion of the HP (to meet regulatory standards); and gathering evidence to evaluate the effectiveness of the HLPP, among others(9,11,12).
As limitations of this study, there is the small sample of workers, as well as the use of the methodology in only one work environment and the use of a single HP model. Thus, we suggest that future studies are designed with a larger number of individuals, comparing different occupational environments (and different noise levels), as well as comparing different HPs for each individual, which would enable the visualization of which type/model is more adequate for every person and every activity and/or work environment.
CONCLUSION
The indings of this study enabled us to know the personal
level of attenuation of the HP during a real work situation and to collect information about the level of workplace noise to which these workers are exposed.
We concluded that the level of noise to which these employees were exposed during the study is within the limits recommended by the NR-15 and NHO-01, favoring the use and adaptation of the HP. However, situations have been observed in which this level exceeded the safety values; therefore, the use of the HP is recommended. Regarding the attenuation level of the tested HP, it proved effective as it attenuated the noise in all the studied situations.
Finally, it is important that more studies be carried out using
the f-MIRE method, because it was eficient to evaluate the
attenuation level of the HP in the workplace.
REFERENCES
1. Hong O, Kerr MJ, Poling GL, Dhar S. Understanding and preventing noise-induced hearing loss. Dis Mon. 2013;59(4):110-8. http://dx.doi. org/10.1016/j.disamonth.2013.01.002. PMid:23507351.
2. Lynch ED, Kil J. Compounds for the prevention and treatment of noise-induced hearing loss. Drug Discov Today. 2005;10(19):1291-8. http:// dx.doi.org/10.1016/S1359-6446(05)03561-0. PMid:16214673.
3. Nor Saleha IT, Noor Hassim I. A study on compliance to hearing conservation programme among industries in Negeri Sembilan, Malaysia.
Ind Health. 2006;44(4):584-91. http://dx.doi.org/10.2486/indhealth.44.584. PMid:17085919.
4. Brasil. Ministério do Trabalho. Portaria SSST nº 19, de 9 de abril de 1998. Diário Oficial da União, Brasília, 22 de abril de 1998.
5. Daniell WE, Swan SS, McDaniel MM, Camp JE, Cohen MA, Stebbins JG. Noise exposure and hearing loss prevention programmes after 20 years of regulations in the United States. Occup Environ Med. 2006;63(5):343-51. http://dx.doi.org/10.1136/oem.2005.024588. PMid:16551755.
6. Robertson C, Kerr M, Garcia C, Halterman E. Noise and hearing protection:
Latino construction workers’ experiences. AAOHN J. 2007;55(4):153-60.
http://dx.doi.org/10.1177/216507990705500404. PMid:17472130.
7. Rocha CH, Santos LHD, Moreira RR, Neves-Lobo IF, Samelli AG. Verificação da efetividade de uma ação educativa sobre proteção auditiva para trabalhadores expostos a ruído. J Soc Bras Fonoaudiol. 2011;23(1):38-43. PMid:21552731.
8. Gonçalves CGO, Couto CM, Carraro JM, Leonelli BS. Avaliação da colocação de protetores auriculares em grupos com e sem treinamento. Rev CEFAC. 2009;11(2):345-52. http://dx.doi.org/10.1590/S1516-18462009000200021. 9. Schulz TY. Individual fit-testing of earplugs: a review of uses. Noise
Health. 2011;13(51):152-62. http://dx.doi.org/10.4103/1463-1741.77216. PMid:21368441.
10. Neitzel R, Somers S, Seixas N. Variability of real-world hearing protector attenuation measurements. Ann Occup Hyg. 2006;50(7):679-91. http:// dx.doi.org/10.1093/annhyg/mel025. PMid:16782739.
11. Hager LD. Fit-testing hearing protectors: an idea whose time has come. Noise Health. 2011;13(51):147-51. http://dx.doi.org/10.4103/1463-1741.77217. PMid:21368440.
12. Samelli AG, Moreira RR. Saúde auditiva do trabalhador: uma intervenção
necessária. In: Marchesan IQ, Silva HJ, Tomé MC. Tratado das especialidades
em Fonoaudiologia. São Paulo: Rocca; 2014. p. 1046-52.
13. Berger EH. Introducing F-MIRE testing: background and concepts.
Indianapolis: EAR/Aearo Technologies, EARCAL Laboratory; 2007.
14. Berger EH, Voix J, Hager LD. Methods of fit testing hearing protectors,
with representative field test data. In: Hearing Loss: 9th International Congress on Noise as a Public Health Problem (ICBEN); 2008; Foxwoods, CT, USA. Proceedings. The Netherlands: ICBEN; 2008.
16. Vergara EF, Steffani J, Gerges SNY, Pedroso M. Avaliação da exposição de operadores de teleatendimento a ruído. Rev Bras Saúde Ocup. 2006;31(114):161-72. http://dx.doi.org/10.1590/S0303-76572006000200014. 17. McTague MF, Galusha D, Dixon-Ernst C, Kirsche SR, Slade MD, Cullen
MR, et al. Impact of daily noise exposure monitoring on occupational noise
exposures in manufacturing workers. Int J Audiol. 2013;52(Suppl 1):S3-8.
http://dx.doi.org/10.3109/14992027.2012.743047. PMid:23373740. 18. Brasil. Ministério do Trabalho e Previdência Social. FUNDACENTRO.
NHO-01: norma de higiene ocupacional: procedimento técnico: avaliação da exposição ocupacional ao ruído. Brasília; 2001.
19. Campos PD, Mondelli MFCG, Ferrari DV. Comparison: real and simulated ear insertion gain. Braz J Otorhinolaryngol. 2011;77(5):555-8. http://dx.doi. org/10.1590/S1808-86942011000500003. PMid:22030960.
20. Brasil. Ministério do Trabalho e Emprego. Portaria MTb nº 3.214, de 08 de junho de 1978. NR 15: atividades e operações insalubres. Diário Oficial da União, Brasília, 6 de julho de 1978.
21. Dirks DD, Ahlstrom JB, Eisenberg LS. Comparison of probe insertion methods on estimates of ear canal SPL. J Am Acad Audiol. 1996;7(1):31-8. PMid:8718490.
22. Silva APR, Blasca WQ, Lauris JRP, Oliveira JRM. Correlação entre as características da ressonância e o envelhecimento da orelha externa. CoDAS. 2014;26(2):112-6. http://dx.doi.org/10.1590/2317-1782/2014211IN. PMid:24918503.
23. Bastos BG, Ferrari DV, Blasc WQ. Ressonância natural da orelha e sua
relação com os volumes equivalentes das orelhas externa e média. Int Arch
Otorhinolaryngol. 2012;16(3):365-70. PMid:25991959.
24. Casali J, Park M. Laboratory versus field attenuation of selected hearing protectors. Sound Vibrat. 1991;25:28-38.
25. Zimpfer V, Sarafian D. Impact of hearing protection devices on sound localization performance. Front Neurosci. 2004;11(8):1-10. PMid:24966807. 26. Buck K. Performance of different types of hearing protectors undergoing
high-level impulse noise. Int J Occup Saf Ergon. 2009;15(2):227-40. http:// dx.doi.org/10.1080/10803548.2009.11076804. PMid:19534855. 27. Alam N, Sinha V, Jalvi R, Gurnani D, Barot DA, Suryanarayan A. Comparative
study of attenuation measurement of hearing protection devices by real ear
attenuation at threshold method. Indian J Otol. 2013;19(3):127-31. http:// dx.doi.org/10.4103/0971-7749.117477.
28. Royster JD, Berger EH, Merry CJ, Nixon CW, Franks JR, Behar A, et al. Development of a new standard laboratory protocol for estimating the field
attenuation of hearing protection devices. Part I. Research of Working
Group 11, Accredited Standards Committee S12, Noise. Noise J Acoust Soc Am. 1996;99(3):1506-26. http://dx.doi.org/10.1121/1.414729. 29. Silva LF. Ruído, ultrassom e infrassom. In: Mendes R. Patologia do trabalho.
3rd ed. São Paulo: Atheneu; 2013. p. 351-79.
30. Tsukada T, Sakakibara H. A trail of individual education for hearing protection with an instrument that measures the noise attenuation effect of
wearing earplugs. Ind Health. 2008;46(4):393-6. http://dx.doi.org/10.2486/ indhealth.46.393. PMid:18716388.
Author contributions