Effect of Obesity on Gestational and Perinatal
Outcomes
Efeito da obesidade sobre os resultados gestacionais e
perinatais
Sônia Regina Cabral Madi
1Rosa Maria Rahmi Garcia
2Vandrea Carla de Souza
3Renato Luís Rombaldi
1Breno Fauth de Araújo
1José Mauro Madi
11Gynecology and Obstetrics Department, Hospital Geral, Fundação Universidade de Caxias do Sul, Caxias do Sul, Rio Grande do Sul, RS, Brazil
2Endocrinology and Nutrition Department, Fundação Universidade de Caxias do Sul, Caxias do Sul, Rio Grande do Sul, RS, Brazil 3Neonatology Department, Fundação Universidade de Caxias do Sul,
Caxias do Sul, Rio Grande do Sul, RS, Brazil Rev Bras Ginecol Obstet 2017;39:330–336.
Address for correspondence José Mauro Madi, MD, PhD, Hospital Geral de Caxias do Sul, Av. Prof. Antonio Vignolli, 255–Bairro Petrópolis, 95001-970–Caxias do Sul–RS–Brasil
(e-mail: [email protected]).
Keywords
►
obesity
►
body mass index
►
pregnancy outcomes
►
neonatal outcomes
Abstract
Purpose
To assess the impact of pre-pregnancy obesity (body mass index [BMI]
30 kg/m
2) on the gestational and perinatal outcomes.
Methods
Retrospective cohort study of 731 pregnant women with a BMI
30 kg/m
2at the
fi
rst prenatal care visit, comparing them with 3,161 women with a BMI between
18.5 kg/m
2and 24.9 kg/m
2. Maternal and neonatal variables were assessed. Statistical
analyses reporting the demographic features of the pregnant women (obese and
normal) were performed with descriptive statistics followed by two-sided independent
Student
’
s
t
tests for the continuous variables, and the chi-squared (
χ
2) test, or Fisher
’
s
exact test, for the categorical variables. We performed a multiple linear regression
analysis of newborn body weight based on the mother
’
s BMI, adjusted by maternal age,
hyperglycemic disorders, hypertensive disorders, and cesarean deliveries to analyze
the relationships among these variables. All analyses were performed with the R
(R Foundation for Statistical Computing, Vienna, Austria) for Windows software,
version 3.1.0. A value of
p
<
0.05 was considered statistically signi
fi
cant.
Results
Obesity was associated with older age [OR 9.8 (7.8
–
12.2);
p
<
0.01],
hyperglycemic disorders [OR 6.5 (4.8
–
8.9);
p
<
0.01], hypertensive disorders [OR
7.6 (6.1
–
9.5);
p
<
0.01], caesarean deliveries [OR 2.5 (2.1
–
3.0);
p
<
0.01], fetal
macrosomia [OR 2.9 (2.3
–
3.6);
p
<
0.01] and umbilical cord pH [OR 2.1 (1.4
–
2.9);
p
<
0.01). Conversely, no association was observed with the duration of labor,
bleeding during labor, Apgar scores at 1 and 5 minutes after birth, gestational age,
stillbirth and early neonatal mortality, congenital malformations, and maternal and
fetal injury.
received May 29, 2016 accepted March 6, 2017 published online June 23, 2017
DOI https://doi.org/ 10.1055/s-0037-1603826.
ISSN 0100-7203.
Copyright © 2017 by Thieme Revinter Publicações Ltda, Rio de Janeiro, Brazil Original Article
Introduction
Obesity is considered one of the largest global health problems of the 21st century. The World Health Organization (WHO) estimated that in 2008,205 million men and 297 million women over the age of 20 were obese–a total of more than half a billion adults worldwide.1 In the WHO Regions of the Americas,62% of the population over the age of 20 were overweight (body mass index [BMI] 25 kg/m2), and 26%
were obese (BMI30 kg/m2).1,2We should highlight that, in
the WHO Region for Europe, the Eastern Mediterranean and the Americas, over 50% of women were overweight and, of these, about half of overweight women were obese (23%, 24% and 29% respectively).1,2In Brazil, we have little data on the nutritional status of women of reproductive age. Nucci et al3 analyzed the pre-pregnancy nutritional status of women aged 20 to 48 years old between 1991 and 1995. Their study found pre-obesity (BMI between 25 kg/m2and 30 kg/m2) and obesity
(BMI 30 kg/m2) rates of 19.2% and 5.5% respectively.3
Epidemiological data about disease from the Surveillance of
Risk and Protective Factors for Chronic Diseases by Telephone Survey (VIGITEL, in the Portuguese acronym), which is provid-ed by the Brazilian Institute of Geography and Statistics, showed an increased rate of BMI>25 kg/m2 in women
aged between 18–24, 25–34, and 35–44 years old (24.4, 38%, and 50.9% respectively).4Such a scenario suggests that obste-tricians are dealing more frequently with pregnant women who are overweight and obese and, therefore, have increased risks of poor maternal and child health outcomes. Tennant et al5found an increased risk of fetal and infant death in a cohort of women who were obese at the beginning of pregnancy compared with women who had the recommended weight, and preeclampsia commonly caused fetal deaths among obese women. Additionally, Aune et al,6in a systematic review and meta-analysis, showed that high a BMI during pregnancy was associated with fetal death, stillbirth, and neonatal, perinatal, and infant death. Nohr et al7reported an association between high pre-pregnancy BMI and excessive maternal weight gain with an increased risk of cesarean delivery (CD), and infants large for their gestational age or with a low Apgar score.7Even
Conclusion
We observed that pre-pregnancy obesity was associated with maternal
age, hyperglycemic disorders, hypertension syndrome, cesarean deliveries, fetal
macrosomia, and fetal acidosis.
Resumo
Objetivo
Avaliar o impacto da obesidade pré-gestacional (índice de massa corpórea
[IMC]
30 kg/m
2) sobre os resultados gestacionais e perinatais.
Métodos
Estudo transversal retrospectivo, com 731 gestantes que apresentaram
IMC
30 kg/m
2na primeira consulta de pré-natal, comparando-as a 3.161 gestantes
com IMC entre 18,5 kg/m
2e 24,9 kg/m
2. Foram avaliadas variáveis maternas e
neonatais. A análise estatística baseou-se nas características demográ
fi
cas das
gestantes (obesas e com peso normal), e foi realizada com estatísticas descritivas
seguidas de testes t de Student independentes bicaudais para variáveis contínuas, e
teste de qui-quadrado (
χ
2) ou exato de Fisher para as variáveis categóricas. Foi realizada
uma regressão linear múltipla do peso do recém-nascido sobre o IMC materno,
ajustado por idade materna, síndromes hiperglicêmicas, síndromes hipertensivas
hipertensivas e operações cesarianas, a
fi
m de analisar a relação entre essas variáveis.
Todas as análises foram realizadas com o uso de R (R Foundation for Statistical
Computing, Viena, Áustria) para Windows, versão 3.1.0. Um valor de
p
<
0,05 foi
considerado estatisticamente signi
fi
cante.
Resultados
A obesidade associou-se à idade materna [OR 9,8 (7,8
–
12,2);
p
<
0,01],
distúrbios hiperglicêmicos [OR 6.5 (4,8
–
8,9);
p
<
0,01], distúrbios hipertensivos (RP:
7,6 [6,1
–
9,5];
p
<
0,01), maior taxa de operação cesariana [OR 2,5 (2,1
–
3,0);
p
<
0,01], macrossomia fetal [OR 2,9 (2,3
–
3,6);
p
<
0,01] e baixo pH na artéria
umbilical [OR 2,1 (1,4
–
2,9);
p
<
0,01]. Não foi observada associação com tempo de
trabalho de parto, sangramento durante o trabalho de parto, índice de Apgar no 1° e 5°
minutos, idade gestacional, natimortalidade e mortalidade neonatal precoce,
malfor-mações congênitas e tocotraumatismo materno e fetal.
Conclusões
O estudo mostrou que a obesidade pré-gestacional associou-se com
idade materna mais elevada, distúrbios hiperglicêmicos e hipertensivos, taxas mais
altas de operação cesariana, macrossomia e acidose fetal.
Palavras-chave
►
obesidade
►
índice de massa
corpórea
►
desfechos
gestacionais
►
desfechos
in developed countries, obese women tend to have a higher likelihood of urinary tract and lower genital tract infections; induced deliveries; CD;8,9severe bleeding in the puerperium period; puerperal infections;8birth defects; fetal death; fetal macrosomia; and maternal death during pregnancy or at childbirth.10–15The present study was performed to evaluate the association of maternal pre-pregnancy obesity with ges-tational and perinatal outcomes in a population of pregnant women and newborns.
Methods
This retrospective cohort study was performed by reviewing the medical charts at the Department of Gynecology and Obstetrics from March 1998 to June 2010. According to their BMIs in early pregnancy, the pregnant women were catego-rized as: underweight (BMI<18.5 kg/m2); normal weight
(BMI between 18.5 kg/m2and 24.9 kg/m2); overweight (BMI
between 25 kg/m2and 29.9 kg/m2); grade 1 obesity (BMI
between 30 kg/m2and 39.9 kg/m2); and grade 2 and grade 3
obesity (BMI40kg/m2).1All pregnant women with BMI 30kg/m2and their respective newborns were included in
the obese group (OG). And all pregnant women in the normal weight category were included in the normal group (NG).
Obesity at thefirst prenatal visit was considered a predictor variable. The outcome variables were fetal weight and hypergly-cemic and hypertensive disorders. Other maternal information included education (literate or not); gestational age according to thefirst day of the last menstrual period, and confirmed by early ultrasonography and/or Capurro index; parity; CD rate; the duration of labor (in minutes); bleeding during labor; and BMI obtained according to the WHO criteria, and calculated as the ratio between the weight and the height squared.1
Hyperglycemic disorders included gestational diabetes mellitus (GDM), and type 1 and 2 diabetes mellitus (DM1 and DM2), according to the Brazilian Diabetes Society.16
Hypertensive disorders included chronic hypertension, mild and severe preeclampsia, and pre-existing hypertension plus superimposed gestational hypertension, according to the Report of the National High Blood Pressure Education Program Working Group on High Blood Pressure in Pregnancy.17
Neonatal variables included fetal breech presentation diagnosed by delayed ultrasonography or during delivery; birth weight in grams; fetal macrosomia (fetal weight
4,000 g);18large for gestational age (LGA) newborns; fetal birth trauma; requiring admission to the neonatal intensive care unit (NICU); stillbirth and early neonatal mortality rates; malformations identified by ultrasound examination during pregnancy and confirmed in the postnatal period; and pH and base excess in the umbilical cord. Blood samples to perform the blood gas analysis were obtained from the umbilical cord immediately after birth, and were analyzed within 30 minutes using AVL OMNI Modular System equip-ment (Roche Diagnostics, Graz, Austria). The pH rates7.10 and<7.3 were considered normal, and pH rates<7.10
were associated with acidotic fetuses.19 The Apgar scores at 1 minute and 5 minutes20,21were assessed during thefirst attendance in the delivery room.
The research project was approved by the Research Ethics Committee of our institution under number 142/2010.
Statistical Analysis
The demographic characteristics of the pregnant women (obese and normal) were analyzed using descriptive statis-tics followed by two-sided independent Student’sttests for the continuous variables, and the chi-squared (χ2) test or
Fisher’s exact test for the categorical variables. The relative risk was estimated as the ratio between the probability of developing an adverse outcome (that is, hyperglycemic or hypertensive disorders, macrosomia, stillbirth) in the obese group and the probability of the event occurring in the non-obese group. The data were presented as mean and standard deviation, unless otherwise indicated. We performed a multiple linear regression to investigate the effects of obesity in the newborns’ body weight, adjusted by maternal age, hyperglycemic disorders and hypertensive disorders. All analyses were performed using the R (R Foundation for Statistical Computing, Vienna, Austria) for Windows soft-ware, version 3.1.0. A value of p<0.05 was considered
statistically significant.
Results
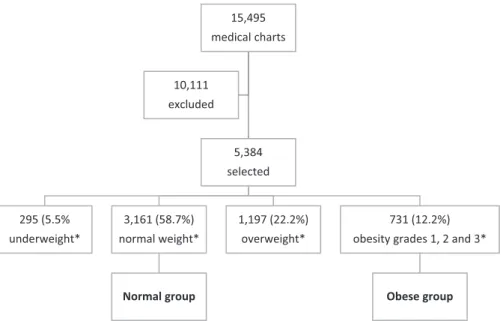
Out of the 15,495 deliveries performed at the Department of Gynecology and Obstetrics from March 1998 to June 2010, 10,111 did not have data in the medical charts about weight or height in early pregnancy, and they were excluded. Thus, 5,384 medical charts were selected. According to the BMI in early pregnancy, 295 (5.5%) pregnant women were catego-rized as underweight; 3,161 (58.7%) as normal weight; 1,197 (22.3%) as overweight; 662 (12.3%) as having grade 1 obesity; and 69 (1.3%) as having grades 2 and 3 obesity.
All pregnant women with BMIs 30 kg/m2 (n¼731;
18.8%) and their respective newborns were included in the OG. All pregnant women with BMIs between 18.5 kg/m2and
24.9 kg/m2(n¼3,161; 81.2%) and their respective newborns
were included in the NG. Thus, 3,892 pregnant women were included in this study (►Table 1,►Fig. 1).
The women were older in the OG than in the NG (28.86.9 versus 24.38.6;p<0.01), and there were 6.7 times more
pregnant women older than 35 years of age in the OG than in the NG (35.6% versus 5.3%;p<0.01) (►Table 1).
Hyperglycemic disorders (14.5% versus 2.5%; p<0.01)
and hypertensive disorders (33.5% versus 6.2%, p<0.01)
were more incident in the OG than in the NG. The incidence of CD in the OG was 2.5 higher than in the NG (51.2% versus 29.4%;p<0.01). The variables education, duration of labor,
and hemorrhage during labor and delivery were similar in both groups (►Table 1).
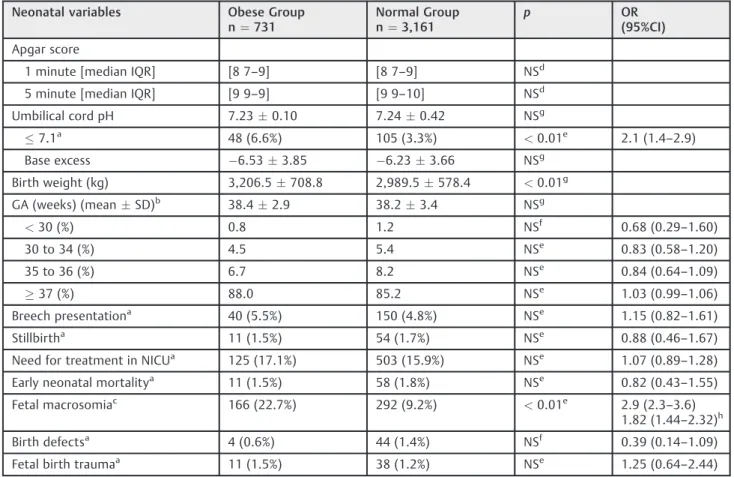
Regarding the neonatal variables in both groups (►Table 2),
the highest rate of fetal acidosis (6.6 versus 3.3%;p<0.01) and
macrosomic neonates (22.7% versus 9.2%;p<0.01) occurred
in the OG (►Table 2). The multiple linear regression analysis
statistically different between the groups (p<0.01), only 1.5%
of the variability in newborn weight can be explained by the model. The neonatal variables defined as base excess, gesta-tional age, Apgar score, breech presentation, stillbirth, NICU, early neonatal mortality, birth defects, and fetal birth trauma were not different between the two study groups.
Discussion
Our institution is responsible for50% of births in the Public Health System for the municipality and surrounding munic-ipalities; therefore, it provides a large population sample. This study strengthens the evidence that demonstrates the
15,495
medical charts
5,384
selected
295 (5.5%
underweight*
3,161 (58.7%)
normal weight*
Normal group
1,197 (22.2%)
overweight*
731 (12.2%)
obesity grades 1, 2 and 3*
Obese group 10,111
excluded
Fig. 1 Theflow of the selected population through the study. Notes:Underweight: BMI
<18.5 kg/m2; normal weight: BMI between 18.5 kg/m2and 24.9 kg/m2; overweight: BMI between 25 kg/m2and 29.9 kg/m2; obesity grades 1, 2, and 3: BMI30 kg/m2.
Table 1 Distribution of maternal and obstetric variables in the sample (n¼3,892) from our institution, 1998–2010
Maternal and obstetric variables Obese Group (n¼731)
Normal Group (n¼3,161)
p OR
(95%CI)
Age (meanSD) 28.86.9 24.38.6 <0.01d –
Age35a 260 (35.6%) 169 (5.3%) <0.01b 9.8 (7.8–12.2)
Educationa
Illiteratea 9 (1.2%) 27 (0.9%) NSc 1.44 (0.68
–3.05)
Literatea 714 (97.7%) 3,076 (97.3%) NSb 1.00 (0.99
–1.01)
Parity (mean) 1.80.5 1.20.4 NSd
Hyperglycemic disordersa 106 (14.5%) 80 (2.5%) <0.01b 6.5 (4.8
–8.9)
Hypertensive disordersa 245 (33.5%) 196 (6.2%) <0.01b 7.6 (6.1
–9.5)
Cesarean deliverya 374 (51.2%) 929 (29.4%) <0.01b 2.5 (2.1
–3.0)
Duration of labora
360 minutesa 79 (10.8%) 390 (12.3%) NSb 0.87 (0.69–1.10)
>360minutesa 367 (50.2%) 2,057 (65.1%) NSb 0.77 (0.71–0.83)
Bleeding during labora 6 (0.8%) 22 (0.7%) NSc 1.14 (0.56
–2.32)
Abbreviations: CI, confidence interval;; n, sample size; NS, not statistically significant; OR, odds ratio; SD, standard deviation.
Notes: Obese group: composed of pregnant women with BMIs30 kg/m2); normal group: composed of pregnant women with BMIs between 18.5 kg/m2 and 24.9 kg/m2.
Hyperglycemic disorders: gestational diabetes mellitus, and types 1 and 2 diabetes mellitus; hypertensive disorders: chronic hypertension, mild and severe preeclampsia, and pre-existing hypertension plus superimposed gestational hypertension.
aResults expressed in absolute number and percentage; bchi-squared test;
cFisher
’s exact test;
direct association of obesity assessed by BMI with disorders during pregnancy, as well as a greater number of obstetric interventions. The data show that women older than 35 years of age were 2.5 times more likely to be obese than younger women. This observation is consistent with the studies by Pleis et al22and Gross et al,23who also reported that older pregnant women among obese pregnant women had higher parity compared with the control group. On the other hand, Stepan et al13 observed no significant difference between maternal age and gestational age in the comparison between groups with and without obesity. Studies have reported a higher risk of complications in women who start their pregnancies with a BMI above normal.7,23,24 Furthermore, obesity was related to an increased risk of preeclampsia and GDM, CD, hemorrhage, puerperal infections, birth defects, fetal death, fetal macrosomia, and maternal death during pregnancy and childbirth.8,10,13
Torloni et al25observed that GDM was present in 24.5% of the cases of morbid obesity, and in 14.2% of pregnant women with BMI35 kg/m2.25Our data show that obese women
have a 6 times greater risk of developing hyperglycemic disorders (14.4% versus 2.5%), and such results are consistent with those of other authors.9,23,26
We found that obesity in early pregnancy was associated with an increased risk of hypertensive disorders (33.5% versus 6.2%). These data are corroborated by the literature.9,24,26We also found a higher CD rate in the OG (51% versus 29.4%). This fact can be explained by the increased number of elective and iterative CDs, and fetopelvic disproportion, which is common-ly related to fetal macrosomia. In this study, the risk of CD was 1.7 times higher in the OG. These results are in agreement with previously published studies.9,27,28This rate can be explained by the maternal and fetal risks, in addition to the ethical and legal aspects regarding vaginal birth after cesarean.
Table 2 Distribution of neonatal variables in the sample (n¼3,892) from our institution, 1998–2010
Neonatal variables Obese Group n¼731
Normal Group n¼3,161
p OR
(95%CI) Apgar score
1 minute [median IQR] [8 7–9] [8 7–9] NSd
5 minute [median IQR] [9 9–9] [9 9–10] NSd
Umbilical cord pH 7.230.10 7.240.42 NSg
7.1a 48 (6.6%) 105 (3.3%) <0.01e 2.1 (1.4–2.9)
Base excess 6.533.85 6.233.66 NSg
Birth weight (kg) 3,206.5708.8 2,989.5578.4 <0.01g
GA (weeks) (meanSD)b 38.42.9 38.23.4 NSg
<30 (%) 0.8 1.2 NSf 0.68 (0.29–1.60)
30 to 34 (%) 4.5 5.4 NSe 0.83 (0.58
–1.20)
35 to 36 (%) 6.7 8.2 NSe 0.84 (0.64
–1.09)
37 (%) 88.0 85.2 NSe 1.03 (0.99–1.06)
Breech presentationa 40 (5.5%) 150 (4.8%) NSe 1.15 (0.82
–1.61)
Stillbirtha 11 (1.5%) 54 (1.7%) NSe 0.88 (0.46
–1.67)
Need for treatment in NICUa 125 (17.1%) 503 (15.9%) NSe 1.07 (0.89
–1.28)
Early neonatal mortalitya 11 (1.5%) 58 (1.8%) NSe 0.82 (0.43
–1.55)
Fetal macrosomiac 166 (22.7%) 292 (9.2%) <0.01e 2.9 (2.3
–3.6)
1.82 (1.44–2.32)h
Birth defectsa 4 (0.6%) 44 (1.4%) NSf 0.39 (0.14
–1.09)
Fetal birth traumaa 11 (1.5%) 38 (1.2%) NSe 1.25 (0.64
–2.44)
Abbreviations: CI, confidence interval; GA, gestational age; IQR, interquartile range; NICU, Neonatal Intensive Care Unit; NS, not statistically significant; OR, odds ratio; SD, standard deviation.
Notes: Early neonatal mortality: less than 7 days;
aresults expressed in absolute numbers and percentages; bresults expressed as meanstandard deviation; cFetal macrosomia, fetal weight4,000 g; dMann Whitney Wilcoxon test;
echi-squared test; fFisher
’s exact test;
The results pertaining to the newborns showed a signifi -cant increase in acidosis (pH of the umbilical cord blood
7.10) in newborns from obese mothers.29Conner et al30 also found that an increase in BMI was associated with a statistically significant increased risk of arterial cord blood pH<7.20 and base excess< 8.
Stepan et al13observed a greater need for intubation pro-cedures and cardiac resuscitation in infants from obese moth-ers. Our study did not assess the need for intubation procedures or cardiac resuscitation; however, the analysis of the variables requiring treatment at a NICU and early neonatal mortality did not differ between the groups. This suggests that adequate perinatal care might have reduced the risk of complications.
The correlation of the Apgar score with neonatal health and survival is widely established.12,30,31This parameter was assessed in our study and showed no significant difference between the groups. In a similar study, Stepan et al13showed low Apgar scores at minute 1 along with the improvement at minutes 5 and 10. On the other hand, in a retrospective cohort study, Abenhaim et al31observed the higher risk of an Apgar score3 at 5 minutes among obese women com-pared with women with normal BMIs.30
Fetal birth weight was statistically higher in the newborns of obese mothers (3,200 g708 g) compared with non-obese mothers (2,989 g578 g). Similarly, Bautista-Castaño et al32reported that newborn weight was directly related to maternal baseline BMI. In relation to intrauterine growth restriction, our data indicate that fetal growth restriction was not influenced by BMI; however, Perlow et al33suggested an increased risk in massive obesity.
The current study did not identify a relationship between preterm deliveries and obesity. The reports about preterm delivery and obesity have been contradictory. Kumari et al34 observed a decreased risk of preterm deliveries in obese women with BMIs>40 kg/m2compared with women with
normal BMIs (0.5 versus 5.3%;p<0.01), which is contrary to
the observations of Baeten et al.35
Although many studies have demonstrated that maternal obesity is an independent risk of occurrence of fetal neural tube defects, cardiac malformations, and orofacial clefts,35–38 our study did notfind this.
A potential limitation of our study is its retrospective design. Additionally, this study did not assess the effect of gestational weight gain among the obese and control groups. It is known that women who gain weight excessively or inadequately during pregnancy are at increased risks of poor maternal and child health outcomes.39–42
In summary, our study shows that the obese women were older than the controls, and that obesity in early pregnancy increased the risk of hyperglycemic disorders, hypertensive disorders, cesarean delivery, fetal macrosomia, and fetal acidosis.
References
1 World Health Organization [Internet]. Global Health Observa-tory (GHO). Obesity: situation and trends. 2016 [cited 2016 Sep 10]. Available from: http://www.who.int/gho/ncd/risk_fac-tors/obesity_text/en
2 World Health Organization [Internet]. Global Health Observatory (GHO) data. Overweight and obesity. 2016 [cited 2016 Sep 10]. Available from: http://www.who.int/gho/ncd/risk_factors/over-weight/en
3 Nucci LB, Schmidt MI, Duncan BB, Fuchs SC, Fleck ET, Santos Britto MM. Nutritional status of pregnant women: prevalence and associated pregnancy outcomes. Rev Saude Publica 2001; 35(06):502–507
4 Brasil. Ministério da Saúde. Secretaria de Vigilância em Saúde [Internet]. Vigitel Brasil 2013: vigilância de fatores de risco e proteção para doenças crônicas por inquérito telefônico. Brasília (DF): Ministério da Saúde; 2014 [cited 2016 Set 10]. Available from: https://biavati.files.wordpress.com/2014/05/vigitel-2013.pdf 5 Tennant PW, Rankin J, Bell R. Maternal body mass index and the
risk of fetal and infant death: a cohort study from the North of England. Hum Reprod 2011;26(06):1501–1511
6 Aune D, Saugstad OD, Henriksen T, Tonstad S. Maternal body mass index and the risk of fetal death, stillbirth, and infant death: a systematic review and meta-analysis. JAMA 2014;311(15):1536–1546 7 Nohr EA, Vaeth M, Baker JL, Sørensen TIa, Olsen J, Rasmussen KM. Combined associations of prepregnancy body mass index and gestational weight gain with the outcome of pregnancy. Am J Clin Nutr 2008;87(06):1750–1759
8 Sebire NJ, Jolly M, Harris JP, et al. Maternal obesity and pregnancy outcome: a study of 287,213 pregnancies in London. Int J Obes Relat Metab Disord 2001;25(08):1175–1182
9 Chu SY, Kim SY, Schmid CH, et al. Maternal obesity and risk of cesarean delivery: a meta-analysis. Obes Rev 2007;8(05):385–394 10 Cedergren MI. Maternal morbid obesity and the risk of adverse
pregnancy outcome. Obstet Gynecol 2004;103(02):219–224 11 Anderson JL, Waller DK, Canfield MA, Shaw GM, Watkins ML,
Werler MM. Maternal obesity, gestational diabetes, and central nervous system birth defects. Epidemiology 2005;16(01):87–92 12 Ray JG, Wyatt PR, Vermeulen MJ, Meier C, Cole DE. Greater maternal weight and the ongoing risk of neural tube defects after folic acid
flour fortification. Obstet Gynecol 2005;105(02):261–265 13 Stepan H, Scheithauer S, Dornhöfer N, Krämer T, Faber R. Obesity
as an obstetric risk factor: does it matter in a perinatal center? Obesity (Silver Spring) 2006;14(05):770–773
14 Rasmussen SA, Chu SY, Kim SY, Schmid CH, Lau J. Maternal obesity and risk of neural tube defects: a metaanalysis. Am J Obstet Gynecol 2008;198(06):611–619
15 Johansson S, Villamor E, Altman M, Bonamy AKE, Granath F, Cnattingius S. Maternal overweight and obesity in early preg-nancy and risk of infant mortality: a population based cohort study in Sweden. BMJ 2014;349:g6572
16 Institute of Medicine. National Research Council. Committee to Reexamine IOM Pregnancy Weight Guidelines. Food and Nutri-tion Board and Board on Children, Youth and Families. Weight gain during pregnancy: reexamining the guidelines. Washington (DC): National Academies Press; 2009
17 Sociedade Brasileira de Diabetes [Internet]. Diretrizes Sociedade Brasileira de Diabetes 2015–2016. 2016 [cited 2016 Set 26]. Available from: http://bibliofarma.com/diretrizes-sbd-2015-2016/ 18 Report of the National High Blood Pressure Education Program Working Group on High Blood Pressure in Pregnancy. Am J Obstet Gynecol 2000;183(01):S1–S22
19 Battaglia FC, Lubchenco LO. A practical classification of newborn infants by weight and gestational age. J Pediatr 1967;71(02):159–163 20 ACOG Committee on Obstetric Practice. ACOG Committee Opi-nion No. 348, November 2006: Umbilical cord blood gas and acid-base analysis. Obstet Gynecol 2006;108(05):1319–1322 21 Casey BM, McIntire DD, Leveno KJ. The continuing value of the
Apgar score for the assessment of newborn infants. N Engl J Med 2001;344(07):467–471
23 Gross T, Sokol RJ, King KC. Obesity in pregnancy: risks and outcome. Obstet Gynecol 1980;56(04):446–450
24 Bodnar LM, Catov JM, Klebanoff MA, Ness RB, Roberts JM. Prepreg-nancy body mass index and the occurrence of severe hypertensive disorders of pregnancy. Epidemiology 2007;18(02):234–239 25 Torloni MR, Betrán AP, Horta BL, et al. Prepregnancy BMI and the
risk of gestational diabetes: a systematic review of the literature with meta-analysis. Obes Rev 2009;10(02):194–203
26 Baron CM, Girling LG, Mathieson AL, et al. Obstetrical and neonatal outcomes in obese parturients. J Matern Fetal Neonatal Med 2010;23(08):906–913
27 Chandrasekaran S, Levine LD, Durnwald CP, Elovitz MA, Srinivas SK. Excessive weight gain and hypertensive disorders of preg-nancy in the obese patient. J Matern Fetal Neonatal Med 2015; 28(08):964–968
28 Rode L, Nilas L, Wøjdemann K, Tabor A. Obesity-related complica-tions in Danish single cephalic term pregnancies. Obstet Gynecol 2005;105(03):537–542
29 Gunatilake RP, Smrtka MP, Harris B, et al. Predictors of failed trial of labor among women with an extremely obese body mass index. Am J Obstet Gynecol 2013;209(06):562.e1–562.e5
30 Conner SN, Tuuli MG, Longman RE, Odibo AO, Macones GA, Cahill AG. Impact of obesity on incision-to-delivery interval and neo-natal outcomes at cesarean delivery. Am J Obstet Gynecol 2013; 209(04):386.e1–386.e6
31 Abenhaim HA, Kinch RA, Morin L, Benjamin A, Usher R. Effect of prepregnancy body mass index categories on obstetrical and neonatal outcomes. Arch Gynecol Obstet 2007;275(01):39–43 32 Bautista-Castaño I, Henriquez-Sanchez P, Alemán-Perez N, et al.
Maternal obesity in early pregnancy and risk of adverse outcomes. PLoS One 2013;8(11):e80410
33 Perlow JH, Morgan MA, Montgomery D, Towers CV, Porto M. Perinatal outcome in pregnancy complicated by massive obesity. Am J Obstet Gynecol 1992;167(4 Pt 1):958–962
34 Kumari AS. Pregnancy outcome in women with morbid obesity. Int J Gynaecol Obstet 2001;73(02):101–107
35 Baeten JM, Bukusi EA, Lambe M. Pregnancy complications and outcomes among overweight and obese nulliparous women. Am J Public Health 2001;91(03):436–440
36 Shaw GM, Velie EM, Schaffer D. Risk of neural tube defect-affected pregnancies among obese women. JAMA 1996; 275(14):1093–1096
37 Watkins And ML, Botto LD. Maternal prepregnancy weight and congenital heart defects in the offspring. Epidemiology 2001;11 (04):439–446
38 Watkins ML, Rasmussen SA, Honein MA, Botto LD, Moore CA. Maternal obesity and risk for birth defects. Pediatrics 2003;111 (5 Pt 2):1152–1158
39 Stothard KJ, Tennant PW, Bell R, Rankin J. Maternal overweight and obesity and the risk of congenital anomalies: a systematic review and meta-analysis. JAMA 2009;301(06):636–650 40 Paulino DS, Surita FG, Peres GB, do Nascimento SL, Morais SS.
Association between parity, pre-pregnancy body mass index and gestational weight gain. J Matern Fetal Neonatal Med 2016; 29(06):880–884
41 Godoy AC, Nascimento SL, Surita FG. A systematic review and meta-analysis of gestational weight gain recommendations and related outcomes in Brazil. Clinics (Sao Paulo) 2015;70(11): 758–764