273
Radiol Bras. 2013 Set/Out;46(5):273–278
The role of ultrasonography in the measurement of subcutaneous
and visceral fat and its correlation with hepatic steatosis
*
O papel da ultrassonografia na medida da gordura subcutânea e visceral e sua correlação com a esteatose hepática
Roberto Velloso Eifler1
Objective: To evaluate the sonographic measurement of subcutaneous and visceral fat in correlation with the grade of hepatic steatosis. Materials and Methods: In the period from October 2012 to January 2013, 365 patients were evaluated. The subcutaneous and visceral fat thicknesses were measured with a convex, 3–4 MHz transducer transversely placed 1 cm above the umbilical scar. The distance between the internal aspect of the abdominal rectus muscle and the posterior aortic wall in the abdominal midline was considered for measurement of the visceral fat. Increased liver echogenicity, blurring of vascular margins and increased acoustic attenuation were the parameters considered in the quantification of hepatic steatosis. Results: Steatosis was found in 38% of the study sample. In the detection of moderate to severe steatosis, the area under the ROC curve was 0.96 for women and 0.99 for men, indicating cut-off values for visceral fat thickness of 9 cm and 10 cm, respectively. Conclusion: The present study evidenced the correlation between steatosis and visceral fat thickness and suggested values for visceral fat thickness to allow the differentiation of normality from risk for steatohepatitis.
Keywords: Abdominal fat; Steatosis; Metabolic syndrome; Ultrasonography.
Objetivo: Avaliar as medidas ultrassonográficas da gordura subcutânea e da gordura visceral em comparação com o grau de esteatose hepática. Materiais e Métodos: Foram avaliados 365 pacientes entre outubro de 2012 e janeiro de 2013. A gordura subcutânea e a gordura visceral foram medidas com transdutor convexo de 3 a 4 MHz colocado trans-versalmente 1 cm acima da cicatriz umbilical. Para a gordura visceral, considerou-se a distância entre a face interna do músculo reto abdominal e a parede posterior da aorta na linha média do abdome. A quantificação da esteatose hepá-tica levou em consideração o aumento da ecogenicidade do fígado, a perda de definição das margens vasculares e o aumento da atenuação acústica. Resultados: Em 38% da amostra constatou-se esteatose. Na detecção de esteatose moderada a severa, a área sob a curva ROC foi 0,96 para mulheres e 0,99 para homens, indicando pontos de corte para a espessura da gordura visceral de 9 cm e de 10 cm, respectivamente. Conclusão: Comprovou-se correlação entre esteatose e espessura da gordura visceral e foram sugeridos valores para a espessura da gordura visceral que permitem distinguir a normalidade da esteatose simples e do risco de esteato-hepatite.
Unitermos: Gordura abdominal; Esteatose; Síndrome metabólica; Ultrassonografia.
Abstract
Resumo
* Study developed at the Unit of Ultrasonography, Funda-ção Riograndense Universitária de Gastroenterologia (Fugast), Porto Alegre, RS, Brazil.
1. MD, Specialist in Radiology and Imaging Diagnosis, Fun-dação Riograndense Universitária de Gastroenterologia (Fugast), Porto Alegre, RS, Brazil.
Mailing Address: Dr. Roberto Velloso Eifler. Rua Cabral, 983/ 302, Rio Branco. Porto Alegre, RS, Brazil, 90420-121. E-mail: [email protected].
Received March 7, 2013. Accepted after revision May 27, 2013.
Eifler RV. The role of ultrasonography in the measurement of subcutaneous and visceral fat and its correlation with hepatic steatosis. Radiol Bras. 2013 Set/Out;46(5):273–278.
times greater risk for cardiovascular mor-bidity than individuals without MS(4).
Non alcoholic fatty liver disease (NAFLD) corresponds to the clinical mani-festation of metabolic syndrome, covering a wide spectrum of liver lesions from be-nign steatosis to non alcoholic steatohepa-titis (NASH) with high risk for progression to cirrhosis and hepatocellular carcinoma(5). NAFLD can be diagnosed by imaging stud-ies such as ultrasonography (US), com-puted tomography (CT) and magnetic reso-nance imaging (MRI). Although US dem-onstrates lower accuracy than CT and MRI in the detection of NAFLD, the low cost and easy make this method the most uti-Reaven(2) observed that obesity was many
times associated with diseases such as ar-terial hypertension, hyperglycemia, dys-lipidemia and, mainly, that such hemody-namic and metabolic alterations had a com-mon connection with insulin resistance. Based on such observations the concept of metabolic syndrome (MS) was consoli-dated.
The prevalence of MS is currently esti-mated to be between 20% and 25% of the general population, with increasing indi-ces(3). The relevance of the diagnosis of MS became clear once its relationship with cardiovascular diseases was confirmed. Individuals with MS present two to three INTRODUCTION
lized diagnostic tool in the initial evalua-tion of liver parenchymal alteraevalua-tions(6).
US, like CT and MRI, cannot differen-tiate steatosis from NASH, which still re-mains as a capacity of the histopathologi-cal study(7). However, steatosis can be quantified by US as mild (grade 1), mod-erate (grade 2) and severe (grade 3), and such quantification is fairly correlated with CT, MRI and histopathological analysis(8,9). According to some authors(10), US may present 89% sensitivity and 93% specific-ity in the identification of steatosis. On the other hand, other authors report sensitivity up to 94% and specificity up to 100%(11).
The criteria for quantifying steatosis present little variations among the several authors. The classification proposed by Saadeh et al.(9) is a good example:
– Grade 1 (mild): diffuse increase in liver echogenicity, with normal visualization of intrahepatic vessels and of the dia-phragm.
– Grade 2 (moderate): Blurred visualiza-tion of intrahepatic vessels and of the diaphragm.
– Grade 3 (severe): intrahepatic vessels, diaphragm and the posterior region of the liver cannot be visualized. Recent studies correlating US with his-topathological analysis confirm that US is a relevant noninvasive tool for evaluating NAFLD(12,13) and intend to demonstrate that the normal or grade 1 liver echogeni-city rules out NAFLD and removes the ne-cessity of liver biopsy(14,15).
In the last years, another important role has been assigned to US in the evaluation of MS, besides the quantification of steato-sis. As already seen, obesity is closely re-lated to the diagnosis of MS. On the other hand, it was observed that obesity, as usu-ally evaluated by anthropometric measure-ments, presented idiosyncrasies, for ex-ample, individuals with low body mass índex might present high incidence of typi-cal alterations of MS. This has typi-called the attention to the fact that the fat distribution, rather than the total excess of fat, would be related to the insulin resistance and, con-sequently, to the metabolic syndrome(3). Since then, the relationship between sub-cutaneous/gluteofemoral/visceral fat and the insulin action have been studied exten-sively and nowadays one can affirm that at
least the association between visceral fat and MS components is already well estab-lished(16,17). Imaging studies are the meth-ods of choice to evaluate and quantify vis-ceral fat. In 1983, Tokunaga et al. established criteria for evaluating body fat by CT. Cur-rently, CT is considered as the gold stan-dard for evaluating intra-abdominal fat (16), but in truth it is highly expensive, lacks prac-ticality and exposes the patient to ionizing radiation. Criteria for evaluating visceral fat with good accuracy by MRI were also de-veloped, but this method, more than CT, is subjected to artifacts and, also, its variation coefficient is also higher(18). Anthropomet-ric measurements are most frequently uti-lized in the evaluation of body fat, but such method has demonstrated to be incapable of differentiating visceral from subcutane-ous fat, besides the relatively high intra and interobserver variability(19).
In contrast to the disadvantages of CT, MRI and anthropometric measurements, US has shown to be a simple, low-cost method without radiation risk, and with already proved reproducibility and reliabil-ity in the quantification of visceral fat(20–22). The sonographic technique consists in separately measuring the abdominal, sub-cutaneous and visceral fat thickness with a 3–4 MHz transducer placed 1 cm above the umbilical scar. The studies developed by Armellini et al.(20) have demonstrated that the visceral fat thickness measured by this technique is fairly correlated with the area of such tissue quantified by CT. In 2002, Leite et al. defined the values of 8 cm as visceral fat thickness for women and 9 cm for men as associated with a higher cardio-vascular risk(23). In 2003, Ribeiro Filho et al. proposed the value of 7 cm for the di-agnosis of visceral obesity in women(24). In 2009, Diniz et al., in a study involving 50 patients indistinct of gender, established mean values with respective standard de-viations corresponding to 2.64 cm ± 1.37 for subcutaneous fat thickness and 6.84 cm ± 2.38 for visceral fat thickness(25).
Considering the author’s activities in-volving US in the investigation of gastroen-terological conditions, the mentioned stud-ies originality, simplicity and efficacious-ness have called his attention. However, such studies have called the author’s atten-tion principally because of the fact that, in
spite of showing a promising pathway, most of them remained as isolated experi-ments lacking follow-up. The author’s con-clusion is that this is a further example of what happens nowadays in the medicine field: the knowledge compartmentaliza-tion. The evaluation of visceral fat is highly interesting for different medical specialties such as gastroenterology, hepatology, endo-crinology, cardiology and other medical specialties devoted to the study of obesity and metabolism. However, it is not in-cluded in the sonographic routine. Sono-graphists follow correct protocols which, however, are failing in meeting the specific necessities of an increasing number of spe-cialties.
The author’s objective is adding infor-mation to the work of those researchers, particularly the Brazilian ones, such as Leite et al.(23), Ribeiro Filho et al.(24) and Diniz et al.(25), who are concerned in defin-ing normal and risk values for subcutane-ous and visceral fat thickening. The corre-lation with the grade of steatosis estab-lished by US, whose criterion is already well defined, will be utilized by the authors of the present study for determining a cut-off value to identify those individuals with at higher risk for steatohepatitis.
MATERIALS AND METHODS
In the present study, 365 patients of a clinic specialized in gastroenterology in Porto Alegre, RS, Brazil were consecu-tively and randomly assessed regardless of their complaints and symptoms, in the pe-riod from October 15, 2012 to January 25, 2013. Only chronic diseases such as alco-holism, cirrhosis, lymphoma, and renal fail-ure, besides history of bariatric or aesthetic surgery determined exclusion from the present study.
All the patients were evaluated by an ex-perienced sonographist whose daily prac-tice at least for ten years has involved the quantification of steatosis and during the preceding ten months had measured subcu-taneous and visceral fat on a daily basis. The measurement of perirenal fat was not considered because of its still controversial reproducibility.
convex, 3–4 MHz transducer. The utiliza-tion of a linear transducer for measuring subcutaneous fat was not considered nec-essary since the differences between mea-surements with convex and linear transduc-ers were non-significant, so the technique proposed by Radominski et al.(21)was uti-lized.
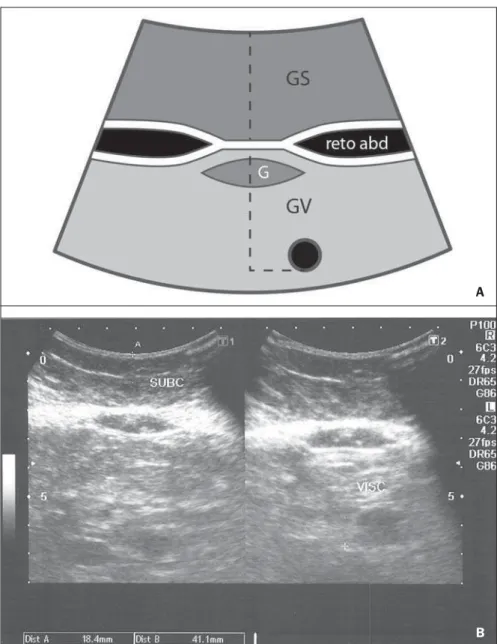
The criteria for steatosis quantification followed the classification developed by Saadeh et al.(9), except for the classification of mild steatosis (grade 1) where the pres-ence of small focal hypoechoic areas on the liver parenchyma, particularly in the peri-portal and perivascular regions, prevailed over the distinction between the hepatic echotexture and the right kidney cortex echotexture which is fairly dependent on subjectivity and on an ideally standardized renal echotexture. Focal hypoechoic areas are caused by venous systems (generally cholecystic or parabiliary) independent or relatively independent from the portal sys-tem which locally reduce the portal perfu-sion and, consequently, determine focal metabolic changes which generate areas free from adipose tissue accumulation(26). Measurements of subcutaneous and vis-ceral fat thickness were performed with the patient positioned in dorsal decubitus and right arm elevation, and the convex 3–4 MHz transducer cross-sectionally placed on the midline, 1 cm above the umbilical scar, during the expiratory phase, without pressure on the abdomen in order not to distort the measurement(25). Subcutaneous fat thickness corresponded to the distance in centimeters between the skin and the anterior surface of the linea alba which is the tendinous raphe that unites the two halves of the rectus abdominus muscle. Visceral fat thickness corresponded to the distance in centimeters between the poste-rior surface of the linea alba and the plane of the posterior aortic wall (Figure 1). It is convenient to observe that the linea alba is many times thick, allowing the distinction between the anterior and posterior surfaces, or many times thin, showing up on the im-ages as a trace. In the latter case, the trace is considered as the anterior and posterior surfaces for the purpose of measurement. Generally, there is accumulation of extra-peritoneal fat on the midline, right under the linea alba, showing up as hypoechoic
and ellipsoid image; for the purposes of measurement, such fat is included in the visceral fat thickness. The aorta is usually located at left from the midline, and once its image is identified, a horizontal line is drawn, passing through its posterior wall up to the midline. At the intersection of such a line with the line from the linea alba (first caliper) the second caliper is positioned to measure the visceral fat thickness.
RESULTS
In the present study, 365 patients in the age range between 16 and 92 years (mean 52.9 years) were evaluated, and a
correla-tion was established between the patients’ sex and presence of steatosis (Table 1).
About 38% of the study population pre-sented steatosis, without statistically signifi-cant difference between men and women. Based on data showing that US may present high sensitivity and specificity in the identification of steatosis(11), and consid-ering that normal liver echogenicity prac-tically rules out histological NAFLD(14,15), subcutaneous and visceral fat thicknesses were evaluated in steatosis-free individu-als. For the women the subcutaneous fat thickness was 2.51 cm ± 1.94, and for the men, 2.14 cm ± 1.38 (p = 0.004; Student t test). Visceral fat thickness was 5.38 cm ± Figure 1.A: Scheme of measurements of subcutaneous and visceral fat thickness. B: Sonographic im-age showing measurements of subcutaneous and visceral fat thickness.
A
2.74 for the women and 6.78 cm ± 2.66 for the men (p < 0.001; Student t test).
It was possible to observe that the sub-cutaneous fat is on average 17% thicker in women than in steatosis-free men. On the other hand, visceral fat was on average 26% thicker in men than in steatosis-free women. On the basis of such data, the authors de-cided to pay special attention to the differ-ence between men and women as subcuta-neous and visceral fat were quantified per age range.
Female individuals
Based on studies demonstrating that obesity presents its highest peak between the ages of 45 and 64 years, 149 steatosis-free women were evaluated up to achieve a definitive distribution among three dis-tinctive and more homogeneous age groups (Table 2).
The mean visceral fat thickness for all the 149 steatosis-free women was 5.38 cm ± 2.74. No statistically significant variation was observed in subcutaneous fat thickness among age groups in steatosis-free women. The 85 women with steatosis were dis-tributed according the degree of fatty infil-tration (Table 3).
A progressive and statistically signifi-cant increase in visceral fat thickness was observed with the increase in the grade of steatosis in women. On the other hand, the subcutaneous fat thickness did not present any relevant alteration among the different grades of steatosis.
Male individuals
As among women, the sample of 131 male steatosis-free patients was divided into three age groups (Table 4).
Also, no significant variation was dem-onstrated in subcutaneous fat thickness in the different age groups among steatosis-free men. Despite the statistical signifi-cance observed as regards visceral fat
The 55 men with steatosis were distrib-uted according to degree of fatty infiltration (Table 5).
Similarly to the women, subcutaneous fat thickness among the different grades of steatosis in men did not present any statis-tically significant difference. On the other hand, a progressive and statistically signifi-cant increase in visceral fat thickness was observed with the increase in steatosis.
Statistical analysis
Subcutaneous fat was disregarded for lacking statistical significance, and the Table 1 Distribution of steatosis by sex.
Ptcients
Women
Men
Total
Number
n
234
131
365 %
64.1
35.9
100
n
149
76
225 %
63.7
58.0
61.7
n
49
32
81 %
20.9
24.4
22.2
n
28
17
45 %
12.0
13.0
12.3
n
8
6
14 %
3.4
4.6
3.8 Steatosis-free Steatosis 1 Seatosis 2 Steatosis 3
Table 2 Distribution according age range of subcutaneous and visceral fat among steatosis-free women.
Steatosis-free women
Up to 29 years (28 patients): mean = 23.8 years
30 to 69 years (97 patients): mean = 50.2 years
≥ 70 years (24 patients): mean = 77.1 years
p*
Subcutaneous fat (cm)
2.36 ± 2.32
2.63 ± 1.90
2.21 ± 1.44
0.106
Visceral fat (cm)
4.75 ± 2.16
5.38 ± 2.60
6.08 ± 3.20
0.002
* Variance analysis (ANOVA), post-hoc comparison – Tukey’s test.
Table 3 Distribution of subcutaneous and visceral fat according grade of steatosis among women.
Female individuals
Steatosis 1 (49 patients): mean = 59.2 years
Steatosis 2 (28 patients): mean = 57 years
Steatosis 3 (8 patients): mean = 63 years
p*
Subcutaneous fat (cm)
3.08 ± 1.86
3.46 ± 2.14
2.38 ± 1.48
0.019
Visceral fat (cm)
8.31 ± 3.16
10.04 ± 1.14
13.13 ± 4.34
< 0.001
* Variance analysis (ANOVA), post-hoc comparison – Tukey’s test.
Table 4 Distribution according age range of subcutaneous and visceral fat in steatosis-free men.
Steatosis-free men
Up to 29 years (12 patients): mean = 22.9 years
30 to 69 years (45 patients): mean = 49.6 years
≥ 70 years (19 patients): mean = 78.1 years
p*
Subcutaneous fat (cm)
2.17 ± 2.06
2.18 ± 1.16
2.05 ± 1.40
0.800
Visceral fat (cm)
6.00 ± 2.08
7.04 ± 2.72
6.63 ± 2.52
< 0.045
* Variance analysis (ANOVA), post-hoc comparison – Tukey’s test.
Table 5 Distribution of subcutaneous and visceral fat according grade of steatosis in men.
Male individuals
Steatosis 1 (32 patients): mean = 56.7 years
Steatosis 2 (17 patients): mean = 49.0 years
Steatosis 3 (6 patients): mean = 54.1 years
p*
Subcutaneous fat (cm)
2.19 ± 1.38
2.29 ± 2.10
2.50 ± 3.28
0.741
Visceral fat (cm)
8.72 ± 2.70
11.24 ± 1.80
14.00 ± 3.10
< 0.001
* Variance analysis (ANOVA), post-hoc comparison – Tukey’s test. thickness variation among age groups,
such variation was not considered as clini-cally relevant.
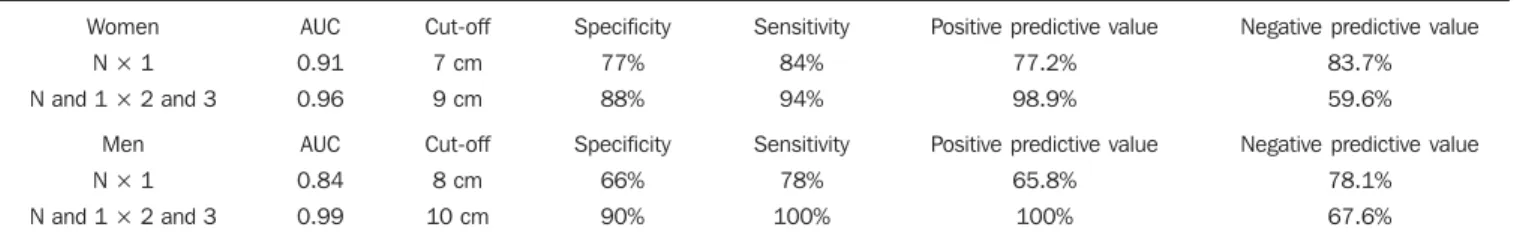
analysis regarding visceral fat thickness was based on the area under the ROC curve to define: a) cut-off value among steatosis-free individuals and individuals with mild steatosis (S1); b) an optimum cut-off value among individuals at no risk and individu-als at risk for steatohepatitis. For this pur-pose, the authors have opted for utilizing the group of steatosis-free and S1 individu-als as a reference against which to appraise the group including individuals with mod-erate (S2) and severe (S3) steatosis, accord-ing to the study developed by Shannon et al.(15), which has demonstrated that 92% of patients with S2 and S3 at US presented moderate to severe steatosis at biopsy; and that most steatosis-free patients or patients with S1 at US did not present any steatosis or presented only mild steatosis at biopsy. The results are shown on Table 6.
DISCUSSION
Considering that the prevalence of both MS(3) and NAFLD(27) is around 20% to 25% in the general population, and that, in patients with NAFLD selected for liver bi-opsy (criterion: steatosis at US and TGP/ TGO serum levels > 1.5 above the normal level in more than two occasions at a one-month interval), steatohepatitis without fi-brosis may affect 31.1% of the individuals, and steatohepatitis with fibrosis may reach 27% of cases(28), the authors have tried to establish a noninvasive, low-cost method to aid in the identification of patients at higher risk for presenting the progressive forms of such diseases.
With basis on the US accuracy to detect steatosis(10,11), one should consider the pos-sibility of utilizing such imaging method as an initial tool in the screening for NAFLD even in the presence of normal levels of hepatic enzymes(15). On the other hand, considering the relationship between
ste-atosis and visceral fat thickness(13,25), the author has tried to define values for ab-dominal fatty tissue thickness that could differentiate normality from mild steatosis and suspicion of steatohepatitis(14). It has already been demonstrated that the accu-mulation of visceral fat is related to the development of steatohepatitis, and that such accumulation continuously influences histological alteration in NAFLD from early in the process of fat deposition in hepatocytes to the onset of inflammatory alterations(29). One of the advantages of measuring the visceral fat thickness is the simplicity and objectiveness of the method, allowing the avoidance of subjective vari-ables in the quantification of steatosis that is very operator dependent. Both steatosis and abdominal visceral fat are correlated independently of cardiometabolic risk, but the associations are stronger for visceral fat than for steatosis(30).
In the 365 patients included in the present study, no statistically significant difference was observed in subcutaneous fat thickness between male and female individuals, age groups and in relation to the presence or not of steatosis. On the other hand, visceral fat thickness did not present any statistically significant difference between age groups in steatosis-free men, but, among women, it did present a significant increase between young (< 29 years) and adult women, and between adult and elderly women (> 70 years). However, among patients with ste-atosis, visceral fat thickening presented sig-nificant increase, proportional to the grade of steatosis, both in men and women.
Based on the ROC curve analysis, the following cut-off values were obtained:
1. For women, visceral fat thickness
≥ 7 cm suggests the presence of mild ste-atosis; and ≥ 9 cm suggests moderate to se-vere steatosis with risk for steatohepatitis and metabolic syndrome.
2. For men, visceral fat thickness ≥ 8 cm suggests the presence of mild steatosis; and
≥ 10 cm, suggests moderate to severe ste-atosis with risk for steatohepatitis and metabolic syndrome.
The risk for steatohepatitis with visceral fat thickness > 9 cm for women and > 10 cm for men raises the possibility of indica-tion for liver biopsy.
Such values practically superimpose themselves on those reported by Leite et al.(23), who have studied 422 patients, in-vestigating the correlation between visceral fat thickness and cardiovascular risk. Such study has indicated a cut-off value of 7 cm to predict a moderate cardiovascular risk for both female and male individuals, while the present study has found a cut-off value of 7 cm for women and 8 cm for men to indicate the presence of mild steatosis. The study developed by Leite et al.(23) has also defined cut-off values of 8 cm for women and 9 cm for men to predict high cardiovas-cular risk. The present study has established cut-off values of 9 cm for women and 10 cm for men to predict high risk for steato-hepatitis.
Ribeiro Filho et al.(24), who have also developed an exemplary study correlating visceral fat thickness with metabolic syn-drome components, have assessed 100 fe-male patients, defining 7 cm as cut-off value above which the patients present car-diovascular risk.
As regards the study developed by Diniz et al.(25) intended principally to evaluate the interobserver variability of the sonographic method, the fact of not having differenti-ated men and women as well as grades of steatosis puts their values obtained for vis-ceral fat thickness (6.84 cm ± 2.38) within the spectrum of the present study.
Previous studies approaching the evaluation of visceral fat by US are practi-cally concentrated on validating US as
Table 6 Cut-off values for mild steatosis and moderate to severe steatosis by the ROC curve analysis.
Women
N × 1
N and 1 × 2 and 3
Men
N × 1
N and 1 × 2 and 3
AUC
0.91
0.96
AUC
0.84
0.99
Cut-off
7 cm
9 cm
Cut-off
8 cm
10 cm
Specificity
77%
88%
Specificity
66%
90%
Sensitivity
84%
94%
Sensitivity
78%
100%
Positive predictive value
77.2%
98.9%
Positive predictive value
65.8%
100%
Negative predictive value
83.7%
59.6%
Negative predictive value
78.1%
67.6%
compared with CT, MRI and anthropom-etry. Armellini et al.(20), for example, is the first reference for all studies involving vis-ceral fat and US, and even utilized three different parameters to measure visceral fat from the linea alba: the splenic vein, the an-terior aortic wall and the posan-terior aortic wall. Currently, the posterior aortic wall is utilized because it is believed that intra-ab-dominal thickness values based on such parameter are more representative of the visceral fat amount.
The measurement of subcutaneous fat thickness did not demonstrate to be statis-tically relevant neither in men nor in women. It may be utilized as treatment fol-low-up in individual cases. In spite of the apparent disparity between the increase in visceral fat and increase in subcutaneous fat with the progression of obesity, the proposition of an index to measure the vis-ceral fat/subcutaneous fat ratio has not found statistical relevance.
The limitation of the present study is re-lated to the lack of correlation with serum parameters and with histological analysis.
CONCLUSION
The present study demonstrated the cor-relation between steatosis and measure-ment of visceral fat thickness in 365 pa-tients, suggesting the preference for the latter in the evaluation of NAFLD, not only because of its objectiveness and reproduc-ibility, but also because it allows the defi-nition of differentiated quantitative criteria for men and women, as well as for differ-ent age groups. Additionally, it allows a more accurate treatment follow-up.
As regards visceral fat, values were sug-gested for normality and risk for steato-hepatitis for both male and female indi-viduals.
Furthermore, it is suggested that the measurement of visceral fat thickness is in-cluded in the routine abdominal ultra-sonography studies, considering the prac-ticality and efficaciousness of this method
as a predictor of steatohepatitis and meta-bolic syndrome.
REFERENCES
1. Ogden CL, Carroll MD, Curtin LR, et al. Preva-lence of overweight and obesity in the United States, 1999-2004. JAMA. 2006;295:1549–55. 2. Reaven GM. Banting lecture 1988. Role of
insu-lin resistance in human disease. Diabetes. 1988; 37:1595–607.
3. Ribeiro Filho FF, Mariosa LS, Ferreira SRG, et al. Gordura visceral e síndrome metabólica: mais que uma simples associação. Arq Bras Endocrinol Metabol. 2006;50:230–8.
4. Isomaa B, Almgren P, Tuomi T, et al. Cardiovas-cular morbidity and mortality associated with the metabolic syndrome. Diabetes Care. 2001;24: 683–9.
5. Farrell GC, Larter CZ. Nonalcoholic fatty liver disease: from steatosis to cirrhosis. Hepatology. 2006;43(2 Suppl 1):S99–112.
6. Ma X, Holalkere NS, Kambadakone RA, et al. Im-aging-based quantification of hepatic fat: meth-ods and clinical applications. Radiographics. 2009;29:1253–77.
7. Schwenzer NF, Springer F, Schraml C, et al. Non-invasive assessment and quantification of liver steatosis by ultrasound, computed tomography and magnetic resonance. J Hepatol. 2009;51:433– 45.
8. Joy D, Thava VR, Scott BB. Diagnosis of fatty liver disease: is biopsy necessary? Eur J Gastroen-terol Hepatol. 2003;15:539–43.
9. Saadeh S, Younossi ZM, Remer EM, et al. The utility of radiological imaging in nonalcoholic fatty liver disease. Gastroenterology. 2002;123: 745–50.
10. Joseph AE, Saverymuttu SH, al-Sam S, et al. Comparison of liver histology with ultrasonogra-phy in assessing diffuse parenchymal liver dis-ease. Clin Radiol. 1991;43:26–31.
11. Andrade JO, Andrade MHF, Andrade GF, et al. Quantification of liver echogenicity for ultra-sonographic classification of nonalcoholic fatty liver disease. GED Gastroenterol Endosc Dig. 2006;25:159–64.
12. Dasarathy S, Dasarathy J, Khiyami A, et al. Va-lidity of real time ultrasound in the diagnosis of hepatic steatosis: a prospective study. J Hepatol. 2009;51:1061–7.
13. Hamaguchi M, Kojima T, Itoh Y, et al. The sever-ity of ultrasonographic findings in nonalcoholic fatty liver disease reflects the metabolic syndrome and visceral fat accumulation. Am J Gastroenterol. 2007;102:2708–15.
14. El-Koofy N, El-Karaksy H, El-Akel W, et al. Ul-trasonography as a non-invasive tool for detection of nonalcoholic fatty liver disease in overweight/ obese Egyptian children. Eur J Radiol. 2012;81: 3120–3.
15. Shannon A, Alkhouri N, Carter-Kent C, et al.
Ultrasonographic quantitative estimation of he-patic steatosis in children with NAFLD. J Pediatr Gastroenterol Nutr. 2011;53:190–5.
16. Yoshizumi T, Nakamura T, Yamane M, et al. Ab-dominal fat: standardized technique for measure-ment at CT. Radiology. 1999;211:283–6. 17. Wajchenberg BL. Subcutaneous and visceral
adi-pose tissue: their relation to the metabolic syn-drome. Endocr Rev. 2000;21:697–738.
18. van der Kooy K, Seidell JC. Techniques for the measurement of visceral fat: a practical guide. Int J Obes Relat Metab Disord. 1993;17:187–96. 19. Vasques ACJ, Priore SE, Rosado LEFPdL, et al.
Utilização de medidas antropométricas para a avaliação do acúmulo de gordura visceral. Revista de Nutrição. 2010;23:107–18.
20. Armellini F, Zamboni M, Robbi R, et al. Total and intra-abdominal fat measurements by ultrasound and computerized tomography. Int J Obes Relat Metab Disord. 1993;17:209–14.
21. Radominski RB, Vezozzo DP, Cerri GG, et al. O uso da ultra-sonografia na avaliação da distribui-ção de gordura abdominal. Arq Bras Endocrinol Metabol. 2000;44:5–12.
22. Hirooka M, Kumagi T, Kurose K, et al. A tech-nique for the measurement of visceral fat by ul-trasonography: comparison of measurements by ultrasonography and computed tomography. In-tern Med. 2005;44:794–9.
23. Leite CC, Wajchenberg BL, Radominski R, et al. Intra-abdominal thickness by ultrasonography to predict risk factors for cardiovascular disease and its correlation with anthropometric measure-ments. Metabolism. 2002;51:1034–40.
24. Ribeiro-Filho FF, Faria AN, Azjen S, et al. Meth-ods of estimation of visceral fat: advantages of ul-trasonography. Obes Res. 2003;11:1488–94. 25. Diniz ALD, Tomé RAF, Debs CL, et al.
Avalia-ção da reprodutibilidade ultrassonográfica como método para medida da gordura abdominal e vis-ceral. Radiol Bras. 2009;42:353–7.
26. Yoshimitsu K, Honda H, Kuroiwa T, et al. Un-usual hemodynamics and pseudolesions of the noncirrhotic liver at CT. Radiographics. 2001;21 Spec No:S81–96.
27. Ong JP, Younossi ZM. Epidemiology and natural history of NAFLD and NASH. Clin Liver Dis. 2007;11:1–16, vii.
28. Cotrim HP, Parise ER, Oliveira CP, et al. Nonal-coholic fatty liver disease in Brazil. Clinical and histological profile. Ann Hepatol. 2011;10:33–7.
29. Eguchi Y, Mizuta T, Sumida Y, et al. The patho-logical role of visceral fat accumulation in steato-sis, inflammation, and progression of nonalco-holic fatty liver disease. J Gastroenterol. 2011;46 Suppl 1:70–8.