Received June 14, 2010 and accepted April 4, 2011. Corresponding author: [email protected]
Carcass quality of crossbred steers with different degrees of zebu blood in
the genotype: meta-analysis
Tiago Venturini
1, Luís Fernando Glasenapp de Menezes
1, Fernando Kuss
1, Thomas Newton
Martin
1, Douglas Vonz
1, Wagner Paris
11 Universidade Tecnológica Federal do Paraná – Campus Dois Vizinhos.
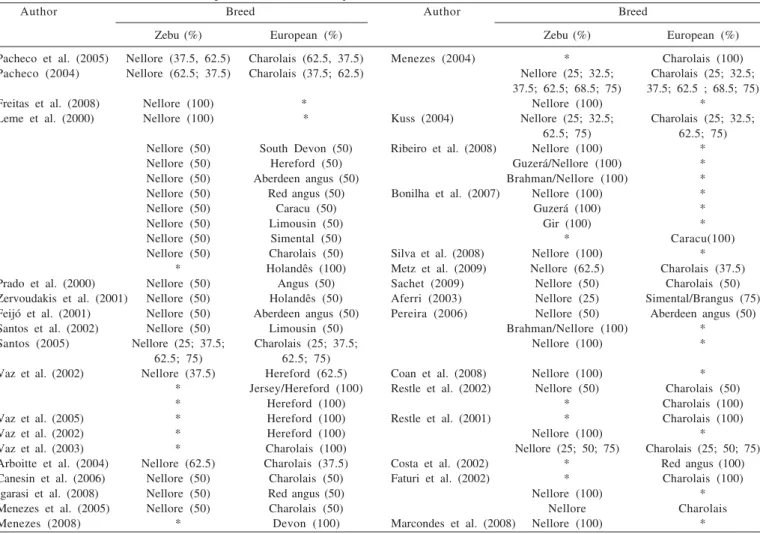
ABSTRACT -In order to evaluate the effect of the different percentages of zebu blood in the genotype of crossbred steers on carcass traits, a meta-analysis was carried out, using 30 studies conducted in Brazil that have been published since the year 2000. The parameters evaluated were hot carcass weight (221 estimates), cold carcass weight (232), hot carcass (236) and cold carcass yield (223), subcutaneous fat thickness (238) and the percentages of saw cut (233), forequarter (234) and sidecut (246 estimates). Initially, exploratory analysis was performed for each of the variables for detection of publication vices through the dispersion of observations by pointing out the outliers eliminated. Normality tests were normal and the data were subjected to analysis of variance for the regression study, which were assessed to the third degree. Weights of hot carcass and cold carcass, hot and cold carcass yield and the percentage of saw cut had a quadratic effect on animals with the presence of zebu blood, indicating superiority of crossbred animals. The regression equation showed that 66; 50; 72; 81 and 59% of zebu in crossbred animals showed higher hot and cold carcass weight, hot and cold carcass percentage and saw cut, respectively. Fat thickness was not influenced by the degree of zebu in the genotype. The percentage of forequarter has a positive response by increasing the degree of zebu in the genotype, while the sidecut has a negative answer. The crossbreeding between zebu and European breeds provides carcasses with better quality than purebred animals.
Key Words: carcass yield, crossbreeding, heterosis
www.sbz.org.br
Introduction
With the increase in the production and the amount of
beef produced and exported, the production chain of this
segment in Brazil has stood out internationally. A major
concern in the country for the consumer market is the
compliance with the requirements and needs in relation to
the quantity and quality of the final product; in other words,
the carcass and meat produced (Pacheco et al., 2005),
keeping the basic conditions required, which are hygienic
and sanitary safeness, nutritional value, produce traceability
and sensory characteristics (Pineda & Rocha, 2002).
The crossbreeding between European and Zebu breeds
is one of the practices used to increase animal performance,
widely used in countries with emphasis on beef production,
like the United States of America, New Zealand, Canada and
Australia, reaching levels above 80% of application on
herds (Sundstrom et al., 1994).
The use of European breeds (
Bos taurus taurus
) in
crossbreeding helps to improve the quality of carcass and
meat, besides reducing the age at slaughter. Since the
genotype zebu (
Bos taurus indicus
) collaborates with its
rusticity and adaptation to tropical climates, due to its
greater resistance to pests and tolerance to heat, allied to
these factors, the crossbreeding provides greater heterosis
(Menezes et al., 2005).
In the study of carcass production quality, several
factors of commercial interest such as improving the yield
of the carcass and commercial cuts, the weight of the cut
and the degree of final touch are taken into account by the
slaughterhouses (Costa et al. 2002; Arboitte et al., 2004).
The literature has several studies related to carcass quality
and beef and they often report conflicting results. Thus, this
study aims to evaluate the variations found in experimental
research and conduct a scientific systematization of
information to obtain more precise information to support
producers in the definition of which degree of participation
of zebu in the genotype provides greater income to the
producers, as well as to assess the possibility of the beef
industry’s being more profitable and pay a fairer price for
the product.
Material and Methods
The study was conducted at the Universidade
Tecnológica Federal do Paraná - Campus Dois Vizinhos
(UTFPR-DV). Twenty-two articles published on the Revista
Brasileira de Zootecnia (Leme et al., 2000, Prado et al. 2000;
Feijó et al. 2001; Restle et al. 2001; Zervoudakis et al., 2001;
Costa et al. , 2002; Faturi et al., 2002; Santos et al., 2002; Vaz
et al., 2002; Vaz & Restle, 2003; Arboitte et al., 2004;
Menezes et al., 2005, Pacheco et al., 2005 ; Vaz & Restle,
2005; Canesin et al., 2006; Bonilha et al., 2007; Coan et al.,
2008; Freitas et al., 2008; Igarasi et al., 2008; Marcondes et al.,
2008; Ribeiro et al., 2008; Silva et al., 2008; Metz et al., 2009)
six dissertations (Aferri, 2003; Kuss, 2004; Menezes, 2004;
Pacheco, 2004; Sachet, 2009; Santos, 2005) and two theses
(Pereira, 2006; Menezes, 2008) in Animal Science at
Universidade Federal de Santa Maria (UFSM) and
Universidade de São Paulo (USP) from 2000 to 2009 were
used (Table 1) .
From the articles published in the journals, the average
data were extracted, and in dissertations, individual results
were published in the appendices. The survey included
characteristics that affect carcass quality, and was performed
using as keywords: carcass, cattle, calves and degree of
blood. One-hundred and eight articles related to the
characteristics sought were found and, after accurate
analysis, 30 articles were selected for meta-analysis having
as criteria the use of bulls aged 24 months, purebred or
crossbred.
The main variables analyzed were: hot carcass weight
(221 estimates extracted), cold carcass weight (232), hot
carcass yield (236) and cold carcass (223), fat thickness (238),
percentage of saw cut (233), percentage for forequarter (234)
and percentage of sidecut (246 animals evaluated).
The values mentioned in the selected studies were
related to the interference of the percentage of zebu blood
of animals evaluated. The animals used in experiments were
divided into nine categories according to their genotypes:
0, 25, 31.25, 37.5, 50, 58.75, 62.5, 75 and 100% of zebu
blood in the genotype. The database was developed in a
Microsoft Excel
®spreadsheet from the values discussed in
the publications. The meta-analysis of the variables followed
the following steps: exploratory analysis of the data set,
which aims to detect the presence of addiction to publication,
Author Breed Author Breed
Zebu (%) European (%) Zebu (%) European (%)
Pacheco et al. (2005) Nellore (37.5, 62.5) Charolais (62.5, 37.5) Menezes (2004) * Charolais (100) Pacheco (2004) Nellore (62.5; 37.5) Charolais (37.5; 62.5) Nellore (25; 32.5; Charolais (25; 32.5;
37.5; 62.5; 68.5; 75) 37.5; 62.5 ; 68.5; 75)
Freitas et al. (2008) Nellore (100) * Nellore (100) *
Leme et al. (2000) Nellore (100) * Kuss (2004) Nellore (25; 32.5; Charolais (25; 32.5;
62.5; 75) 62.5; 75)
Nellore (50) South Devon (50) Ribeiro et al. (2008) Nellore (100) *
Nellore (50) Hereford (50) Guzerá/Nellore (100) *
Nellore (50) Aberdeen angus (50) Brahman/Nellore (100) *
Nellore (50) Red angus (50) Bonilha et al. (2007) Nellore (100) *
Nellore (50) Caracu (50) Guzerá (100) *
Nellore (50) Limousin (50) Gir (100) *
Nellore (50) Simental (50) * Caracu(100)
Nellore (50) Charolais (50) Silva et al. (2008) Nellore (100) *
* Holandês (100) Metz et al. (2009) Nellore (62.5) Charolais (37.5)
Prado et al. (2000) Nellore (50) Angus (50) Sachet (2009) Nellore (50) Charolais (50)
Zervoudakis et al. (2001) Nellore (50) Holandês (50) Aferri (2003) Nellore (25) Simental/Brangus (75) Feijó et al. (2001) Nellore (50) Aberdeen angus (50) Pereira (2006) Nellore (50) Aberdeen angus (50)
Santos et al. (2002) Nellore (50) Limousin (50) Brahman/Nellore (100) *
Santos (2005) Nellore (25; 37.5; Charolais (25; 37.5; Nellore (100) *
62.5; 75) 62.5; 75)
Vaz et al. (2002) Nellore (37.5) Hereford (62.5) Coan et al. (2008) Nellore (100) *
* Jersey/Hereford (100) Restle et al. (2002) Nellore (50) Charolais (50)
* Hereford (100) * Charolais (100)
Vaz et al. (2005) * Hereford (100) Restle et al. (2001) * Charolais (100)
Vaz et al. (2002) * Hereford (100) Nellore (100) *
Vaz et al. (2003) * Charolais (100) Nellore (25; 50; 75) Charolais (25; 50; 75)
Arboitte et al. (2004) Nellore (62.5) Charolais (37.5) Costa et al. (2002) * Red angus (100)
Canesin et al. (2006) Nellore (50) Charolais (50) Faturi et al. (2002) * Charolais (100)
Igarasi et al. (2008) Nellore (50) Red angus (50) Nellore (100) *
Menezes et al. (2005) Nellore (50) Charolais (50) Nellore Charolais
Menezes (2008) * Devon (100) Marcondes et al. (2008) Nellore (100) *
in other words, the presence of disparate data (outliers) for
a certain trait in the studies. Outliers were determined with the
help of TC2D software, which pointed the data with values
of twice the standard deviation, allowing the elimination of
values over this limit . The tests of normality applied to the
variables were: Kolmogorov-Smirnov, Cramer-von Mises,
Anderson-Darling, Kuiper, Watson, Lilliefors and
Shapiro-Wilk test, using the software Assistat (Silva & Azevedo, 2002).
The data were subjected to analysis of variance and the
estimation of regression equations to the third grade was
achieved through the statistical software SAS (2001).
Results and Discussion
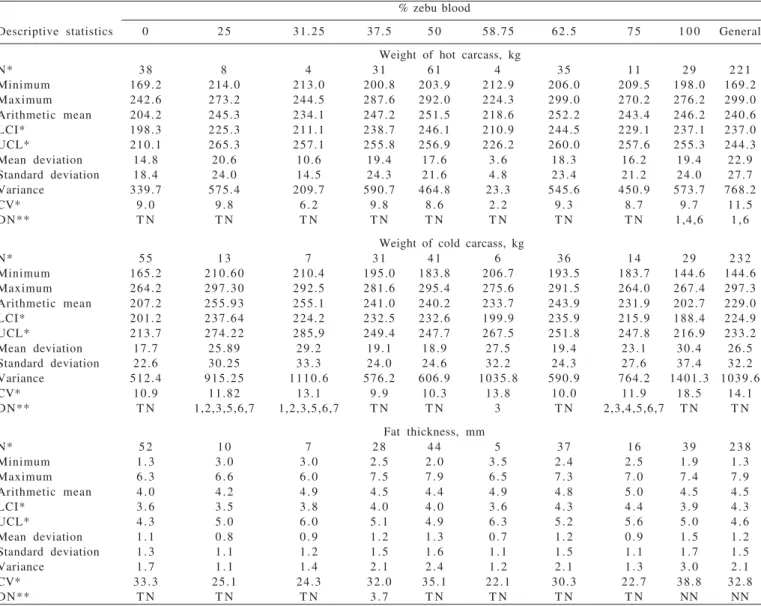
Only purebred animals did not reach the average cold
carcass weight of 230 kg (Table 2), minimum sought by the
beef industry to reduce the costs of production (Costa et al.,
2002). In all degrees of blood, there were animals that showed
carcasses with weights inferior to 230 kg. Carcasses with
less weight (over 180 kg) are being gradually accepted by
butchers and supermarkets, because the animals are associated
with lower age and better meat quality (Costa et al., 2002).
In spite of the use of meta-analysis, which could lead
to high variability of the data, the coefficient of variation
(CV = 11.5%) for hot carcass weight was similar to that
found in the literature: Zervoudakis et al. (2001), 8.9%;
Canesin et al. (2006), 7.74%; Marcondes et al. (2008), 11.63%.
On the other hand, the coefficient of variation for the cold
carcass weight (14.1%) was higher than that observed in the
literature: Kuss et al. (2005), 8.83%; Canesin et al. (2006),
7.96%; Silva et al. (2008), 6.63%. The cold carcass weight is
influenced by other factors that are not inherent by the
% zebu blood
Descriptive statistics 0 2 5 31.25 37.5 5 0 58.75 62.5 7 5 1 0 0 General
Weight of hot carcass, kg
N* 3 8 8 4 3 1 6 1 4 3 5 1 1 2 9 2 2 1
Minimum 169.2 214.0 213.0 200.8 203.9 212.9 206.0 209.5 198.0 169.2
Maximum 242.6 273.2 244.5 287.6 292.0 224.3 299.0 270.2 276.2 299.0
Arithmetic mean 204.2 245.3 234.1 247.2 251.5 218.6 252.2 243.4 246.2 240.6
LCI* 198.3 225.3 211.1 238.7 246.1 210.9 244.5 229.1 237.1 237.0
UCL* 210.1 265.3 257.1 255.8 256.9 226.2 260.0 257.6 255.3 244.3
Mean deviation 14.8 20.6 10.6 19.4 17.6 3 . 6 18.3 16.2 19.4 22.9
Standard deviation 18.4 24.0 14.5 24.3 21.6 4 . 8 23.4 21.2 24.0 27.7
Variance 339.7 575.4 209.7 590.7 464.8 23.3 545.6 450.9 573.7 768.2
CV* 9 . 0 9 . 8 6 . 2 9 . 8 8 . 6 2 . 2 9 . 3 8 . 7 9 . 7 11.5
DN** T N T N T N T N T N T N T N T N 1,4,6 1 , 6
Weight of cold carcass, kg
N* 5 5 1 3 7 3 1 4 1 6 3 6 1 4 2 9 2 3 2
Minimum 165.2 210.60 210.4 195.0 183.8 206.7 193.5 183.7 144.6 144.6
Maximum 264.2 297.30 292.5 281.6 295.4 275.6 291.5 264.0 267.4 297.3
Arithmetic mean 207.2 255.93 255.1 241.0 240.2 233.7 243.9 231.9 202.7 229.0
LCI* 201.2 237.64 224.2 232.5 232.6 199.9 235.9 215.9 188.4 224.9
UCL* 213.7 274.22 285,9 249.4 247.7 267.5 251.8 247.8 216.9 233.2
Mean deviation 17.7 25.89 29.2 19.1 18.9 27.5 19.4 23.1 30.4 26.5
Standard deviation 22.6 30.25 33.3 24.0 24.6 32.2 24.3 27.6 37.4 32.2
Variance 512.4 915.25 1110.6 576.2 606.9 1035.8 590.9 764.2 1401.3 1039.6
CV* 10.9 11.82 13.1 9 . 9 10.3 13.8 10.0 11.9 18.5 14.1
DN** T N 1,2,3,5,6,7 1,2,3,5,6,7 T N T N 3 T N 2,3,4,5,6,7 T N T N
Fat thickness, mm
N* 5 2 1 0 7 2 8 4 4 5 3 7 1 6 3 9 2 3 8
Minimum 1 . 3 3 . 0 3 . 0 2 . 5 2 . 0 3 . 5 2 . 4 2 . 5 1 . 9 1 . 3
Maximum 6 . 3 6 . 6 6 . 0 7 . 5 7 . 9 6 . 5 7 . 3 7 . 0 7 . 4 7 . 9
Arithmetic mean 4 . 0 4 . 2 4 . 9 4 . 5 4 . 4 4 . 9 4 . 8 5 . 0 4 . 5 4 . 5
LCI* 3 . 6 3 . 5 3 . 8 4 . 0 4 . 0 3 . 6 4 . 3 4 . 4 3 . 9 4 . 3
UCL* 4 . 3 5 . 0 6 . 0 5 . 1 4 . 9 6 . 3 5 . 2 5 . 6 5 . 0 4 . 6
Mean deviation 1 . 1 0 . 8 0 . 9 1 . 2 1 . 3 0 . 7 1 . 2 0 . 9 1 . 5 1 . 2
Standard deviation 1 . 3 1 . 1 1 . 2 1 . 5 1 . 6 1 . 1 1 . 5 1 . 1 1 . 7 1 . 5
Variance 1 . 7 1 . 1 1 . 4 2 . 1 2 . 4 1 . 2 2 . 1 1 . 3 3 . 0 2 . 1
CV* 33.3 25.1 24.3 32.0 35.1 22.1 30.3 22.7 38.8 32.8
DN** T N T N T N 3 . 7 T N T N T N T N NN NN
* N = number of observation; LCI = lower confidence limits; UCL = upper confidence limits; CV = coefficient of variation; DN = adherence data.
** The values follow a normal distribution for the Kolmogorov-Smirnov (1), Cramer-von Mises (2), Anderson-Darling (3), Kuiper (4), Watson (5), Lilliefors (6), Shapiro-Wilk (7), show normal distribution for all tests (TN) and do not present normal distribution for any test (NN).
animal; for instance, the temperature in the cold may increase
or decrease the carcass yield during the cooling, which
could not be measured in the meta-analysis.
The loss by chilling reflects the decrease of the carcass
weight during the cooling process in the first 24 hours after
slaughter (Menezes et al., 2005). Moreover, studies show
that chilling loss is influenced by the thickness of
subcutaneous fat (Muller, 1987; Arboitte et al., 2004).
According to Muller (1987), lower rates of breakdown are
observed in carcasses with higher degree of subcutaneous
fat, since it acts as an insulator, preventing losses from
dehydration. The subcutaneous fat thickness (FT) presented
high variability (32.80% average CV), which may have
contributed to the increase in the coefficient of variation of
the cold carcass weight. The high variability for this
characteristic is reported in the literature: Canesin et al.
(2006), 44.84%; Silva et al. (2008), 52.92%; Igarasi et al.
(2008), 22.98%. Lopes et al. (2008) conducted a meta-analysis
for carcass traits of cattle from different genetic groups and
found that the contribution of the degree of zebu blood on
the thickness of fat was only positive when the crossbreeding
was carried out with European continental origin ones,
while when done between zebu and British, the presence of
zebu genotype decreased the degree of finishing on the
carcass. As in this analysis there was no such distinction
between the origins of European breeds involved in the
crossbreeds, the data variation for fat thickness was high.
The fat thickness was not influenced by the presence
of zebu blood in the genotype of animals. The high variability
(CV = 32.80%) data contributed to that outcome. Furthermore,
the thickness of fat is one of the main criteria at the moment
of slaughter, since, along with the carcass weight, is one of
the requirements of beef industry. Slaughterhouses require
3 to 6 mm of fat thickness (Costa et al., 2002). In the studies
evaluated, fat thickness ranged from 1.33 to 7.90 mm. The
high variation in all genotypes and degree of finish was
more influenced by the procedures of researchers than by
the genotype involved.
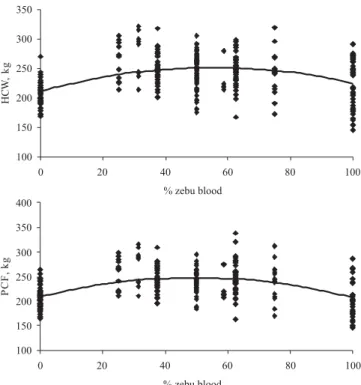
The weights of hot and cold carcass were influenced in
a quadratic pattern (Figure 1) by the degree of Zebu blood
(HCW = 205.36 + 1.429 * -0.0108 * zebu2 zebu, PCF = 213.58
+ 1.384 * zebu - zebu2 0.014 *), since the highest values were
obtained from crossbred animals (66 and 50% of zebu blood,
respectively).
The hot carcass weight of the animals showed differences
of up to 47 kg between pure European and crossbred
animals (66% of zebu blood) and this difference may have
been favored by the increase in carcass weight caused by
heterosis provided at the junction between European and
zebu breeds (Menezes et al., 2005). Koger et al. (1975)
were the first to demonstrate linearity between heterosis
and heterozygosis. In this analysis, maximum results for
cold carcass weight were found when the animals had
50% of zebu blood. Animals of ½ blood showed 100%
heterozygosis and are expected to have maximum heterosis.
In this analysis, the maximum results for cold carcass
weight were observed when the animals had 50% of zebu
blood. Restle et al. (1999), working with different degrees of
blood Hereford × Nellore, and Menezes et al. (2005), with
crossbreeding between Charolais and Nellore, verified that
the maximum carcass weight occurs with 41 and 42% of
European blood in the genotype, respectively.
As it happened with the weights of carcass, the data
variation of hot carcass yield (CV = 3.7%) and cold (CV =
4.3%, Table 3) was close to that found in the literature
(Canesin et al., 2006, CV = 11.43 and 4.53%, Silva et al., 2008:
2.82 and 2.84% for hot and cold carcass yield, respectively).
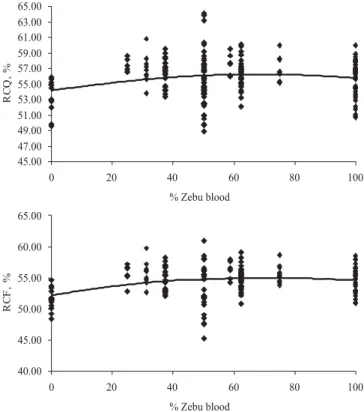
The lowest values for the hot and cold carcass yield
were observed in 100% European animals, both for the
minimum (49.56 and 48.10%) and maximum values (55.87
and 55.20%). The superiority in carcass yield of zebu blood
in animals with genotype can be attributed to the relative
weight of lower legs, head, skin (Menezes et al., 2009) and
especially of the gastrointestinal tract (Menezes et al., 2007),
in addition to thinner skin and more surface area on the
body, which are characteristics of zebu genotypes adapted
to warmer climates.
Regression analysis (Figure 2) indicated a quadratic
effect of the presence of blood in the zebu genotype in
relation to carcass yield. Several studies indicate linearity
of carcass yield in the presence of zebu blood in genotype
(Restle et al., 1999, 2000). On the other hand, Menezes et al.
(2005) observed positive heterosis for hot (3.22%) and cold
(3.45%) carcass yield, indicating that the crossbreds were
higher than purebreds. In that study, the authors remarked
that all crossbred genotypes (Charolais - C and Nellore - N)
studied (3/4ch 1/4N, 3/4N 1/4C, 5/8C 3/8N, 5/8N 3/8C;
11/16C 5/16C 5/16N and 11/16N) had higher carcass yield
than Nellore purebreds.
Arboitte et al. (2004) and Kuss et al. (2005) report that
several researchers found an increasing yield according
to weight at slaughter. In this study there was no
relationship between income and housing of animals
slaughtered (r = - 0.03, P = 0.64). However, carcass yield
was positively correlated with carcass weight (r = 0.34,
P = 0.001).
Carcass yield has become very important to the
production system in recent years, which was based on
body weight and has to be done based on carcass weight.
The carcass yield can be influenced by several aspects,
including dietary fiber content (Ribeiro et al., 2001), animal
category (Vaz et al., 2002), slaughter weight (Kuss et al,
2005) and genetic group (Menezes et al., 2005).
% zebu blood
Descriptive statistics 0 2 5 31.25 37.5 5 0 58.75 62.5 7 5 100 General
Hot carcass yield, %
N* 3 5 9 8 3 2 5 2 6 4 0 1 6 3 8 236
Minimum 49.6 53.1 53.9 52.8 52.1 55.9 52.0 54.8 52.0 49.6
Maxim 55.9 58.6 58.2 59.5 60.0 59.5 60.0 60.0 58.8 60.0
Arithmetic mean 53.5 56.8 56.4 55.9 55.1 57.5 56.0 56.5 56.1 10.4
LCI* 52.9 55.6 55.3 55.3 54.6 56.1 55.4 55.6 55.5 55.3
UCL* 54.1 58.0 57.6 56.5 55.7 59.0 56.6 57.4 56.7 55.8
Mean deviation 1.5 1.0 1.0 1.6 1.7 1.0 1.6 1.3 1.5 1.7
Standard deviation 1.8 1.5 1.3 1.8 2.0 1.4 2.0 1.6 1.8 2.1
Variance 3.3 2.4 1.8 3.4 4.1 1.9 3.9 2.7 3.2 4.3
CV* 3.4 2.7 2.4 3.3 3.7 2.4 3.5 2.9 3.2 3.7
DN** 1,2,4,5,6 4.6 T N 2,3,7 T N T N T N NN 1,3,4,6,7 2,3,5,6,7
Cold carcass yield, %
N* 5 1 1 0 8 3 2 2 8 6 4 0 1 7 3 1 223
Minimum 48.1 51.4 52.8 51.2 50.7 54.3 50.8 51.8 51.0 48.1
Maximum 55.2 57.1 57.2 58.3 58.5 57.9 59.0 58.6 59.0 59.0
Arithmetic mean 51.9 54.8 55.3 54.5 54.1 56.2 54.6 55.1 55.0 54.1
LCI* 51.3 53.3 54.1 53.8 53.2 54.7 54.0 54.2 54.1 53.8
UCL* 52.4 56.3 56.5 55.2 55.0 57.8 55.1 56.0 55.8 54.4
Mean deviation 1.5 1.7 1.1 1.7 2.1 1.1 1.5 1.4 2.0 1.9
Standard deviation 1.9 2.1 1 4 1.9 2.4 1.5 1.9 1.8 2.4 2.3
Variance 3.5 4.4 2.0 3.7 5.6 2.2 3.5 3.3 5.6 5.5
CV*DN** 3.61,2,5,6 3.83,4,6,7 2.6TN 3.53.7 4.4NN 2.6TN 3.4TN 3.3TN 4.3TN 4.32,3,4,5,6
* N = number of observation; LCI = lower confidence limits; UCL = upper confidence limits, CV = coefficient of variation, DN = adherence data.
** The figures follow a normal distribution for the Kolmogorov-Smirnov (1), Cramer-von Mises (2), Anderson-Darling (3), Kuiper (4), Watson (5), Lilliefors (6), Shapiro-Wilk (7), show normal distribution for all tests (TN) and do not present normal distribution for any tests (NN).
Table 3 - Statistics of position and dispersion of hot and cold carcass yield according to the degree of blood in the genotype of zebu bulls
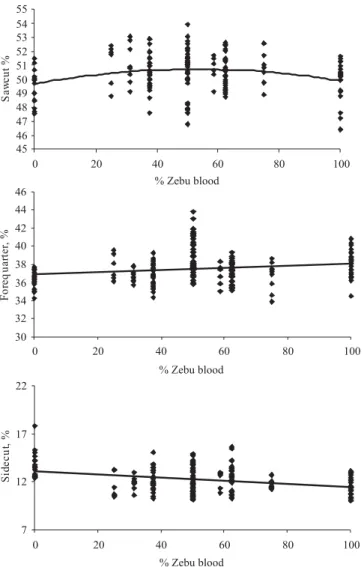
The basic cuts of carcasses of cattle are: forequarter,
sidecut and sawcut. Economically, a higher yield of the
sawcut, compared with other cuts would be desirable,
because of its higher market value. In all genetic groups, the
percentage of sawcut was less than 50% (Table 4).
On average, purebreds (European and zebu) had a
lower percentage in relation to the sawcut of crossbreds, a
fact confirmed by the regression equation, which was
significant and quadratic (Figure 3). According to the
regression equation (TRAS = 49.21994 + 0.04374 * zebu
-zebu ² * 0.0003706), animals with 59% of -zebu blood in the
genotype had a higher percentage of sawcut (50.51%) than
purebreds. In the literature, there are no reports of heterosis
effects on the percentage of sawcut (Faturi et al., 2002;
Vaz et al., 2002; Menezes et al., 2005). The greater presence
of sawcut in the carcass indicates more profit to the meat
packing house, since, by multiplying the carcass weight by
the percentage of the sawcut, there is increased production
in kg of this cut in crossbred animals. The percentage for
forequarter was positively influenced by increasing the
degree of zebu blood in the genotype (Figure 3). This
behavior can be attributed in part to the presence of hump
in zebu animals (Luchiari Filho et al., 1985).
The sidecut percentage showed downward trend as it
increased the share of zebu blood in the genotype. The
sidecut percentage may be associated with the deposition of
fat on this cut (Vaz et al., 2002), characteristic of animals that
reach a high degree of finishing (Table 2) due to the bending
of ribs, associated with selection for increasing food intake.
Zebu breeds present less bending of ribs compared with
European ones. Restle et al. (1999) also observed that the
increase of the proportion of Nellore blood, replacing the
* N = number of observation; LCI = lower confidence limits; UCL = upper confidence limits, CV = coefficient of variation, DN = adherence data.
** The figures follow a normal distribution by Kolmogorov-Smirnov (1), Cramer-von Mises (2), Anderson-Darling (3), Kuiper (4), Watson (5), Lilliefors (6), Shapiro-Wilk (7). NT = normal distribution for all tests, and NN = not present normal distribution for any test.
% zebu blood
Descriptive statistics 0 2 5 31.25 37.5 5 0 58.75 62.5 7 5 100 Overall
Sawcut, %
N* 4 5 1 3 9 3 3 4 5 5 4 0 1 5 2 8 233
Minimum 46.5 48.8 49.1 47.6 46.8 49.1 48.7 48.9 46.4 46.4
Maximum 52.7 53.1 53.1 52.9 53.1 51.7 52.7 52.6 52.0 53.1
Arithmetic mean 49.4 51.2 51.1 50.7 50.1 50.8 50.6 50.8 50.0 50.3
LCI* 48.9 50.5 50.1 50.3 49.7 49.5 50.3 50.2 49.4 50.1
UCL* 49.9 51.9 52.1 51.1 50.6 52.1 51.0 51.4 50.5 50.5
Mean deviation 1.3 1.0 1.1 1.0 1.4 0.8 0.9 1.2 1.2 1.2
Standard deviation 1.6 1.2 1.3 1.2 1.7 1.0 1.1 1.1 1.5 1.5
Variance 2.5 1.4 1.8 1.5 2.8 1.1 1.2 1.3 2.3 2.2
CV*DN** 3.2TN 2.3TN 2.6TN 2.4TN 3.31.6 2.0TN 2.,2TN 2.3TN 3.04,5,6 3.0NN
Forequarter, %
N* 4 6 1 3 9 3 1 5 0 6 4 0 1 4 2 5 234
Minimum 34.3 34.6 357 34.4 34.5 35.0 34.6 34.6 35.6 34.3
Maximum 39.3 39.6 37.8 39.2 40.2 38.3 39.3 38.6 40.4 40.4
Arithmetic mean 36.8 36.5 36.7 36.8 37.8 36.8 37.0 36.9 38.0 37.2
LCI* 36.5 35.6 36.2 36.4 37.5 35,6 36.7 36.1 37.5 37.0
UCL* 37.1 37.5 37.3 37.3 38.2 38.1 37.3 37.6 38.6 37.3
Mean deviation 0.9 1.2 0.6 1.0 1.0 1.0 0.9 1.1 1.1 1.1
Standard deviation 1.2 1.6 0.7 1.2 1.3 1.2 1.1 1.3 1.3 1.3
Variance 1.3 2.5 0.5 1.5 1.7 1.5 1.2 1.7 1.7 1.7
CV* 3.1 4.3 2.0 3.3 3.4 3.3 3.0 3.6 3.5 3.5
DN** T N T N T N T N T N T N T N T N T N T N
Sidecut, %
N* 4 9 1 2 9 3 2 5 7 6 3 8 1 6 2 7 246
Minimum 11.1 10.4 10.6 10.2 10.1 10.8 10.2 10.8 10.0 10.0
Maximum 15.0 14.3 12.9 14.1 14.2 12.9 14.4 14.1 13.0 15.0
Arithmetic mean 12.9 12.3 11.9 12.2 12.1 12.2 12.3 12.0 11.5 12.2
LCI* 12.7 11.4 11.4 11.9 11.8 11.3 12.0 11.5 11.1 12.1
UCL* 13.2 13.1 12.4 12.6 12.4 13.2 12.7 12.5 11.8 12.4
Mean deviation 0.8 1.1 0.4 0.8 1.1 0.8 1.0 0.7 0.7 1.0
Standard deviation 0.9 1.3 0.6 1.0 1.3 0.9 1.2 0.9 0.9 1.1
Variance 0.9 1.7 0.4 1.0 1.6 0.9 1.4 0.8 0.8 1.3
CV* 7.2 10.6 5.4 8.4 10.4 7.6 9.6 7.4 7.6 9.3
DN** T N T N T N T N 1,4,6 3.6 T N 4 T N 1,2,4,6
[Sawcut = 49.21994 + 0.04374 * Zebu - Zebu 0.0003706 *² (r² = 0.4333, P = 0.0003), Forequarter = 36.61898 + 0.01108 * zebu (r² = 0.25691; P = 0.0004); Sidecut = 13.14567 to 0.0144 * zebu (r² = 0.81509, P = 0.001)]
Figure 3 - Relation between the percentage of zebu blood and the percentages of saw cut, forequarter and sidecut in the carcass of steers slaughtered at 24 months.
Hereford, decreased the sidecut percentage linearly. As in
this analysis the thickness of subcutaneous fat was not
influenced by the degree of blood, it is believed that the
second hypothesis is more plausible.
Conclusions
The crossbreeding between European and zebu breeds
results in carcasses of steers with greater weight, higher
yield and higher percentage of saw cut, compared with
purebreds. Zebu steers have higher percentage of
forequarter and lower percentage of sidecut compared with
steers of European breeds.
Acknowledgements
To CNPq, for granting the scholarship to Thomas
Newton Martin and Douglas Vonz, and to MEC - SESU, for
the scholarship to Tiago Venturini and Wagner Paris.
References
AFERRI, G. D e s e m p e n h o e c a r a c t e r í s t i c a s d a c a rc a ç a d e n o v i l h o s a l i m e n t a d o s c o m d i e t a s c o n t e n d o d i f e r e n t e s fontes de gordura. 2003. 43f. Qualidade e Produtividade Animal. Dissertação (Mestrado em Zootecnia) – Faculdade de Zootecnia e Engenharia de Alimentos/Universidade de São Paulo, Pirassununga.
ARBOITTE, M.Z.; RESTLE, J.; ALVES FILHO, D.C. et al. Características da carcaça de novilhos 5/8 Nellore - 3/8 Charolais abatidos em diferentes estádios de desenvolvimento. Revista Brasileira de Zootecnia, v.33, n.4, p.969-977, 2004. BONILHA, S.F.M.; PACKER, I.U.; FIGUEIREDO, L.A. et al.
Efeitos da seleção para peso pós-desmame sobre características de carcaça e rendimento de cortes cárneos comerciais de b o v i n o s . R e v i s t a B r a s i l e i r a d e Z o o t e c n i a, v. 3 6 , n . 5 , p.1275-1281 , 2007.
CANESIN, R.C.; BERCHIELLI, T. T.; ANDRADE, P. et al. Características da carcaça e da carne de novilhos mantidos em pastagem de capim-marandu submetidos a diferentes estratégias de suplementação. Revista Brasileira de Zootecnia, v.35, n.6, p.2368-2375, 2006.
COAN, R.M.; REIS, R.A.; RESENDE, F.D. et al. Viabilidade econômica, desempenho e características de carcaça de garrotes em confinamento alimentados com dietas contendo silagem de capins Tanzânia ou Marandu ou silagem de milho. Revista Brasileira de Zootecnia, v.37, n.2, p.311-318, 2008. COSTA, E.C.; RESTLE, J.; VAZ, F.N. et al. Características da
carcaça de novilhos Red Angus superprecoces abatidos com diferentes pesos. Revista Brasileira de Zootecnia, v.31, n.1, p.119-128, 2002.
FATURI, C.; RESTLE, J.; BRONDANI, I.L. et al. Características da carcaça e da carne de novilhos de diferentes grupos genéticos alimentados em confinamento com diferentes proporções de grão de aveia e grão de sorgo no concentrado. Revista Brasileira de Zootecnia, v.31, n.5, p.2024-2035, 2 0 0 2 .
FEIJÓ, G.L.D.; EUCLIDES FILHO, K.; EUCLIDES, V.P.B. et al. Avaliação das carcaças de novilhos F1 Angus - Nellore em pastagens de Brachiaria decumbens submetidos a diferentes regimes alimentares. Revista Brasileira de Zootecnia, v.30, n.3, p.1015-1020, 2001 (supl. 1).
FREITAS, A.K.; RESTLE, J.; PACHECO P.S. et al. Características de carcaças de bovinos Nellores inteiros vs castrados em duas idades, terminados em confinamento. Revista Brasileira de Zootecnia, v.37, n.6, p.1055-1062, 2008.
HAUPTLI, L.; LOVATTO, P.A.; HAUSCHILD, L. Comparação da adição de extratos vegetais e antimicrobianos sintéticos para leitões na creche através de meta-análise. Ciência Rural, v.37, n.4, p.1084-1090, 2007.
KUSS, F. Características da carcaça e da carne e componentes não-integrantes da carcaça de vacas mestiças abatidas com pesos distintos. 2004. 140f. Dissertação (Mestrado em Zootecnia) – Universidade Federal de Santa Maria, Santa Maria. KUSS, F.; RESTLE, J.; BRONDANI, I.L. et al. Composição física da carcaça e qualidade da carne de vacas de descarte de diferentes grupos genéticos terminadas em confinamento com distintos pesos. Revista Brasileira de Zootecnia, v.34, n.4, p.1285-1296, 2005. LEME, P.R.; BOIN, C.; MARGARIDO, R.C.C. et al. Desempenho em confinamento e características de carcaça de bovinos machos de diferentes cruzamentos abatidos em três faixas de peso. Revista Brasileira de Zootecnia, v.29, n.6, p.2347-2353, 2000 (supl. 2).
LOPES, J.S.; RORATO, P.R.N; WEBER, T. et al. Metanálise para características de carcaça de bovinos de diferentes grupos genéticos. Ciência Rural, v.38, n.8, p.2278-2284, 2008. LUCHIARI FILHO, A.; BOIN, C.; ALLEONI, G.F. et al. Efeito do
tipo de animal no rendimento da porção comestível da carcaça. I. Machos da raça Nellore vs mestiços zebu x europeu terminados a pasto. Boletim da Indústria Animal, v.42, n.2, p.143-148, 1985.
MARCONDES, M.I.; VALADARES FILHO, S.C.; PAULINO, P.V.R. et al. Consumo e desempenho de animais alimentados individualmente ou em grupo e características de carcaça de animais Nellore de três classes sexuais. Revista Brasileira de Zootecnia, v.37, n.12, p.2243-2250, 2008.
MENEZES, L.F.G. Avaliação de novilhos das gerações avançadas do cruzamento rotativo Charolais – Nellore. 2004. 150f. Dissertação (Mestrado em Zootecnia) – Universidade Federal de Santa Maria, Santa Maria.
MENEZES, L.F.G.; RESTLE, J.; BRONDANI, I.L. et al. Características da carcaça de novilhos de gerações avançadas do cruzamento alternado entre as raças Charolais e Nellore, terminados em confinamento. Revista Brasileira de Zootecnia, v.34, n.3, p.934-945, 2005.
MENEZES, L.F.G.; RESTLE, J.; BRONDANI, I.L. et al. Órgãos internos e trato gastrintestinal de novilhos de gerações avançadas do cruzamento rotativo entre as raças Charolais e Nellore terminados em confinamento. Revista Brasileira de Zootecnia, v.36, n.1, p.120-129, 2007.
MENEZES, L.F.G. Avaliação de diferentes sistemas de alimentação sobre as características que afetam a qualidade da carcaça e da carne. 2008. 167f.Tese (Doutorado em Zootecnia) – Universidade Federal de Santa Maria, Santa Maria.
MENEZES, L.F.G.; RESTLE, J.; BRONDANI, I.L. et al. Distribuição de gorduras internas e de descarte e componentes externos do corpo de novilhos de gerações avançadas do cruzamento rotativo entre as raças Charolais e Nellore. Revista Brasileira de Zootecnia, v.38, n.2, p.338-345, 2009.
METZ, P.A.M.; MENEZES, L.F.G.; ARBOITTE, M.Z. et al. Influência do peso ao início da terminação sobre as características de carcaça e da carne de novilhos mestiços Nellore x Charolais. Revista Brasileira de Zootecnia, v.38, n.2, p.346-353, 2009.
MULLER, L. Normas para avaliação de carcaças e concurso de carcaça de novilhos. 2.ed. Santa Maria: Universidade Federal de Santa Maria, 1987. 31p.
PACHECO, P.S. Desempenho, características da carcaça, da carne e do corpo vazio de novilhos jovens e superjovens de diferentes grupos genéticos. 2004. 236f. Dissertação (Mestrado em Zootecnia) – Universidade Federal de Santa Maria, Santa Maria, 2004.
PACHECO, P.S.; SILVA, J.H.S.; RESTLE, J. et al.Características quantitativas da carcaça de novilhos jovens e superjovens de diferentes grupos genéticos. Revista Brasileira de Zootecnia, v.34, n.5, p.1666-1677, 2005.
PEREIRA, A.S.C. Características qualitativas da carcaça e da carne das progênies de touros representativos da raça Nellore (B o s i n d i c u s) e de diferentes grupos genéticos. 2006. 114f. Tese (Doutorado em Zootecnia) – Faculdade de Zootecnia e Engenharia de Alimentos/Universidade de São Paulo, Pirassununga.
PINEDA, N.R.; ROCHA, J.C.M.C. [2002]. Perspectivas do mercado da carne bovina brasileira e estratégias preliminares de marketing. Available at: <http://www.beefpoint.com.br/?noticiaID =5260&actA= 7&areaID=15&secaoID=12. Accessed on: Feb. 18, 2010.
PRADO, I.N.; PINHEIRO, A.D.; ALCALDE, C.R. et al. Níveis de substituição do milho pela polpa de Citrus peletizada sobre o desempenho e características de carcaça de bovinos mestiços confinados. Revista Brasileira de Zootecnia, v.29 n.6, p.2135-2141, 2000 (supl. 1).
RESTLE, J.; VAZ, F.N.; QUADROS, A.R.B. et al. Características de carcaça e da carne de novilhos de diferentes genótipos de Hereford x Nellore. Revista Brasileira de Zootecnia, v.28, n.6, p.1245-1251, 1999.
RESTLE, J.; QUADROS, A.R.B.; VAZ. F.N. Terminação em confinamento de novilhos de diferentes genótipos de Hereford x Nellore. R e v i s t a B r a s i l e i r a d e Z o o t e c n i a, v.29, n.1, p.125-130, 2000.
RESTLE, J.; VAZ, F.N.; ROSO, C. et al. Desempenho e características da carcaça de vacas de diferentes grupos genéticos em pastagem cultivada com suplementação energética. Revista Brasileira de Zootecnia, v.30, n.6, p.1813-1823, 2001. RIBEIRO, E.L.A.; HERNANDEZ, J.A.; ZANELLA, E.L. et al.
Desempenho e características de carcaça de bovinos de diferentes grupos genéticos. Revista Brasileira de Zootecnia,v.37, n.9, p.1669-1673, 2008.
RIBEIRO, T.R.; PEREIRA, J.C.; OLIVEIRA, M.V.M. et al. Características da carcaça de bezerros holandeses para produção de vitelos recebendo dietas com diferentes níveis de concentrado. Revista Brasileira de Zootecnia, v.30, n.6, p.2154-2162, 2001 (supl.).
SACHET, R.H. Reflexo do uso da silagem de milho na forma de suplemento para novilhos terminados em azevém. 2009.89f. Dissertação (Mestrado em Zootecnia) – Universidade Federal de Santa Maria, Santa Maria.
SANTOS, A.P. Desempenho, características da carcaça e da carne de bovinos de diferentes sexos e idades, terminados em confinamento. 2005. 111f. Tese (Doutorado em Zootecnia) – Universidade Federal de Santa Maria, Santa Maria. SANTOS, E.D.G.; PAULINO, M.F.; LANA, R.P. et al. Influência da suplementação com concentrados nas características de carcaça de bovinos F1 Limousin - Nellore, não-castrados, durante a seca, em pastagens de B r a c h i a r i a d e c u m b e n s. Revista Brasileira de Zootecnia, v.31, n.4, p.1823-1832, 2002. SILVA, F.A.S.; AZEVEDO, C.A.V. Versão do programa computacional
Assistat para o sistema operacional Windows. Revista Brasileira de Produtos Agroindustriais, v.4, n.1, p.71-78, 2002.
SILVA, F.V.; ROCHA JÚNIOR, V.R.; BARROS, R.C. et al. Ganho de peso e características de carcaça de bovinos Nellore castrados ou não-castrados terminados em confinamento. Revista Brasileira de Zootecnia, v.37, n.12, p.2199-2205, 2008.
STATISTICAL ANALYSES SYSTEM - SAS. SAS/STAT: user´s guide: statistics. 4.ed. Version 6, Cary: 2001. v.2.
SUNDSTROM, B.; BARLOW, R.; ARTHUR, P.F. Application of crossbreeding to beef production opportunities, obstacles and challenges. In: WORLD CONGRESS ON GENETICS APPLIED TO LIVESTOCK PRODUCTION, 5., 1994, Guelph. Proceedings... Guelph, 1994. n.l. p.148-167.
VAZ, F.N.; RESTLE, J. Ganho de peso antes e após os sete meses no desenvolvimento e nas características de carcaça e carne de novilhos Charolais abatidos aos dois anos. Revista Brasileira de Zootecnia, v.32, n.3, p.699-708, 2003.
VAZ, F.N.; RESTLE, J.; PACHECO, P.S. et al. Características de carcaça e da carne de novilhos superprecoces de três grupos
genéticos, gerados por fêmeas de dois anos. Revista Brasileira de Zootecnia, v.31, n.5, p.1973-1982, 2002.