Article
Printed in Brazil - ©2013 Sociedade Brasileira de Química 0103 - 5053 $6.00+0.00
A
*e-mail: [email protected]
DDT and Derivatives May Target Insulin Pathway Proteins
Diana Montes-Grajales, Jesus Olivero-Verbel* and Maria Cabarcas-Montalvo
Environmental and Computational Chemistry Group, Faculty of Pharmaceutical Sciences, University of Cartagena, Campus of Zaragocilla, Cartagena, Colombia
DDT (1,1,1-tricloro-2 ,2-bis (4-clorofenil) etano) tem sido associado ao diabetes tipo 2. Dessa forma, uma triagem virtual foi realizada para detectar possíveis novos alvos para o DDT e seus derivados na sinalização da insulina. As estruturas dos compostos foram otimizadas por mecânica molecular e posteriormente por teoria do funcional da densidade (DFT), e as estruturas proteicas foram obtidas a partir do banco de dados Protein Data Bank (PDB). O docking entre as 59 proteínas
envolvidas na via de sinalização da insulina, de acordo com o levantamento de dados no PubMed, e as moléculas derivadas do DDT como ligantes foi realizado com o programa AutoDock Vina. As interações resíduo-ligante foram verificadas com o programa LigandScout 2.0. A maior afinidade de ligação foi encontrada para o complexo AKT-1 (PDB_ID: 3cqu)/p,p’-DDE. Outras proteínas com boa afinidade para derivados do DDT foram eIF4E (PDB_ID: 1wkw) e PKA (PDB_ID: 2qcs). Estes dados mostram a plausibilidade teórica de que o DDT e produtos químicos relacionados podem interferir na sinalização envolvendo essas proteínas. Embora os mecanismos bioquímicos ainda sejam incertos, a prevalência de diabetes em indivíduos expostos ao DDT pode ser influenciada pela ligação desses compostos a proteínas envolvidas na via da insulina.
DDT (1,1,1-trichloro-2,2-bis(4-chlorophenyl)ethane) has been linked to type 2 diabetes. Accordingly, a virtual screening was used to detect possible new targets for DDT and its derivatives in the insulin signaling. Compound structures were optimized by molecular mechanics and then by density functional theory (DFT), and protein structures were obtained from Protein Data Bank (PDB). Docking between 59 proteins involved in the insulin pathway according to data mining on PubMed, and DDT-related molecules as ligands, was performed with AutoDock Vina program. Residue-ligand interactions were checked with LigandScout 2.0 software. The greatest binding affinity score was found for the complex AKT-1 (PDB_ID:3cqu)/p,p’-DDE. Other proteins with
good affinities for DDT derivatives were eIF4E (PDB_ID: 1wkw) and PKA (PDB_ID: 2qcs). These data show the theoretical plausibility that DDT and related chemicals could interfere with insulin receptor-related targets. Although biochemical mechanisms are still uncertain, diabetes prevalence in people exposed to DDT could be influenced by the binding of these compounds to proteins involved in the insulin pathway.
Keywords: DDT, AutoDock Vina, AKT-1, insulin, docking
Introduction
This work describes the application of an in silico ligand-protein docking strategy to investigate
possible new protein targets for DDT (1,1,1-trichloro-2,2-bis(4-chlorophenyl)ethane) and its derivatives in the signaling pathway. The synthetic insecticide DDT belongs to a group of chemicals distributed worldwide throughout the environment due to its high potential for bioaccumulation and biomagnification, called persistent organic pollutants (POPs).1 Recently, the exposure to
this kind of compounds has been linked to the increasing incidence of important lifestyle-related diseases such as cancer and diabetes, and many other disorders.2 These
problems are found not only among highly exposed populations, but also in those with lower exposure levels.3
Historically, DDT was used for many decades for malaria and insect control as a consequence of its capability of targeting the insect nervous system; altering sodium and potassium transport.4 Since the 1970s, the production and
of this pesticide and its metabolites, DDD 2,2-bis(4-chlorophenyl)ethane) and DDE (1,1-dichloro-2,2-bis(4-chlorophenyl)ethylene), can be found in the environment around the world.9,10
The reported half-life of DDT in the environment usually ranges from 2 to 15 years.11 After exposure, DDT
enters the circulatory system and it is transported via the lipid component in plasma.12 DDT as well as some of its
derivatives (such as DDD and DDE) have been classified as priority pollutants by the US Environmental Protection Agency.13 Besides, both p,p’-DDT and its main metabolite p,p’-DDE have proven to be estrogen receptor agonists, and p,p’-DDE an androgen receptor antagonist.14 In addition, p,p’-DDT is considered a possible human carcinogen.11,15 A
number of studies also showed dose-response relationships between serum concentrations of p,p’-DDT and the
prevalence of diabetes.11,16-19 Interestingly, there is the
possibility that patients with diabetes may retain more of these pollutants than healthy ones.17 Moreover, low serum
levels of p,p’-DDE have shown strong associations with
the risk of developing type 2 diabetes.20 Direct evidence of
the role of DDT on diabetes has been gathered from in vivo
studies. This chemical dramatically reduces glucose uptake in guinea pigs, mice and rats.21
Therefore, based on the existing data regarding the relationship between DDT exposure and diabetes, our group hypothesized that some of the proteins involved in the signal transduction pathway activated by the insulin could be targets for DDT and its derivatives. Accordingly, an in silico ligand-protein docking strategy was used to
evaluate the possible interactions between DDT and other related compounds with proteins that have been recognized as participants in the insulin signaling pathway.
Methodology
A literature search for proteins reported to have a role in diabetes was made using different available data repositories and text mining tools in systems biology, such as PubMed,22 Information Hyperlinked over Proteins
(IHop),23 Ali Baba24 and Chilibot.25 The selection criteria
used to choose proteins related to diabetes using these tools included the presence of the protein name in the text, as well as a description of their function in diabetes.
The coordinates of the three-dimensional structures of the proteins selected as working targets were obtained from the Protein Data Bank (PDB), and processed using SYBYL 8.1 software package (Tripos, St. Louis, MO) by removing all substrates and water molecules. Then, the protein structures were pre-analyzed and prepared for the docking runs using the biopolymer structure preparation tool with default settings as implemented in the SYBYL program
package (Tripos, St. Louis, MO),26 and subsequently
optimized by the Powell method using the Kollman United force field, AMBER charges, dielectric constant 1.0, NB cutoff 8.0, maximum interactions 100 and termination gradient 0.001 kcal mol-1.27 The minimized pdb-formatted
file was read directly into AutoDock Tools of MGLTools,28
which was used to prepare the input pdbqt file required by AutoDock Vina program, and to set the size and center to the grid box. Kollman charges and polar hydrogens atoms were added to the tridimensional structures of the proteins in the same software.29
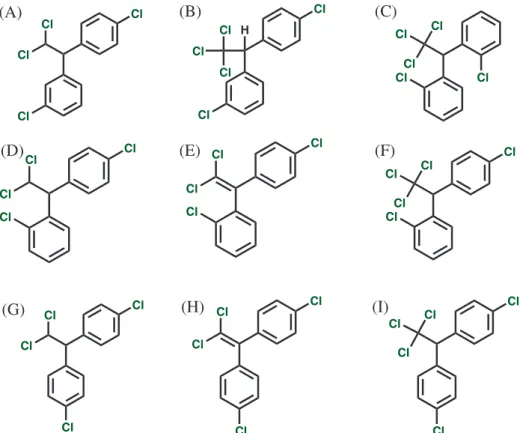
DDT and its derivatives (Figure 1; m,p’-DDD
(CID: 96516), m,p’-DDT (CID: 20328), o,o’-DDT
(CID: 154395), o,p’-DDD (CID: 4211), o,p’-DDE
(CID: 246598), o,p’-DDT (CID: 13089), p,p’-DDD
(CID: 6294), p,p’-DDE (CID: 3035) and p,p’-DDT
(CID: 3036)) were modeled in SYBYL 8.1 using Tripos molecular mechanics (MM) force field, with Powell energy minimization algorithm, Gasteiger-Hückel charges and 0.001 kcal mol−1 Å−1 energy gradient convergence criterion.
The geometries of these molecules were also further optimized using density functional theory (DFT) at the B3LYP/6-31G level, and calculations were carried out with Gaussian 03 program package.30 The resultant geometry
was translated into Mol2 format with Open Babel.31
Docking calculations for target proteins and DDT-related compounds were performed using AutoDock Vina 1.0,32 with a working grid that involved the whole
protein surface in order to cover all possible binding sites. The parameters used in AutoDock Vina were as follows: number of modes = 20, exhaustiveness = 20, and the MGLTools parameters, which consisted of a grid with a spacing of 1.0 Å, a box size which includes the number of points to contain all the protein, and a central point of the macromolecule in the x, y, and z dimensions. The
affinity scoring function in the AutoDock Vina 1.0 docking program was used as a measure of binding affinity between protein and ligand. Each docking process was repeated ten times and the average value from the best binding poses for all runs was considered as the docking affinity, and reported with its respective standard deviation.
In order to identify the relationship between the docking affinities generated for all the tested compounds, values calculated using DFT optimized structures were submitted to cluster analysis applying the squared Euclidean distance method,33 incorporated in Statgraphics Centurion XV. Finally,
the LigandScout 2.0 software34 was used for the detection of
was 7 Å. This threshold defines a sphere (in Å) around the ligand. All atoms of the protein, which are enclosed inside the sphere, are considered as possible interactions. All of the remaining settings were maintained as the default.35
Refinement docking experiments were carried out focused on the correct binding site, predicted by the docking procedure, using a grid spacing of 0.375 Å and exhaustiveness 50 for the complexes that exhibited docking affinity scores less than –8.0 kcal mol–1. Ten runs were
carried out, and the dimensions of the working grid were defined in order to include the contact residues of the binding site, predicted by LigandScout for each complex.
The reliability of the docking procedures used in this study was validated utilizing experimental data from the literature.36 For this purpose, binding affinities
(expressed as pKi) to the wild type androgen receptor (AR; PDB_ID: 2Q7I) were calculated for 21 different compounds, including the studied DDT-derivatives, p,p’-DDT, o,p’-DDT and p,p’-DDE, which had reported antagonist
activity with AR.14 Geometry optimization (DFT) of
these molecules as well as the docking calculations were carried out exactly as described before. Subsequently, the correlation between AutoDock Vina-calculated affinity scores (kcal mol−1) and experimental pKi values,
was measured by GraphPad InStat statistic program (3.05 version, 2000). In silico docking affinity scores
(kcal mol−1) were also used to evaluate the ligand efficiency
indexes (LEIs) from ∆G and structural data,37 in particular,
surface efficiency indexes (NSEI) and binding efficiency indexes (nBEI), according to the following equations.37,38
∆G = – RT ln Ki (1)
(2)
(3)
where ∆G is considered approximately equal to the binding affinity score from AutoDock Vina; Nheavy is the number of non-hydrogen atoms and NPol the number of polar atoms.
Results
Based on text mining data, 59 proteins were identified as the most frequently reported as having a major role on the signaling pathway activated by insulin. The average affinity scores for the AutoDock Vina docking of DDT (1,1,1-trichloro-2,2-bis(4-chlorophenyl)ethane and its derivatives with these proteins are presented in Table 1. Affinity data obtained from MM− (Table S1) and structures optimized by the DFT method (Table 1) were
(A) (B) (C)
(E)
(D) (F)
(G) (H) (I)
Cl
Cl
Cl Cl
Cl Cl
Cl Cl Cl
Cl
Cl Cl
Cl
H
Cl
Cl Cl
Cl
Cl
Cl
Cl Cl Cl
Cl
Cl
Cl Cl Cl
Cl Cl
Cl Cl
Cl Cl
Cl Cl
Cl
Cl
Cl Cl
Cl
Table 1. Docking affinities (kcal mol–1) for DDT and related compounds, optimized by DFT, binding to insulin pathway proteins
Protein name Short name PDB_ ID p.p’-DDT m.p’-DDD m.p’-DDT o.o’-DDT o.p’-DDD o.p’-DDE o.p’-DDT p.p’-DDD p.p’-DDE Cell adhesion
Flotillin 2 Flot2 1win –6.4 ± 0.0 –6.1 ± 0.0 –6.6 ± 0.0 –6.1 ± 0.0 –6.0 ± 0.0 –6.1 ± 0.0 –6.2 ± 0.0 –5.8 ± 0.0 –6.5 ± 0.2 Cytokine/Cytokine regulator
Eotaxin-3 TSC-1 1g2s –5.5 ± 0.0 –5.3 ± 0.0 –5.5 ± 0.0 –5.4 ± 0.0 –5.1 ± 0.0 –5.6 ± 0.0 –5.6 ± 0.0 –5.2 ± 0.0 –5.6 ± 0.0 Suppressor of cytokinesignaling 3 SOCS3 2hmh –7.2 ± 0.0 –7.1 ± 0.0 –8.0 ± 0.0 –6.9 ± 0.0 –6.9 ± 0.0 –7.1 ± 0.1 –7.7 ± 0.0 –7.1 ± 0.0 –6.6 ± 0.0 DNA binding protein
Forkhead box protein O3 FOXO3 A 2k86 –5.0 ± 0.0 –5.4 ± 0.0 –5.4 ± 0.0 –5.7 ± 0.0 –5.7 ± 0.0 –6.1 ± 0.0 –5.0 ± 0.0 –5.6 ± 0.0 –5.1 ± 0.0 Endocytosis/Exocytosis
Cdc42-interacting protein 4 CIP4 2efk –6.5 ± 0.0 –6.7 ± 0.0 –6.6 ± 0.0 –6.0 ± 0.1 –6.2 ± 0.0 –6.2 ± 0.0 –5.9 ± 0.0 –6.3 ± 0.1 –6.1 ± 0.0 Hormone/Growth Factor
Insulin Insulin 1mso –5.6 ± 0.0 –5.9 ± 0.0 –5.7 ± 0.0 –5.5 ± 0.0 –5.5 ± 0.1 –5.5 ± 0.0 –5.5 ± 0.0 –5.6 ± 0.0 –5.7 ± 0.2 Transcription regulator
Protein SinI sinI 1b0n –6.3 ± 0.0 –5.9 ± 0.0 –6.5 ± 0.0 –6.3 ± 0.0 –6.3 ± 0.0 –6.2 ± 0.0 –6.4 ± 0.0 –6.1 ± 0.0 –6.0 ± 0.0 Hydrolase
Ras-likeprotein TC10 TC10 2atx –5.8 ± 0.1 –6.0 ± 0.0 –6.2 ± 0.0 –5.6 ± 0.1 –5.6 ± 0.0 –6.2 ± 0.0 –5.7 ± 0.0 –5.9 ± 0.1 –5.9 ± 0.0 Tyr−protein phosphatase non-receptor
type 11
Shp2 3o5x –6.0 ± 0.0 –5.9 ± 0.0 –5.9 ± 0.1 –6.0 ± 0.2 –5.6 ± 0.1 –6.0 ± 0.1 –5.9 ± 0.1 –5.8 ± 0.0 –5.7 ± 0.0 Phosphatase and tensin homolog PTEN 1d5r –7.1 ± 0.0 –6.9 ± 0.0 –7.7 ± 0.0 –6.9 ± 0.0 –6.9 ± 0.0 –7.1 ± 0.0 –6.6 ± 0.1 –7.1 ± 0.0 –6.7 ± 0.0 Tyr-protein phosphatase non-receptor
type 1
PTP-1B 3eax –6.2 ± 0.0 –6.0 ± 0.0 –6.4 ± 0.0 –6.1 ± 0.0 –5.9 ± 0.0 –6.1 ± 0.0 –6.6 ± 0.0 –6.2 ± 0.0 –6.1 ± 0.0 Ser/Thr protein phosphatase PP1-β
catalytic subunit
PP-1B 1s70 –5.0 ± 0.0 –4.9 ± 0.0 –4.9 ± 0.0 –4.8 ± 0.0 –4.5 ± 0.0 –4.9 ± 0.0 –4.7 ± 0.0 –4.9 ± 0.0 –4.8 ± 0.0
cAMP/cAMP-inhibited cGMP 3’.
5’-cyclic phosphodiesterase 10A PDE10A 2wey –7.3 ± 0.0 –7.8 ± 0.0 –7.4 ± 0.1 –6.6 ± 0.1 –7.6 ± 0.0 –7.5 ± 0.0 –6.9 ± 0.0 –8.1 ± 0.0 –8.5 ± 0.0 Immunesystem
Tumor necrosis factor TNF 3l9j –5.9 ± 0.0 –5.7 ± 0.1 –6.2 ± 0.3 –5.6 ± 0.1 –5.8 ± 0.1 –6.2 ± 0.2 –5.6 ± 0.0 –5.8 ± 0.0 –5.8 ± 0.1 Insulin receptor substrate 2 IRS-2 3fqx −3.3 ± 0.1 −3.3 ± 0.0 −3.3 ± 0.0 −3.0 ± 0.0 −3.2 ± 0.0 −3.4 ± 0.0 −3.2 ± 0.1 −3.2 ± 0.1 −3.4 ± 0.0 Ligase
Amiloride-sensitive sodium channel
subunit beta ENaC 1i5h –6.3 ± 0.1 –6.2 ± 0.0 –6.5 ± 0.2 –6.1 ± 0.0 –6.1 ± 0.0 –6.5 ± 0.1 –6.5 ± 0.0 –6.2 ± 0.0 –6.3 ± 0.1 Oxidoreductase/Metal BindingProtein
Cytoplasmic protein NCK2 Nck-2 1u5s –5.6 ± 0.2 –5.7 ± 0.0 –5.4 ± 0.1 –5.6 ± 0.0 –5.2 ± 0.1 –5.5 ± 0.0 –5.4 ± 0.2 –5.5 ± 0.0 –5.2 ± 0.0 EHdomain-containingprotein 1 EHD1 2jq6 –5.5 ± 0.0 –6.3 ± 0.0 –6.4 ± 0.0 –5.5 ± 0.1 –5.8 ± 0.3 –5.6 ± 0.0 –5.3 ± 0.0 –6.1 ± 0.1 –5.6 ± 0.0 Nitric oxide synthase. inducible iNOS 3hr4 –7.1 ± 0.3 –7.4 ± 0.3 –7.3 ± 0.2 –6.7 ± 0.4 –7.1 ± 0.1 –7.5 ± 0.3 –6.9 ± 0.2 –7.4 ± 0.3 –7.6 ± 0.2 Phosphoinositide 3 Kinase Gamma
Phosphatidylinositol 3-kinase
catalyticsubunit PI3K p110 1e8y –7.1 ± 0.1 –7.4 ± 0.0 –7.2 ± 0.1 –6.4 ± 0.0 –6.9 ± 0.0 –6.9 ± 0.2 –6.9 ± 0.1 –7.0 ± 0.0 –8.2 ± 0.0 Phosphotransferase
Extracellularsignal-regulatedkinase 2 ERK-2 2erk –6.7 ± 0.0 –6.6 ± 0.0 –6.9 ± 0.0 –6.6 ± 0.0 –6.5 ± 0.0 –6.7 ± 0.0 –6.6 ± 0.0 –6.5 ± 0.0 –6.8 ± 0.0 Protein binding/Transferase
Adaptermoleculecrk Crk 1ju5 –6.0 ± 0.0 –6.1 ± 0.0 –6.1 ± 0.0 –6.2 ± 0.0 –5.5 ± 0.0 –6.4 ± 0.0 –6.0 ± 0.0 –5.9 ± 0.0 –5.9 ± 0.1 Syntaxinbindingprotein 4 Synip 1wi4 –6.7 ± 0.0 –6.8 ± 0.1 –6.7 ± 0.0 –6.7 ± 0.0 –6.3 ± 0.1 –6.6 ± 0.0 –6.5 ± 0.0 –6.3 ± 0.0 –7.3 ± 0.0 Serine/Threonine Protein Kinase
Proto-oncogene c-RAF cRAF 1rfa –5.4 ± 0.0 –5.6 ± 0.0 –6.0 ± 0.0 –5.1 ± 0.0 –5.1 ± 0.0 –5.7 ± 0.0 –5.3 ± 0.0 –5.6 ± 0.0 –5.4 ± 0.0 Signal transduction
Insulin receptor substrate 1 IRS-1 1qqg –7.2 ± 0.2 –6.8 ± 0.0 –7.2 ± 0.0 –7.0 ± 0.2 –7.1 ± 0.0 –7.4 ± 0.0 –7.0 ± 0.1 –7.0 ± 0.0 –7.2 ± 0.0 Signaling protein/Gene regulation
Growth factor receptor-bound protein 2 Grb2 1jyr –5.6 ± 0.0 –5.4 ± 0.0 –5.9 ± 0.0 –5.5 ± 0.1 –5.4 ± 0.0 –5.6 ± 0.0 –5.3 ± 0.0 –5.5 ± 0.0 –5.5 ± 0.0 Signaling inositol polyphosphate
phosphatase SHIP II SHIP2 2ysx –5.2 ± 0.0 –5.1 ± 0.0 –5.5 ± 0.0 –5.7 ± 0.0 –5.1 ± 0.0 –5.6 ± 0.0 –5.4 ± 0.0 –5.3 ± 0.0 –5.4 ± 0.0 SHC-transforming protein 1 SHC 1oy2 –6.4 ± 0.0 –6.0 ± 0.1 –6.2 ± 0.0 –5.9 ± 0.0 –5.8 ± 0.0 –5.7 ± 0.1 –5.6 ± 0.0 –6.2 ± 0.1 –6.5 ± 0.1 Son of sevenless protein homolog 1 SOS-1 1xd4 –7.8 ± 0.5 –7.5 ± 0.4 –7.1 ± 0.1 –6.8 ± 0.1 –7.2 ± 0.0 –7.7 ± 0.3 –7.0 ± 0.1 –7.9 ± 0.1 –7.0 ± 0.0 Son of sevenless protein homolog 1 SOS-1 1dbh –6.8 ± 0.1 –7.2 ± 0.0 –6.9 ± 0.0 –6.5 ± 0.0 –6.2 ± 0.0 –6.6 ± 0.0 –6.7 ± 0.0 –7.1 ± 0.0 –6.8 ± 0.0 Agouti signaling protein ASP 1y7j –5.4 ± 0.0 –5.4 ± 0.0 –5.3 ± 0.0 –5.5 ± 0.0 –4.9 ± 0.0 –5.3 ± 0.0 –5.1 ± 0.0 –5.0 ± 0.0 –5.2 ± 0.0 Tumor necrosis factor receptor 1 TNFR-1 1ext –6.1 ± 0.0 –5.9 ± 0.1 –6.3 ± 0.3 –6.1 ± 0.1 –5.8 ± 0.0 –6.1 ± 0.1 –6.1 ± 0.0 –5.9 ± 0.0 –6.1 ± 0.0 GTP-binding protein Rheb RHEB 1xts –7.2 ± 0.4 –7.4 ± 0.1 –7.5 ± 0.2 –6.3 ± 0.0 –6.5 ± 0.5 –6.7 ± 0.0 –6.4 ± 0.0 –7.2 ± 0.1 –7.6 ± 0.0 Structural protein/Protein binding
Protein name Short name PDB_ ID p.p’-DDT m.p-DDD m.p’-DDT o.o’-DDT o.p’-DDD o.p’-DDE o.p’-DDT p.p’-DDD p.p’-DDE Transcription
Forkhead box protein O1 FOXO1 3co6 –5.3 ± 0.0 –5.3 ± 0.1 –5.2 ± 0.0 –5.3 ± 0.0 –4.8 ± 0.1 –5.4 ± 0.0 –5.1 ± 0.0 –5.3 ± 0.0 –5.0 ± 0.0 Forkhead box protein O4 FOXO4 3l2c –5.2 ± 0.0 –5.2 ± 0.1 –5.6 ± 0.0 –5.4 ± 0.0 –5.1 ± 0.0 –5.3 ± 0.0 –5.1 ± 0.0 –5.2 ± 0.0 –4.9 ± 0.0 Transferase
Protein kinase C theta type PKCθ 1xjd –7.1 ± 0.0 –7.6 ± 0.0 –7.5 ± 0.0 –6.9 ± 0.1 –7.7 ± 0.1 –7.9 ± 0.0 –7.2 ± 0.0 –7.5 ± 0.0 –8.0 ± 0.0 Proto-oncogene tyrosine-protein kinase
FYN
Fyn 1zbj –7.9 ± 0.1 –7.4 ± 0.0 –7.3 ± 0.0 –6.7 ± 0.0 –6.9 ± 0.0 –7.6 ± 0.0 –7.5 ± 0.0 –7.1 ± 0.0 –7.3 ± 0.0 GlgA glycogen synthase GS 2bfw –5.9 ± 0.0 –5.8 ± 0.0 –5.8 ± 0.0 –5.6 ± 0.1 –5.4 ± 0.0 –5.9 ± 0.0 –5.5 ± 0.0 –5.6 ± 0.0 –5.8 ± 0.0 Insulin receptor IR 1ir3 –6.7 ± 0.1 –7.0 ± 0.0 –6.8 ± 0.1 –6.5 ± 0.0 –6.3 ± 0.0 –7.1 ± 0.0 –6.6 ± 0.0 –6.6 ± 0.0 –7.2 ± 0.0 Phosphatidylinositol 3-kinase PI3K p85 1h9o –5.6 ± 0.0 –5.5 ± 0.0 –5.9 ± 0.0 –5.2 ± 0.1 –5.2 ± 0.0 –6.1 ± 0.0 –5.3 ± 0.0 –5.6 ± 0.0 –5.8 ± 0.0 C-Jun N-terminal kinase 3 JNK 2p33 –7.4 ± 0.0 –7.5 ± 0.0 –7.5 ± 0.0 –6.8 ± 0.0 –7.1 ± 0.0 –7.9 ± 0.0 –7.3 ± 0.0 –7.4 ± 0.0 –7.5 ± 0.0 Ribosomal protein S6 kinase beta-1 P70S6K 3a62 –7.5 ± 0.0 –7.7 ± 0.0 –7.7 ± 0.0 –6.7 ± 0.0 –6.7 ± 0.1 –7.4 ± 0.0 –7.2 ± 0.0 –7.6 ± 0.0 –7.2 ± 0.0 Glycogen synthase kinase-3 beta GSK3B 1uv5 –7.4 ± 0.0 –7.9 ± 0.0 –7.1 ± 0.0 –6.7 ± 0.0 –7.8 ± 0.0 –6.6 ± 0.0 –6.8 ± 0.1 –7.9 ± 0.0 –8.3 ± 0.0 Ser/Thr-protein kinase Sgk1 SGK 3hdn –8.0 ± 0.0 –7.6 ± 0.0 –7.9 ± 0.1 –7.1 ± 0.0 –7.5 ± 0.0 –8.4 ± 0.0 –7.4 ± 0.6 –7.6 ± 0.0 –8.0 ± 0.0 Mammalian target of rapamycin MTOR 2npu –7.4 ± 0.3 –7.2 ± 0.0 –7.4 ± 0.0 –7.0 ± 0.0 –6.7 ± 0.0 –7.3 ± 0.0 –6.9 ± 0.0 –7.4 ± 0.0 –7.1 ± 0.0 Rac-gamma Ser/Thr-protein kinase AKT-3 2x18 –7.3 ± 0.1 –7.2 ± 0.0 –7.2 ± 0.1 –7.1 ± 0.4 –6.6 ± 0.0 –7.1 ± 0.0 –7.0 ± 0.0 –7.0 ± 0.0 –7.0 ± 0.4 Rac-beta Ser/Thr-protein kinase AKT-2 2x39 –7.2 ± 0.0 –6.9 ± 0.0 –7.5 ± 0.0 –7.3 ± 0.2 –7.1 ± 0.0 –7.0 ± 0.2 –7.4 ± 0.0 –6.8 ± 0.0 –7.0 ± 0.1 Rac-alpha Ser/Thr-protein kinase AKT-1 3cqu –7.7 ± 0.5 –8.7 ± 0.0 –8.4 ± 0.7 –5.9 ± 0.0 –7.6 ± 1.0 –8.9 ± 0.0 –7.3 ± 0.7 –8.6 ± 0.0 –9.5 ± 0.0 5’-AMP-activated protein kinase AMPK 2v8q –7.7 ± 0.2 –8.1 ± 0.0 –7.8 ± 0.6 –7.4 ± 0.4 –7.7 ± 0.3 –8.0 ± 0.4 –8.0 ± 0.4 –7.7 ± 0.0 –7.8 ± 0.0 ATP-citrate synthase ACL 3mwd –7.8 ± 0.0 –7.8 ± 0.0 –7.9 ± 0.0 –7.0 ± 0.1 –7.7 ± 0.0 –7.5 ± 0.0 –7.1 ± 0.0 –7.9 ± 0.0 –7.8 ± 0.0 Dual specificity mitogen-activated
protein kinase kinase 2 MEK2 1s9i –7.2 ± 0.6 –7.7 ± 0.4 –7.1 ± 0.2 –6.0 ± 0.0 –7.3 ± 0.5 –6.9 ± 0.3 –6.7 ± 0.0 –7.9 ± 0.0 –7.9 ± 0.6 Dual specificity mitogen-activated
protein kinase kinase 1
MEK1 2p55 –6.8 ± 0.0 –7.1 ± 0.3 –6.8 ± 0.0 –6.1 ± 0.0 –6.4 ± 0.1 –6.3 ± 0.0 –6.1 ± 0.1 –6.9 ± 0.0 –7.1 ± 0.0 Transferase/Transferase inhibitor
cAMP-dependent protein kinase. alpha-catalytic subunit
PKA 2qcs –8.1 ± 0.2 –8.3 ± 0.5 –7.9 ± 0.4 –7.1 ± 0.0 –7.0 ± 0.3 –7.5 ± 0.0 –7.5 ± 0.3 –8.6 ± 0.2 –7.9 ± 0.0 Translation
Eukaryotic translation initiation factor 4E
eIF4E 1wkw –8.5 ± 0.0 –8.3 ± 0.0 –8.5 ± 0.0 –7.6 ± 0.3 –8.7 ± 0.0 –8.4 ± 0.1 –8.5 ± 0.0 –8.1 ± 0.1 –8.2 ± 0.0 Translation initiation factor eIF2B
subunit alpha
eIF2B 3ecs –6.4 ± 0.1 –6.2 ± 0.0 –6.4 ± 0.0 –6.5 ± 0.0 –6.3 ± 0.1 –6.3 ± 0.0 –6.3 ± 0.0 –6.3 ± 0.0 –6.4 ± 0.0
Translation initiation factor eIF2B.
subunit delta eIF2B 1t5o –6.7 ± 0.0 –6.8 ± 0.1 –6.9 ± 0.0 –7.0 ± 0.0 –6.4 ± 0.0 –6.9 ± 0.0 –6.7 ± 0.0 –6.9 ± 0.0 –6.6 ± 0.0 Translation initiation factor eIF2B
subunit epsilon
eIF2B 3jui –5.8 ± 0.1 –5.6 ± 0.0 –5.9 ± 0.0 –5.4 ± 0.0 –5.5 ± 0.0 –5.7 ± 0.0 –5.6 ± 0.0 –5.6 ± 0.0 –5.7 ± 0.0 Eukaryotic translation initiation factor
4E binding protein 1
4E-BP1 3hxg –5.1 ± 0.0 –5.0 ± 0.0 –5.0 ± 0.0 –5.0 ± 0.0 –4.5 ± 0.0 –4.7 ± 0.0 –4.6 ± 0.1 –5.0 ± 0.1 –4.9 ± 0.1 Table 1. continuation
quite similar, and in those cases in which values were not the same, most differences varied around 0.1 kcal mol−1.
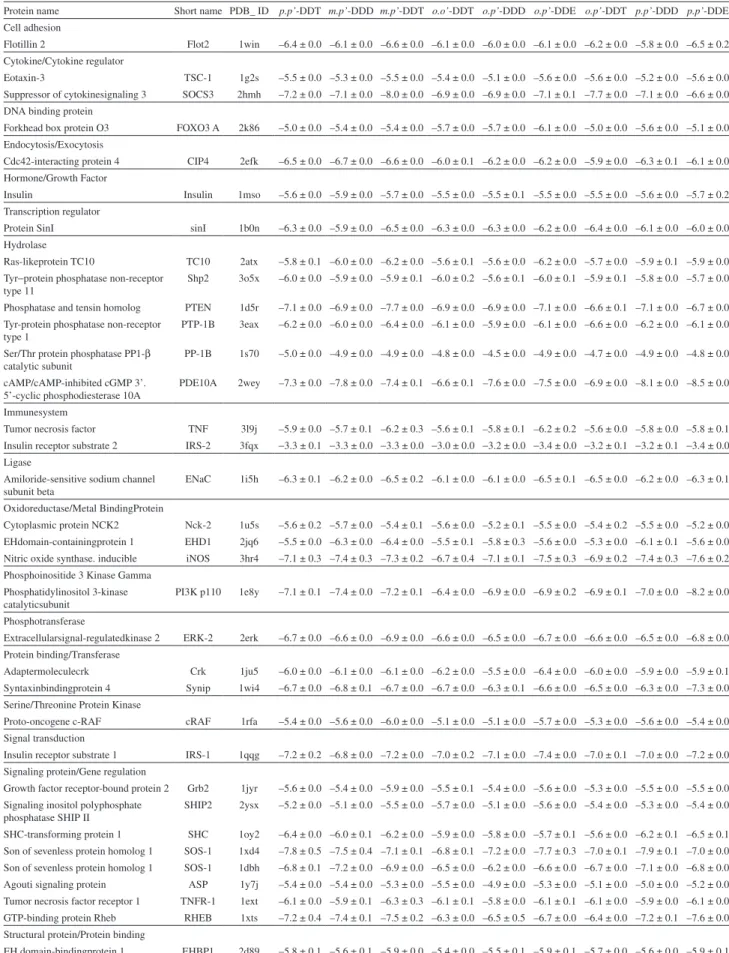
The localization of the potential protein targets found in the insulin receptor signaling pathway is presented in Figure 2 (adapted from reference 39). Proteins highlighted in yellow represent those that presented the best AutoDock Vina affinity with values less than –8.0 kcal mol–1 for the
docking with DDT or its derivatives.
In addition to the amino acid residues and the types of interactions present in each ligand-protein complex, the pharmacophore obtained for DDT or its derivatives, generated by LigandScout 2.0, based on the hotspots interactions with the targets that exhibited absolute affinity scores greater than 8.0 kcal mol−1, are presented in Table 2.
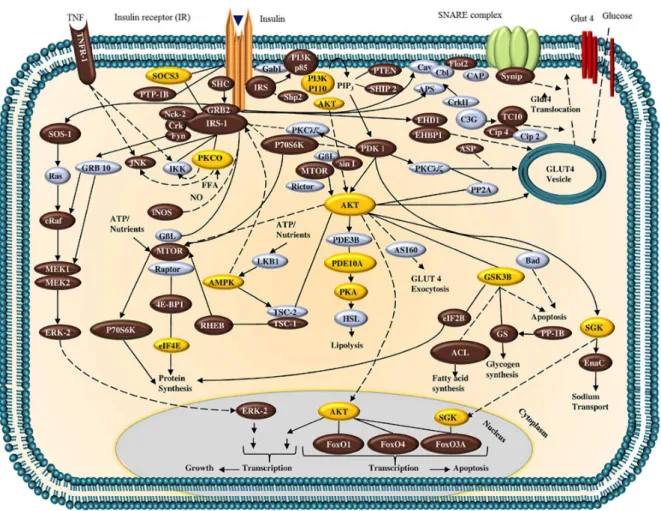
The complex with the greatest binding affinity score was Rac-alpha serine/threonine-protein kinase (AKT-1;
PDB_ID: 3cqu)/p,p’-DDE with an average of −9.5 kcal mol−1
(Figure 3F). The complexes formed between AKT-1 and several DDT-related compounds, as well as the protein residues that interact with these ligands are shown in Figure 3. Most of the interactions were hydrophobic, with few aromatic ring interactions, which are represented as arrows.
Other receptors also exhibited good affinity (equal or less than –8.4 kcal mol–1) for one or more of the
Figure 2. Signal transduction system related to insulin receptor activation. Proteins in yellow boxes correspond to those with the greatest theoretical affinity scores for DDT and its derivatives (adapted from reference 39).
Table 2. Binding residues and type of interactions observed for proteins with high docking affinity values for DDT and its derivative compounds. Yellow elements are those that participate in hydrophobic interactions. Aromatic interaction elements are represented with violet
Protein name PDB code Ligand Pharmacophore Contact residue Chemical feature
AKT-1 3cqu m,p’-DDT
Phe161a, Lys179a, Thr211a, Met281a, Ala230a, Val164a,
Thr291a, Ala177a.
hydrophobic interaction aromatic interaction with ring
m,p’-DDD
Thr211a, Phe161a, Thr291a, Ala177a, Ala230a, Met227a, Lys179a, Met281a, Val164a.
hydrophobic interaction aromatic interaction with ring
o,p’-DDE
Phe161a, Leu156a, Met227a, Ala230a, Ala177a, Val164a, Lys179a, Thr211a, Met281a,
Thr291a.
hydrophobic interaction aromatic interaction with ring
p,p’-DDD
Tyr229a, Ala230a, Leu156a, Phe438a, Ala177a, Val164a, Thr291a, Phe161a, Lys179a,
Met281a, Phe442a.
hydrophobic interaction
p,p’-DDE
Leu156a, Phe438a, Ala230a, Thr291a, Met281a, Phe161a, Val164a, Lys179a, Ala177a,
Tyr229a, Met227a.
Protein name PDB code Ligand Pharmacophore Contact residue Chemical feature
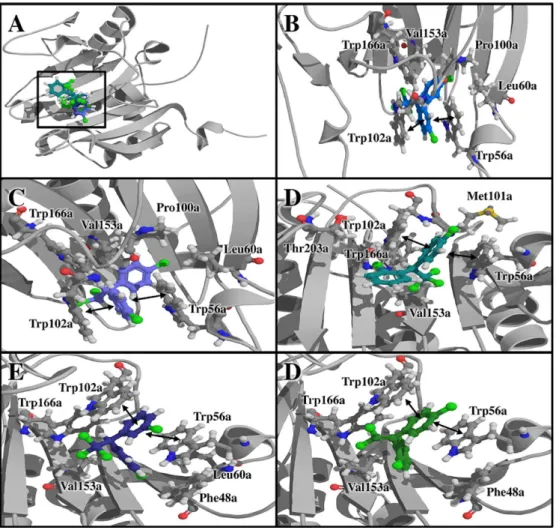
eIF4E 1wkw o,p’-DDD Trp 56a, Trp 102a, Val153a, Trp 166a. aromatic interaction with ringhydrophobic interaction
o,p’-DDT Val153a, Trp166a, Thr203a.Trp56a, Met101a, Trp102a, aromatic interaction with ringhydrophobic interaction
o,p’-DDE Phe48a, Trp56a, Trp102a, Trp166a, Val153a. aromatic interaction with ringhydrophobic interaction
m,p’-DDT Trp102a, Val153a, Trp166a,Phe48a, Trp56a, Leu60a, aromatic interaction with ringhydrophobic interaction
p,p’-DDD Trp56a, Trp102a, Trp166a, Leu60a, Val153a. aromatic interaction with ringhydrophobic interaction
p,p’-DDT Trp102a, Val153a, Trp166a.Pro100a, Leu60a, Trp56a, aromatic interaction with ringhydrophobic interaction
m,p’-DDD Trp56a, Trp102a, Thr203a, Trp166a, Val153a. aromatic interaction with ringhydrophobic interaction
p,p’-DDE Trp166a, Val153a, Thr203a.Met101a, Trp102a, Trp56a, aromatic interaction with ringhydrophobic interaction
PKA 2qcs p,p’-DDT
Leu19a, Leu152a, Phe100a, Ile303a, Tyr306a, Val15a, Lys292a, Phe18a, Leu19a.
hydrophobic interaction aromatic interaction with ring
m,p’-DDD
Tyr306a, Ile303a, Phe18a, Leu152a, Val15a, Phe100a,
Leu19a, Lys292a.
hydrophobic interaction aromatic interaction with ring
p,p’-DDD
Leu152a, Phe18a, Phe100a, Tyr306a, Val15a, Ile303a,
Lys292a, Leu19a.
hydrophobic interaction aromatic interaction with ring
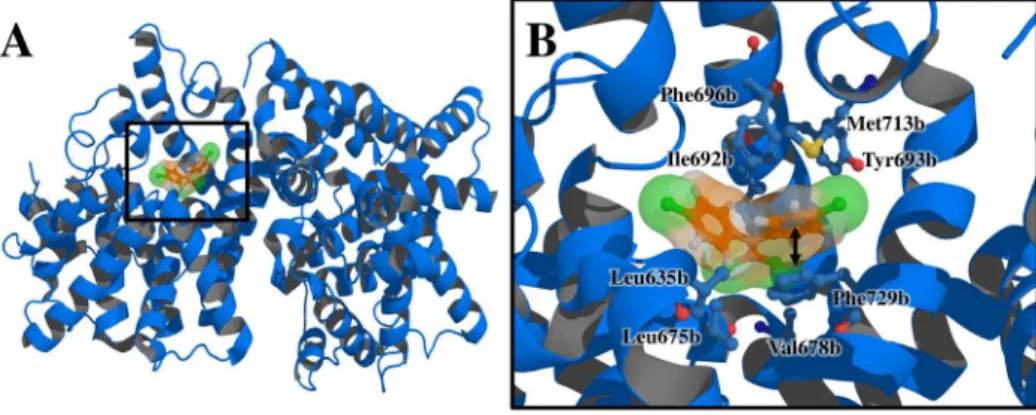
PDE10A 2wey p,p’-DDE
Phe696b, Leu635b, Val678b, Ile692b, Leu675b, Phe729b,
Met713b, Tyr693b.
hydrophobic interaction aromatic interaction with ring
p,p’-DDD
Ile692b, Phe729b, Met713b, Met714b, Val678b, Leu675b, Tyr524b, Leu635b, Phe96b.
Protein name PDB code Ligand Pharmacophore Contact residue Chemical feature
AMPK 2v8q m,p’-DDD
Phe61e, Lys252e, Ala62e, Val252b, Tyr269b, Val250b,
Tyr254e, Ala249e.
hydrophobic interaction aromatic interaction with ring
o,p’-DDE Val250b, Val252b, Tyr269b.Phe61e, Lys252e, Ala62e, aromatic interaction with ringhydrophobic interaction
GSK3B 1uv5 p,p’-DDE
Val70a, Ala83a, Cys199a, Leu132a, Val110a, Tyr134a, Thr138a, Leu188a, Val135a,
Ile62a, Met101a.
hydrophobic interaction
PI3K p110 1e8y p,p’-DDE
Ile831a, Ile881a, Met953a, Ala885a, Pro810a, Trp812a, Tyr867a, Met804a, Ile879a,
Ile963a.
hydrophobicinteraction
PKCθ 1xjd p,p’-DDE
Leu386a, Val394a, Ala407a, Thr442a, Met458a, Tyr460a,
Leu511a, Ala521a.
hydrophobic interaction
SOCS3 2hmh m,p’-DDT Ile 151a, Ile 144a, Leu 93a. hydrophobic interaction
SGK 3hdn p,p’-DDE
Val160a, Thr239a, Val112a, Phe109a, Phe241a, Lys245a,
Ile104a, Leu176a, Ala125a, Leu243.
hydrophobic interaction Table 2. continuation
Furthermore, other proteins such as the 5’-AMP-activated protein kinase (AMPK; PDB_ID: 2v8q), for which DDT or its related molecules, presented a slightly poorer affinity than the referred receptors, may also be weak theoretical targets (Table 2).
Docking affinity scores resulting from refinement docking experiments for the best complexes were similar to the first docking and they are presented in Table 3.
Cluster analysis, employing the squared Euclidean distance method, was performed for compounds optimized by DFT method in order to evaluate binding affinity relationships for all DDT derivatives. The resulting dendrogram is shown in Figure 7.
Validation was performed through the correlation between the docking results and experimental affinity data for different ligands of the androgen receptor. This protein was selected because it has been reported to be a target of one of the studied compounds, p,p’-DDE, which presents
an antagonist activity to this receptor.14 The in silico
affinity of tested compounds for the wild type androgen receptor as well as the calculated and experimental pKi
are presented in Table 4, and the correlations between predicted and experimental data are shown in Figure 8. The correlation coefficient between calculated binding affinity and experimental pKi for the wild type androgen receptor was moderate (R = − 0.476, P = 0.029).
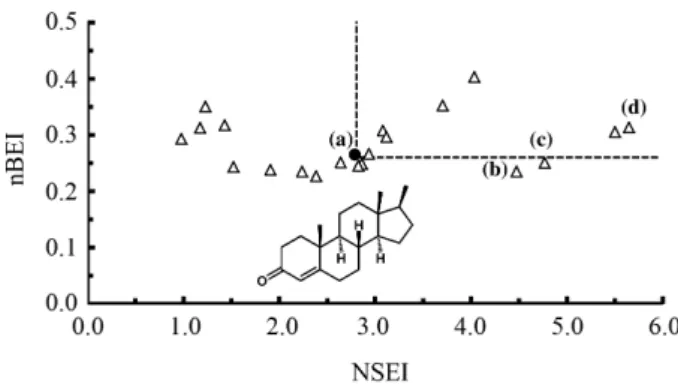
Finally, the graph of correspondence between the ligand efficiency indexes nBEI-NSEI for the 21 compounds that bind to the AR (PDB_ID: 2q7i), as described in the Methodology section, are presented in Figure 9.
Discussion
Figure 3. (A) Docking of Rac-alpha Ser/Thr-protein kinase-glycogen synthase kinase-3 beta (AKT-1) with DDT and its derivatives. Tridimensional view of the complex formed by AKT-1 with (B) m,p’-DDT, (C) m,p’-DDD, (D) o,p’-DDE, (E) p,p’-DDD and (F) p,p’-DDE.
affinity scores are not necessarily related to the total number of interactions or the ring aromatic ones. For instance, the complex eIF4E/o,p’-DDD has only four predicted
interactions, and an affinity score of −8.7 kcal mol−1. In
contrast, AKT-1/p,p’-DDD has ten interactions and a
slightly lower affinity score with −8.6 kcal mol−1.
Results also showed that for proteins with high affinity scores for more than one DDT derivative, the interacting residues are similar (Table 2, Figures 3 and 6). This suggests that these proteins share pocket communalities for these ligands, and the degree of chlorination in the molecule does not dramatically change the recognition site for this type of organic pollutants.
The dendrogram constructed using the affinity scores for all DDT and related compounds, showed that greater similarities occurred for m,p’-DDD and p,p’-DDD,
probably due to the lack of interactions between the chlorine in the ortho position of the aromatic rings and
the two chlorines from the dichloromethyl group in the DDD molecule. This is in agreement with the clustering positioning for o,o’-DDT, which is the ligand with lower
affinity similarity with the other compounds.
AKT-1 showed the greatest binding affinity for
p,p’-DDE during the docking and the refinement docking
steps (Tables 1 and 3), and it also had good affinity for other DDT compounds such as o,p’-DDE, both acting on
the same binding pocket (Figure 3). This protein plays a central role in integrating anabolic and catabolic responses by transduction the signals emanating from growth factors, nutrients, cytokines and muscle contraction, via changes in the phosphorylation of its numerous substrates (Figure 2).40
Figure 4. Docking of eIF4E with DDT and its derivatives. (A) Tridimensional view of the complex formed by eIF4E with (B) o,p’-DDT, (C) o,p’-DDE, (D) m,p’-DDT, (E) p,p’-DDD and (F) p,p’-DDT.
Figure 5. Docking of eukaryotic translation initiation PKA with m,p’-DDD. (A) Tridimensional view and (B) interactions of the complex formed by PKA with m,p’-DDD.
acid/lipid metabolism processes induced by insulin, such as glucose uptake, glycogen synthesis and suppression of triglyceride synthesis.41 Given the multifunctional function
ascribed to AKT-1, it is likely that this molecule could play a critical role in disorders associated with cellular
metabolism and physiological homeostasis42 that could be
impaired by DDT.
Figure 6. Docking of PDE10A with p,p’-DDE. (A) Tridimensional view and (B) interactions of the complex formed by PDE10A with p,p’-DDE.
Table 3. Affinity scores (kcal mol–1) of the refinement docking experiments
for of DDT and related compound binding to insulin pathway proteins that presented the best affinity scores with AutoDock Vina
Protein name PDB_ID Compound Affinity / (kcal mol-1)
AKT-1 3cqu m,p’-DDT –8.6 ± 0.6
m,p’-DDD –8.5 ± 1.0 o,p’-DDE –9.5 ± 0.0 p,p’-DDD –8.4 ± 0.8 p,p’-DDE –8.9 ± 0.0
eIF4E 1wkw o,p’-DDD –8.2 ± 0.0
o,p’-DDT –8.6 ± 0.0 o,p’-DDE –8.4 ± 0.0 m,p’-DDT –8.5 ± 0.0 p,p’-DDD –8.4 ± 0.1 p,p’-DDT –8.6 ± 0.1 m,p’-DDD –7.9± 0.1 p,p’-DDE –8.3 ± 0.1
PKA 2qcs p,p’-DDT –8.3 ± 0.1
m,p’-DDD –8.8 ± 0.1 p,p’-DDD –8.3 ± 0.1
PDE10A 2wey p,p’-DDE –8.6 ± 0.1
p,p’-DDD –8.2 ± 0.0
AMPK 2v8q m,p’-DDD –8.0 ± 0.0
o,p’-DDE –8.2 ± 0.0
GSK3B 1uv5 p,p’-DDE –8.3 ± 0.0
PI3K p110 1e8y p,p’-DDE –8.1 ± 0.0
PKCθ 1xjd p,p’-DDE –8.1 ± 0.1
SOCS3 2hmh m,p’-DDT –8.0 ± 0.0
SGK 3hdn p,p’-DDE –8.1 ± 0.0
Figure 7. Dendrogram depicting the grouping of theoretical affinities of DDT and its derivatives by studied proteins, using the squared Euclidean distance clustering method. The linkage distance was reported as (Dlink Dmax−1)100.
Figure 8. Calculated docking affinities (kcal mol−1) between 21
compounds and wild type AR (PDB_ID: 2q7i) vs. experimental pKi. DDT derivative spots are denoted such as (a) o,p’-DDT, (b) p,p’-DDT and (c) p,p’-DDE.
strongly interacts with the m7GpppN cap found at the 5’ end of mRNAs,43 playing an important role in cap-dependent
translation initiation as part of the heterotrimeric eIF4F complex, responsible for recruiting the 40s ribosomal subunit to the 5’ end of the Mrna.44 The availability of eIF4E
is regulated by binding with phosphorylated heat and acid stable protein (PHAS-I).45 Diabetes increased the amount
of eIF4E found in the inactive PHAS-I. Insulin treatment of rats with diabetic caused dissociation of this complex, indicating that the effects of both insulin and diabetes involve modulation of the interaction of eIF4E.46
PKA, the cAMP receptor, presented high affinity values for p,p’-DDT, m,p’-DDD and p,p’-DDD (Table 2). This
substrates that regulate a vast number of cellular processes, such as metabolism, cell growth and differentiation, apoptosis, gene expression, ion channel conductivity and vascular tone.47 In streptozotocin-induced diabetic rats, the
expression levels of the mRNA and protein for the catalytic subunit of PKA were significantly decreased. Also, it was found that vasorelaxation mediated by cAMP was impaired, which may be attributable to reduced PKA activity, resulting from an alteration in the pattern of expression of PKA subunits.48 It has been shown that o,p’-DDT
interferes with protein kinase activities in mitochondrial fractions. Nuclear compartmentalization of o,p’-DDT,
insertion in membranes and chemical stress production may be associated with deleterious consequences in these signaling pathways.49
PDE10A showed high affinity values for p,p’-DDE and p,p’-DDD (Table 2).This protein catalyzes the hydrolytic
inactivation of cyclic adenosine and guanosine 3´,5´-monophosphate (cAMP and cGMP). These enzymes play a critical role in regulating the wide variety of physiological processes modulated by cyclic nucleotide signaling,50 such as cardiac contractility, platelet aggregation,
lipolysis, glycogenolysis, smooth muscle contraction, ion channel conductance and apoptosis.51 PDE10A has a putative
phosphorylation site by PKA, which stimulates triglyceride hydrolysis (lipolysis) in adipocytes.52 Accordingly, it is
theoretically plausible that the binding affinity between PDE10A and DDT could be affecting the lipolytic metabolic pathway.53 In pancreatic islets, where signaling by cAMP has
been associated with glucose dependent insulin secretion, PDE10A is overexpressed.54
AMPK is involved in the regulation of whole body energy metabolism, evidenced by the fact that two hormones derived from adipose tissue, leptin and adiponectin, modulate AMPK activity.55 AMPK activation
induced by leptin increases fatty acid oxidation, while
adiponectin, a regulator of glucose and lipid metabolism,56
also stimulates AMPK activity in skeletal muscle and liver, resulting in increased fat oxidation in muscle and liver, increased glucose transport in muscle, and decreased hepatic glucose production.57
Unlike previous proteins, the following targets had high absolute binding affinity values with just one of the compounds derived from DDT (Table 2). Glycogen synthase kinase-3 beta (GSK3B), originally identified as a regulator of glycogen metabolism,58 has been recognized as
an enzyme affecting a diverse range of biological functions including gene expression, cellular architecture and apoptosis.59 Besides, GSK3B regulates hepatic glucose
metabolism, insulin sensitivity and glycogen synthase in skeletal muscle including the heart.60 In diabetes, GSK3B
is activated by decreasing its phosphorylation,61 whereas its
inactivation increased cardiac glucose utilization and lipid accumulation, suggesting that GSK3B plays a critical role in cardiac glucose metabolism.62
Phosphatidylinositol 3-kinase (PI3K) catalyzes the production of phosphatidylinositol-3,4,5-trisphosphate in cell survival pathways, regulates the gene expression and cell metabolism and allows cytoskeletal rearrangements. The PI3K pathway is implicated in human diseases including diabetes and it has become a target for therapeutic intervention.63 Protein kinase C theta type (PKCθ) is a
member of the PCK subfamily, highly expressed in skeletal muscles. It has been implicated in the pathogenesis of insulin resistance,64 which plays a primary role in the
development of type 2 diabetes and may be related to alterations in fat metabolism. Local accumulation of fat metabolites inside skeletal muscle may activate a serine kinase cascade involving PKCθ, leading to defects in insulin signaling and glucose transport in skeletal muscle, which reveals a crucial role mediating fat induced insulin resistance in skeletal muscle.65
The last proteins with higher theoretical affinity binding for these compounds were suppressor of cytokine signaling 3 (SOCS3) and serum- and glucocorticoid-inducible kinase (SGK). SOCS3 is a key negative regulator of cytokine signaling that inhibits the JAK/STAT signal transduction pathway66 and regulates T cells as well as
antigen-presenting cells, including macrophages and dendritic cells.67 SGK is a potent regulator of metabolism,
transport, transcription and enzyme activity that plays a dual role in the pathophysiology of diabetes mellitus. It fosters the development of obesity, predisposing to type 2 diabetes, and it participates in diabetes complications, such as insulin induced hypertension.68
The fact that all those previously described proteins are targets of DDT and are definitively involved in
diabetes does not mean that those are the link between the pesticide and the disease. However, it is a great way to start searching for the connection. Even though docking validation protocol used in this study with AR showed a moderate correlation between calculated affinity scores and experimental pKi, this value is similar to that obtained for other docking studies.69-70 Besides, AutoDock Vina
has been reported as the best performing single method in predicting high affinity ligands from a database of known ligands and decoys.69 Moreover, the pKi values calculated
from the docking affinity scores, obtained for the DDT and its derivatives, exhibited moderate correlation with the experimental pKi values reported in the literature (Table 4, Figure 8). On the other hand, mapping of the surface-binding and binding efficiency indices showed that DDT derivatives are located, in order of affinity, with approximately the same slope on the LEIs graph (Figure 9). The slope of the plot nBEI (equation 3) vs.
NSEI (equation 2) is equal to the number of polar atoms so the lines seen in these graphs are formed by compounds of similar polarity, and the upper right quadrant corresponds to more efficient ligands.37p,p’-DDE, the DDT derivative
with the highest docking affinity value, also was one of the most efficient ligands for AR (Figure 9).
In short, these results suggest a potential association between proteins belonging to the insulin pathway involved in diabetes, and compounds related to DDT, in agreement with studies reporting a link between exposure to organochlorine compounds and blood glucose regulation/diabetes.17,18
Although the biochemical mechanisms underlying relationship between proteins related to diabetes and these compounds are still uncertain, the prevalence of diabetes in people exposed to DDT could have a link to the fact that several DDT and derived compounds might interact with some key proteins in the diabetes pathway.
Conclusions
DDT and some of its derivatives present high in silico affinity for several proteins involved in the signal
transduction pathway activated by insulin. Although the biochemical significance of these finding are still unknown, it is clear that these pesticides have the potential to interfere with molecular targets for which the alteration of their signaling processes, could eventually be translated into a risk for developing metabolic diseases, including diabetes.
Supplementary Information
Supplementary data are available free of charge at http://jbcs.sbq.org.br as PDF file.
Acknowledgements
The authors wish to thank Colciencias, Bogotá (Colombia). Grant. 110745921616.
References
1. Eggen, T.; Majcherczyk, A.; Chemosphere 2006, 62, 1116. 2. Rylander, C.; Lund, E.; Frøyland, L.; Sandanger, T. M.; Environ.
Int. 2012, 43, 13.
3. Rylander, L.; Björkdahl, C. M.; Axmon, A.; Giwercman, A.; Jönsson, B. A.; Lindh, C.; Rignell-Hydbom, A.; Chemosphere 2012, 88, 828.
4. Dugravot, S.; Grolleau, F.; Macherel, D.; Rochetaing, A.; Hue, B.; Stankiewicz, M.; Huignard, J.; Lapied, B.; J. Neurophysiol. 2003, 90, 259.
5. Gautam, S. K.; Suresh, S.; J. Colloid Interface Sci. 2006, 304, 144.
6. Harte, J.; Holdren, C.; Schneider, R.; Shirley, C.; Toxics A to Z: A Guide to Everyday Pollution Hazards, 1st ed.;University of California Press: Berkeley, USA, 1991.
7. Al-Saleh, I.; Al-Doush, I.; Alsabbaheen, A.; Mohamed, G. E. D.; Rabbah, A.; Sci. Total Environ. 2012, 416, 62.
8. Arrebola, J. P.; Mutch, E.; Rivero, M.; Choque, A.; Silvestre, S.; Olea, N.; Ocaña-Riola, R.; Mercado, L. A.; Environ. Int. 2012, 38, 54.
9. Van Praet, N.; Covaci, A.; Teuchies, J.; De Bruyn, L.; Van Gossum, H.; Stoks, R.; Bervoets, L.; Sci. Total Environ. 2012, 423, 162.
10. Gerić, M.; Ceraj-Cerić, N.; Gajski, G.; Vasilić, Ž.; Capuder, Ž.; Garaj-Vrhovac, V.; Chemosphere 2012, 87, 1288.
11. Channa, K.; Röllin, H. B.; Nøs,t T. H.; Odland, J. Ø.; Sandanger, T. M.; Sci. Total Environ. 2012, 429, 183.
12. Turusov, V.; Rakitsky, V.; Tomatis, L.; Environ. Health Perspect. 2002, 110, 125.
13. http://www.epa.gov/opptintr/aegl/pubs/priority_2.htm accessed in February 2013.
14. Longnecker, M. P.; Rogan, W. J.; Lucier, G.; Annu Rev. Public Health 1997, 18, 211.
15. Cocco, P.; Blair, A.; Congia, P.; Saba, G.; Ecca, A. R.; Palmas, C.; Ann. N.Y. Acad. Sci. 1997, 837, 246.
16. Rignell-Hydbom, A.; Elfving, M.; Ivarsson, S. A.; Lindh, C.; Jönsson, B. A. G.; Olofsson, P.; Rylander, L.; PLoS One 2010, 5, e11281.
17. Everett, C. J.; Frithsen, I. L.; Diaz, V. A.; Koopman, R. J.; Simpson Jr., W. M.; Mainous, A. G.; Environ. Res. 2007, 103, 413.
18. Lee, D.-H.; Lee, I.-K.; Song, K.; Steffes, M.; Toscano, W.; Baker, B. A.; Jacobs, D. R.; Diabetes Care 2006, 29, 1638.
20. Turyk, M.; Anderson, H.; Knobeloch, L.; Imm, P.; Persky, V.; Environ. Health Perspect. 2009, 117, 1076.
21. Enan, E.; Matsumura, F.; J. Biochem. Toxicol. 1994, 9, 97. 22. http://www.ncbi.nlm.nih.gov/pubmed accessed in November
2012.
23. Hoffmann, R.; Valencia, A.; Nat. Genet. 2004, 36, 664. 24. http://alibaba.informatik.hu-berlin.de/ accessed in November
2012.
25. Chen, H.; Sharp, B.; BMC Bioinformatics 2004, 5, 147. 26. Sarsam, S. W.; Nutt, D.R.; Strohfeldt, K.; Watson, K. A.;
Metallomics 2011, 3, 152.
27. Maldonado-Rojas, W.; Olivero-Verbel, J.; Ortega-Zuñiga, C.; J. Braz. Chem. Soc 2011, 22, 2250.
28. Sanner, M. F.; J. Mol. Graphs Modell. 1999, 17, 57.
29. Lim, S. V.; Rahman, M. B.; Tejo, B.; BMC Bioinformatics 2011, 12, S24.
30. Frisch, M. J.; Trucks, G. W.; Schlegel, H. B.; Scuseria, G. E.; Robb, M. A.; Cheeseman, J. R.; Montgomery Jr., J. A.,; T. V.; Kudin, K. N.; Burant, J. C.; Millam, J. M.; Iyengar, S. S.; Tomasi, J.; Barone, V.; Mennucci, B.; Cossi, M.; Scalmani, G.; Rega, N.; Petersson, G. A.; Nakatsuji, H.; Hada, M.; Ehara, M.; Toyota, K.; Fukuda, R.; Hasegawa, J.; Ishida, M.; Nakajima, T.; Honda, Y.; Kitao, O.; Nakai, H.; Klene, M.; Li, X.; Knox, J. E.; Hratchian, H. P.; Cross, J. B.; Adamo, C.; Jaramillo, J.; Gomperts, R.; Stratmann, R. E.; Yazyev, O.; Austin, A. J.; Cammi, R.; Pomelli, C.; Ochterski, J. W.; Ayala, P. Y.; Morokuma, K.; Voth, G. A.; Salvador, P.; Dannenberg, J. J.; Zakrzewski, G.; Dapprich, S.; Daniels, A. D.; Strain, M. C.; Farkas, O.; Malick, D. K.; Rabuck, A. D.; Raghavachari, K.; Foresman, J. B.; Ortiz, J. V.; Cui, Q.; Baboul, A. G.; Clifford, S.; Cioslowski, J.; Stefanov, B. B.; Liu, G.; Liashenko, A.; Piskorz, P.; Komaromi, I.; Martin, R. L.; Fox, D. J.; Keith, T.; Al-Laham, M. A.; Peng, C. Y.; Nanayakkara, A.; Challacombe, M.; Gill, P. M. W.; Johnson, B.; Chen, W.; Wong, M. W.; Gonzalez, C.; Pople, J. A.; Gaussian 03; Gaussian Inc., Pittsburgh, PA, USA, 2003.
31. Guha, R.; Howard, M. T.; Hutchison, G. R.; Murray-Rust, P.; Rzepa, H.; Steinbeck, C.; Wegner, J.; Willighagen, E. L.; J. Chem. Inf. Model. 2006, 46, 991.
32. Trott, O.; Olson, A. J.; J. Comput. Chem. 2010, 31, 455. 33. Singh, K. P.; Malik, A.; Mohan, D.; Sinha, S.; Water Res. 2004,
38, 3980.
34. Wolber, G.; Langer, T.; J. Chem. Inf. Model. 2004, 45, 160. 35. Durdagi, S.; Duff, H. J.; Noskov, S. Y.; J. Chem. Inf. Model.
2011, 51, 463.
36. Ai, N; DeLisle, R. K.; Yu, S. J.; Welsh, W. J.; Chem. Res. Toxicol. 2003, 16, 1652.
37. Abad-Zapatero, C.; Perišić, O.; Wass, J.; Bento, A. P.; Overington, J.; Al-Lazikani, B.; Johnson, M. E.; Drug Discovery Today 2010, 15, 804.
38. Abad-Zapatero, C.; Expert Opin. Drug Discovery2007, 2, 469.
39. http://www.cellsignal.com/reference/pathway/Insulin_ Receptor.html accessed in November 2012.
40. Gupte, A. A.; Bomhoff, G. L.; Geiger, P. C.; J. Appl. Physiol. 2008, 105, 839.
41. Hirotani, S.; Zhai, P.; Tomita, H.; Galeotti, J.; Marquez, J. P.; Gao, S.; Hong, C.; Yatani, A.; Avila, J.; Sadoshima, J.; Circ. Res. 2007, 101, 1164.
42. Wu, M.; Katta, A.; Gadde, M. K.; Liu, H.; Kakarla, S. K.; Fannin, J.; Paturi, S.; Arvapalli, R. K.; Rice, K. M.; Wang, Y.; Blough, E. R.; PLoS One 2009, 4, e6430.
43. Niedzwiecka, A.; Marcotrigiano, J.; Stepinski, J.; Jankowska-Anyszka, M.; Wyslouch-Cieszynska, A.; Dadlez, M.; Gingras, A.-C.; Mak, P.; Darzynkiewicz, E.; Sonenberg, N.; Burley, S. K.; Stolarski, R.; J. Mol. Biol. 2002, 319, 615.
44. von der Haar, T.; Gross, J. D.; Wagner, G.; McCarthy, J. E. G.; Nat. Struct. Mol. Biol. 2004, 11, 503.
45. Yamakawa, T.; Tanaka, S.-I.; Numaguchi, K.; Yamakawa, Y.; Motley, E. D.; Ichihara, S.; Inagami, T.; Hypertension 2000, 35, 313.
46. Kimball, S. R.; Jefferson, L. S.; Fadden, P.; Haystead, T. A.; Lawrence, J. C.; Am. J. Physiol. Cell. Ph. 1996, 270, C705. 47. Skalhegg, B. S.; Tasken, K.; Front. Biosci. 2000, 5, D678. 48. Matsumoto, T.; Wakabayashi, K.; Kobayashi, T.; Kamata, K.;
Am. J. Physiol Heart. Circ. Physiol. 2004, 287, H1064. 49. Magnarelli, G.; Souza, M. S.; D’Angelo, A. M. P.; J. Biochem.
Mol. Toxic. 2009, 23, 185.
50. Mehats, C.; Andersen, C. B.; Filopanti, M.; Jin, S. L. C.; Conti, M.; Trends Endocrinol. Metab. 2002, 13, 29.
51. Conti, M.; J. Mol. Endocrinol. 2000, 14, 1317.
52. Ghosh, R.; Sawant, O.; Ganpathy, P.; Pitre, S.; Kadam, V. J.; Int. J. PharmTech. Res. 2009, 1, 1148.
53. Sprague, R. S.; Stephenson, A. H.; Bowles, E. A.; Diabetes 2006, 55, 3588.
54. Cantin, L.-D.; Magnuson, S.; Gunn, D.; Barucci, N.; Breuhaus, M.; Bullock, W. H.; Burke, J.; Claus, T. H.; Daly, M.; DeCarr, L.; Gore-Willse, A.; Hoover-Litty, H.; Kumarasinghe, E. S.; Li, Y.; Liang, S. X.; Livingston, J. N.; Lowinger, T.; MacDougall, M.; Ogutu, H. O.; Olague, A.; Ott-Morgan, R.; Schoenleber, R. W.; Tersteegen, A.; Wickens, P.; Zhang, Z.; Zhu, J.; Zhu, L.; Sweet, L. J.; Bioorg. Med. Chem. Lett. 2007, 17, 2869.
55. Minokoshi, Y.; Kahn, B. B.; Biochem. Soc. Trans. 2003, 31, 196. 56. Goldstein, B. J.; Scalia, R.; J. Clin. Endocrinol. Metab. 2004,
89, 2563.
57. Cool, B.; Zinker, B.; Chiou, W.; Kifle, L.; Cao, N.; Perham, M.; Dickinson, R.; Adler, A.; Gagne, G.; Iyengar, R.; Zhao, G.; Marsh, K.; Kym, P.; Jung, P.; Camp, H. S.; Frevert, E.; Cell Metab. 2006, 3, 403.
58. Embi, N.; Rylatt, D. B.; Cohen, P.; Eur. J. Biochem. 1980, 107, 519.
60. Patel, S.; Doble, B. W.; MacAulay, K.; Sinclair, E. M.; Drucker, D. J.; Woodgett, J. R.; Mol. Cell. Biol. 2008, 28, 6314. 61. Montanari, D.; Yin, H.; Dobrzynski, E.; Agata, J.; Yoshida, H.;
Chao, J.; Chao, L.; Diabetes 2005, 54, 1573.
62. Wang, Y.; Feng, W.; Xue, W.; Tan, Y.; Hein, D. W.; Li, X.-K.; Cai, L.; Diabetes 2009, 58, 1391.
63. Cantley, L. C.; Science 2002, 296, 1655.
64. Marková, I.; Zídek, V.; Musilová, A.; Šimáková, M.; Mlejnek, P.; Kazdová, L.; Pravenec, M.; Physiol. Res. 2010, 59, 509. 65. Kim, J. K.; Fillmore, J. J.; Sunshine, M. J.; Albrecht, B.;
Higashimori, T.; Kim, D-W.; Liu, Z-X.; Soos, T. J.; Cline, G. W.; O’Brien, W. R.; Littman, D. R.; Shulman, G. I.; J. Clin. Invest. 2004, 114, 823.
66. Sun, L. P.; Ma, X. L.; Liu, H. X.; Wang, Y. S.; Li, X. F.; Genet. Mol. Res. 2010, 9, 1518.
67. Kubo, M.; Hanada, T.; Yoshimura, A.; Nat. Immunol. 2003, 4, 1169.
68. Lang, F.; Görlach, A.; Vallon, V.; Expert Opin. Ther. Tar. 2009, 13, 1303.
69. Andreas, K.; Eur. J. Med. Chem. 2011, 46, 4661.
70. Maldonado-Rojas, W.; Olivero-Verbel, J.; J. Mol. Graphics Modell. 2011, 30, 157.
Submitted: August 21, 2012