Nota Técnica
*e-mail: [email protected]
CERTIFIED REFERENCE MATERIAL TO WATER CONTENT DETERMINATION IN BIOETHANOL FUEL
Janaína M. Rodrigues*, Evelyn F. Guimarães, Marcus V. B. Sousa, Viviane F. Silva, Isabel C. S. Fraga, Vanderléa Souza e Valnei S. Cunha
Divisão de Metrologia Química, Diretoria de Metrologia Científica e Industrial, Instituto Nacional de Metrologia, Qualidade e Tecnologia, Av. Nossa Sra. das Graças, 50, Prédio 6, 25250-020 Xerém - Duque de Caxias – RJ, Brasil
Recebido em 2/6/11; aceito em 8/12/11; publicado na web em 23/3/12
Bioethanol is a strategic biofuel in Brazil. Thus, a strong metrological basis for its measurements is required to ensure the quality and promote its exportation. Recently, Inmetro certified a reference material for water content in bioethanol. This paper presents the results of these studies. The characterization, homogeneity, short-term stability and long-term stability uncertainty contributions values were 0.00500, 0.0166, 0.0355 and 0.0391 mg g−1, respectively. The certificated value for water content of bioethanol fuel was
(3.65 ± 0.11) mg g−1. This CRM is the first and up to now the unique in the world.
Keywords: bioethanol fuel; water content; certified reference material.
INTRODUCTION
Over the last decades, Brazil has developed a strong tradition in the use of bioethanol as fuel to supply its fleet of vehicles (AEHC) and as an oxygenated additive in gasoline (AEAC). In order to sup-port the internal demand a number of distilleries were installed with sufficient capacity to satisfy the consumer market and to export part of the production. In the 2010/2011 harvest, Brazilian bioethanol production amounted to 7.428.260 m3 of anhydrous bioethanol fuel
(AEAC) and 18.352.144 m3 of hydrated bioethanol fuel (AEHC), both
produced from sugarcane. In 2010, 1524336 ton (≅ 1928026 m3) of
AEAC were exported.1 The exported AEAC is used in several other
countries as oxygenated additive to gasoline as a substitute for the MTBE (methyl terc-butyl ether), which is carcinogenic and has therefore been banned in several countries, including in Brazil since 1991. The use of AEAC also reduces the environmental impact caused by burning gasoline, because bioethanol, besides being renewable, comes from plants (sugarcane, potatoes, grains, etc.) that can reabsorb the CO2 liberated in burns of the fuel.
2,3
However, one of the biggest problems associated with AEAC is its high hygroscopic potential. Mixtures involving AEAC and gasoline are somewhat less hygroscopic, with a tendency to absorb water which is dependent on the ethanol content (the lower the ethanol content the lower the tendency to absorb water), on the temperature of the mixture, and on the content of aromatic substances in the gasoline. In adverse circumstances, such as very low temperatures combined with low ethanol content, a separation of the gasoline and water into two phases can occur either in the stockpiling tanks or in vehicles fuel tanks; this could cause serious operational problems in the parts involved.4 This situation has been generating much interest on the
part of international community. In 2007, Brazil, the United States and the European Union established a task force with the objective to harmonize international specifications for the comparison and acceptance of biofuels. As the result of this task force a document was elaborated entitled “White Paper on Internationally Compatible Biofuel Standards”,4 in which the parameter water content presented
a significant difference among the three sets of standards established for the international trade of anhydrous ethanol. At the time of wri-ting, the European Union only adds a volume fraction of about 5%
of anhydrous bioethanol to gasoline and has established a maximum limit of 0.24% for the volume fraction of water in the anhydrous bioethanol. The United States and Brazil add volume fractions of, about 5.7-10 and 20-25%, respectively, of anhydrous bioethanol to the gasoline, and are therefore less susceptible to small modifications in the water content of the bioethanol. The United States allows a maxi-mum volume fraction of 1.0% of water in the anhydrous bioethanol. In Brazil, no maximum limit has been set in the legislation for the water content in AEAC, but the possibility of adopting a maximum limit of 0.5% has been studied.4
In this context it is essential that the determination of the water content in bioethanol fuel be accomplished with traceability to the international system of units (SI) and universal comparability. The use of certified reference materials (CRMs) can provide the reliability nee-ded for this measurement. Considering that in chemical metrology the direct traceability to SI it is not possible, since the mol is not realizable the use of CRM is the way to achieve this traceability. By definition a CRM is a reference material characterized by a metrologically valid procedure for one or more specified properties, accompanied by a certificate that provides the value of the specified property, its associated uncertainty, and a statement of metrological traceability.5
The work described in this paper provides an important basis for other projects concerning the certification of reference materials for bioethanol. It is important to highlight that this CRM is part of a study developed in ethanol area since 2003 that initially involved the forensic application of ethanol and evolved to the bioenergy area.6,7
The development of a reference material (RM) is based on guides that define the criteria for its certification. The ISO Guide 35 specifies that the process of certification of a RM requires the establishment of appropriate methodology for the measurement process, and a careful study of all the uncertainty components affecting the certified values. Among these uncertainty components are the characterization, the ho-mogeneity, the stability under transport (short-term) and the stability under storage (long-term) of the candidate CRM. Estimation of these uncertainties is accomplished through studies that are indispensable for the production and certification of a RM.8
A homogeneity study is necessary in the certification of a batch of a RM to demonstrate that individual units within the lot are suffi-ciently homogeneous among themselves.8 The homogeneity should
be evaluated among the different ampoules (units) of the RM and, when possible, also within a single ampoule. The ISO Guide 35 shows examples of the evaluation of the homogeneity of a RM using analysis of variance (ANOVA).8,10 The homogeneity study cannot and must
not be separated from other parts of the certification project (such as the stability studies and characterization measurements), and the ac-curacy of the measurements in the homogeneity study have important implications on the combined standard uncertainty of the CRM.11
The stability study aims to determine the degree of instability of the CRM after preparation, or to confirm the stability of the material with respect to one or more property values and it is crucial in the process of certifying a reference material.12
This present paper investigates the water content parameter for bioethanol fuel (AEAC) in order to certify a reference material for quality control. The studies of homogeneity and stability under transport and storage for this process of certification were done. The shelf-life of the candidate CRM was determined by monitoring its stability as a function of time. Karl Fischer coulometric titration was used to measure the water content. Up to now this CRM is the first and the unique for water content in bioethanol in the world. EXPERIMENTAL
The samples of AEAC from sugar cane (approximately 99.6% ethanol content) were provided from a Brazilian producer in a con-tainer of 50 L. The bioethanol samples were inserted in amber glass ampoules of 20 mL and sealed with flame. The total number of the samples in this batch was approximately 2000 ampoules. These am-poules were identified and labeled in the same increased sequence of the bottling process.
The analytical technique used to measure the water content was Karl Fischer coulometric titration (KF Coulometer (Metrohm) - 831 model)13 with the Hydranal coulomat AG solution as reagent; a current
generator electrode of 400 mA and a platinum indicator electrode. The tension range applied was from 50 to 70 mV. The titration was started after the stabilization of the equipment with a drift of 20 µg/min on 120 s and finished when the final drift reached the relative value of ± 5 µg/min compared with the initial drift. The titration curve was done with the measurement of the points each 2 s of the analysis. The samples were transferred into the flask, the aliquots were injected in the equipment and the determinations were done in triplicate.
The samples were taken from the ampoules with a syringe, quickly weighed (sample + syringe), and then injected into the Karl Fischer coulometric titrator. The repeatability of the method was 10% RSD and therefore unsatisfactory, so, optimizations were performed in the method. Change settings as electrodes (with or without diaphragm), the dynamic range and the sample mass were done. The generator electrode was used without diaphragm, the dynamic range was set between 50 and 80 mV and sample mass of 100 mg yielding an RSD ≤ 1%, now satisfactory. The analytical balance (Mettler Toledo, XS 205) had a resolution of 0.01 mg and each weighting process was accomplished quickly to avoid the absorption of water by the sample. One solution of 0.5% of water in ethanol was used as control.
The characterization study shall comply with the requirements of ISO Guide 35 and ISO/IEC 17025 for testing, calibration and related activities. Ten randomly selected samples of the batch were analyzed, each one being measured in triplicate. There are several technically valid approaches for characterizing a reference material. However, for many analytes which are certified, no primary method
is available. In this case, it was used only one independent method, Karl Fischer Coulometric Titration. This method has been currently used since 2005 in order to produce ethanol in water CRM (forensic levels of ethanol in water).9,10
For the evaluation of the homogeneity, ten representative samples of the batch were analyzed under repeatability conditions, each one being measured in triplicate. At the beginning and at the end of each analysis series, the control solution was measured. The samples were analyzed in random order as described in ISO Guide 5725-Part 2.14
The results were analyzed by variance ANOVA (one-way layout) to verify the homogeneity.
The method of isochronous design was used to evaluate the short--term stability.8 Five ampoules were used for this study. One of them
was maintained at the reference temperature of T = (20.0 ± 0.3) °C during the whole time of the study (4 weeks). Four ampoules were put in a stove at different times and kept at T = (50.0 ± 0.3) °C. At the end of the period, the five ampoules were analyzed on the same day, each one being measured in triplicate.
To evaluate the long-term stability study, the classical method was used.8 This study was carried out over a period of 55 weeks, and
involved a group of 10 ampoules, which were stored at the reference temperature of T = (20.0 ± 0.3) °C and each sample was analyzed in triplicate (more details are given in Table 4). The results indicated that the shelf life of the CRM was 55 weeks.
The uncertainty evaluation of the short-term and long-term stability studies was estimated from linear regression analyses with analysis of variance (ANOVA). Two criteria need to be met in order to determine the stability of the material: a p-level greater than 0.05 and the absolute value of slope (|b|) should be smaller than the product of the Student's t-factor (t0.95; n-2) by the uncertainty associated with the
slope (s(b)), as shown in Equation 1.8
|b| < t0.95;n-2 × s(b) (1)
If these criteria are met the slope is insignificant and as a conse-quence, no instability is observed.
RESULTS AND DISCUSSION
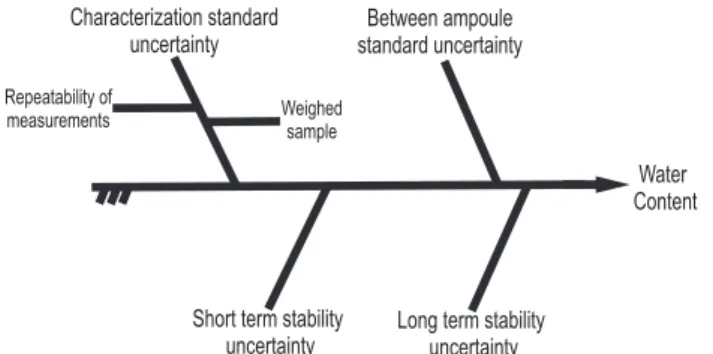
Beyond the declaration of traceability, the uncertainty associated to the property value (the certified value) is what distinguishes a CRM from a common reference material (that it is no certified). The combined uncertainty associated with the property value is estimated by combining the contributions of characterization, homogeneity and stability. The diagram of cause and effect (Figure 1) shows the sources of uncertainty related to this bioethanol CRM.
To follow is demonstrated how each one of these sources were estimated.
Characterization study
Ten randomly selected ampoules (0116, 0264, 1751, 1966, 0651, 1752, 0392, 1872, 0778 and 1556)were used in the characterization study. The calculation of the measurement uncertainty was based on the Guide for the Expression of Measurement Uncertainty – ISO GUM15 and the EURACHEM/CITAC.16
Equation 2 shows the mathematical expression, according to the classical method, for the calculation of the combined standard uncertainty inherent to the characterization of AEAC - water content parameter. The result of characterization study of water content pa-rameter in bioethanol fuel (AEAC) and its uncertainty was (3.6480 ± 0.0050) mg g−1.
ucharact = wwater content×((uwsample/wmean)
2 + (u
repe/Mmean)
2)1/2 (2)
where: ucharact - uncertainty contribution due to characterization;
wwater content - mass fraction of water content in terms of mass; uwsample
- uncertainty contribution due to weighed sample; urepe -uncertainty
contribution due to repeatability of the measurements; wmean -
ave-rage of the weighed samples; Mmean - average of the measurements
on the samples. Homogeneity study
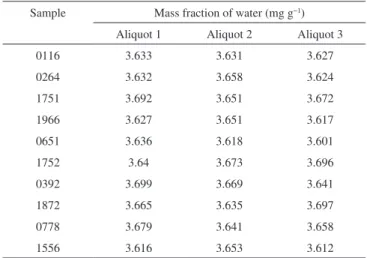
The same ten ampoules (0116, 0264, 1751, 1966, 0651, 1752, 0392, 1872, 0778 and 1556)were used in the homogeneity study. The results obtained are presented in Table 1, according to the order in which the analyses were undertaken.
The variance of these results is presented in Table 2.
According to the ISO Guide 35,8 Equation 3 was used to determine
the contribution of sbb from inhomogeneity to the uncertainty of the
certified value which was 0.0166 mg g−1.
sbb
2 = (MS
between ampoules - MSwithin ampoules)/n0 (3)
where: sbb- between-ampoule standard deviation; MSbetween ampoules-
mean square between the ampoules; MSwithin ampoules -mean square
within the ampoules; n0 - number of replicates.
It is important to point out that ISO Guide 35 uses the term “bb”, that means between-bottles, to make reference to the units of the CRM, which can be, bottles, ampoules (as in this case), flasks, etc. In this paper the term “bottles” was substituted by “ampoules”.
In the case where “Insufficient repeatability of the measurement method”8 the Equation 4 was used to calculate the uncertainty
com-ponent relating to inhomogeneity and the result was 0.007 mg g−1.
ubb = (MSwithin/n)
1/2 × (2/ν
MSwithin)
1/4 (4)
where: ubb -uncertainty between-ampoules; n - number of
replica-tes; MSwithin-mean square within the ampoules; νMSwithin - degrees of
freedom of mean square within the ampoules.
The contribution of uncertainty inherent to homogeneity was calculated using Equation 3 and 4 as described above, and the highest value was chosen. The standard deviation between ampoules (sbb)
was 0.0166 mg g−1 of AEAC, which was adopted as the contribution
of heterogeneity to the uncertainty of the assigned value for one ampoule (0.46%).
Stability studies
The study of the stability of the material under transport condi-tions (short-term stability study), was carried out using the samples 0279, 2039, 0380, 1153 and 1225. Table 3 presents the results obtained for each analysis. In this table, the time t represents the period for which the sample was maintained at the elevated temperature, T = (50.0 ± 0.3) °C.
The short-term stability study at T = (4.0 ± 0.4) °C was not carried out in this batch because this temperature was studied in the previous batch of the same kind of these samples during four weeks and the results obtained in that study showed that them were stable.
Table 4 presents the study of the stability of the material under storage conditions (long-term stability study) that was performed us-ing the samples 372, 2110, 1213, 820, 2006, 687, 1250, 1986, 1660, 404. In this table, t represents the time of storage of the samples at the reference temperature of T = (20.0 ± 0.3) °C.
As shown in Figure 2, this study was done for 55 weeks and the results of water content presented small variations between them in the range of 3.6-3.8 mg g−1. In according with the results presented in
Table 4 and Figure 2 the samples were considered stable for this time. The uncertainties related to transport and storage, investigated by the respectively short-term and long-term studies, were calculated through a spreadsheet that includes the following parameters: the standard deviation of the water content as a function of time s(b); the slope of the curve (b) related to the variation of water content with time and the p-level. Tables 5 and 6 show the statistical results Table 1. Homogeneity study of AEAC: results of mass fraction of water in
AEAC
Sample Mass fraction of water (mg g−1)
Aliquot 1 Aliquot 2 Aliquot 3
0116 3.633 3.631 3.627
0264 3.632 3.658 3.624
1751 3.692 3.651 3.672
1966 3.627 3.651 3.617
0651 3.636 3.618 3.601
1752 3.64 3.673 3.696
0392 3.699 3.669 3.641
1872 3.665 3.635 3.697
0778 3.679 3.641 3.658
1556 3.616 3.653 3.612
Table 2. ANOVA of the samples of AEAC presented in Table 1
Source of variation Sum of Squares
Degrees of Freedom
Mean Square
Between ampoules 0.00012 9 1.3131E-05
Within ampoules 9.65133E-05 20 4.8257E-06
Table 3. Short-term stability study: results of mass fraction of water in AEAC
Sample Mass fraction of water (mg g
−1)
Aliquot 1 Aliquot 2 Aliquot 3 t /weeks
0279 3.547 3.518 3.563 0
2039 3.584 3.576 3.687 1
0380 3.567 3.543 3.590 2
1153 3.645 3.587 3.598 3
study t = 55 weeks and the uncertainty values were 0.0355 and 0.0391 mg g−1, respectively.
uStability = s(b)×t (5)
where: uStability -uncertainty stability; s(b) - standard deviation; t – time.
The combined uncertainty associated with the property value is estimated by combining the contributions of characterization, homo-geneity and stability, following the ISO Guide to the Expression of Uncertainty in Measurement.15
uCRM = (u
2 char + u
2 bb+u
2 its+u
2 sts )
1/2 (6)
where: uCRM - uncertainty associated with the property value of a CRM;
u2
char -characterization standard uncertainty; u
2
bb - between-ampoule
standard uncertainty; u2
its -long-term stability standard uncertainty;
u2
sts - short-term stability standard uncertainty.
The result of uncertainty calculation by using the Equation 6 was 0.0596 mg g−1. The expanded uncertainty (U) of this CRM was
calcu-lated using a coverage factor of k = 2, with 95% of level confidence.
UCRM = k . uCRM (7)
The certificated value for water content of bioethanol fuel was (3.65 ± 0.11) mg g−1.
In order to guarantee the quality of bioethanol and avoid damages as the risk of corrosion to the fuel system and motor in a car, the determination of water content is very important. Depending on the source, the production process and storage conditions bioethanol fuel can contain water and water-soluble contaminants.17
Coulometric water determination is primarily used for the deter-mination of small amounts of water, while the volumetric method is preferred when moisture levels get high. KF Coulometers works in a determination range from 10 µg to 200 mg H2O with a resolution of
0.1 µg H2O. Larger amounts of water require a lot of time and/or may
exceed the water capacity of the KF reagent, which produces inaccu-rate results. In coulometry the electric current is used to geneinaccu-rate the reagent instead of a buret - resulting in a type of electronic buret.18
The Karl Fisher Coulometric titration method used for the characte-rization, homogeneity and stability studies presented repeatable results. The contribution of heterogeneity to the uncertainty of one ampoule (0.46%) is well accepted since it presents an excellent degree of equi-valence among the ampoules. Thus this tested batch was homogeneous with respect to water content. The results obtained in the homogeneity study confirmed that the certification process could progress to the sta-bility study. If the samples had a high degree of heterogeneity, it would not have been feasible to continue with the certification. In addition, it is important to highlight that the accuracy of the measurements in the homogeneity study have relevant contribution on the establishment of the combined standard uncertainty of the candidate reference material.11
The short-term and long term stability studies were performed at temperature of 50.0 and 20.0 °C, respectively. The results of short-term stability study showed that the candidate CRM is stable for a period of 4 weeks (28 days). The uncertainty of the results of short-term stability was considered to be the uncertainty inherent to the transport of the CRM, since during transport a material may be submitted to variable conditions and the range of temperatures studied simulates extreme conditions.
The results of the long-term stability study enabled estimate of shelf-life time. During the shelf-life of the candidate CRM, the contribution of uncertainty of the stability should be demonstrable on its certificate.
Table 4. Long-term stability study: results of mass fraction of water in AEAC
Sample Aliquot 1 Aliquot 2 Aliquot 3 t /weeks
372 3.668 3.687 3.681 0
2110 3.715 3.728 3.728 4
1213 3.797 3.723 3.529 10
820 3.692 3.657 3.673 18
2006 3.631 3.632 3.611 21
687 3.652 3.637 3.602 26
1250 3.761 3.777 3.782 29
1986 3.743 3.737 3.789 35
1660 3.627 3.668 3.618 44
404 3.651 3.65 3.664 55
Table 5. Statistical results obtained by linear regression for the water content measured during the short-term study
Slope (b) p-level (p) uStability* s(b) t0.95.n-2.s(b)
-0.00349 0.6997 0.0355 8.88E-03 0.038
*The uStability is expressed as a mass fraction of water in AEAC.
Table 6. Statistical results obtained by linear regression for the water content measured during the long-term study
Slope (b) p-level (p) uStability* s(b) t0.95.n-2.s(b)
-0.000405 0.5739 0.0391 7.11E-04 0.0014
*The uStability is expressed as a mass fraction of water in AEAC.
Figure 2. Graphic of long-term stability of AEAC for water content parameter
of the studies for the short and long-term stability, respectively. The uncertainty related to the transport and storage for each CRM, the slope of the curve, the p-level, the standard deviation s(b) with respect to time and the product of this with the Student’s t-factor (t0.95; n-2) can
be observed in both tables.
As a consequence by the calculation of using Equation 1, no instability was observed for the short-term and long-term studies.
The satisfactory concordance of the data presented in Table 4 show that no significant difference was detected during the period of this study (55 weeks). For the certification of the candidate AEAC CRM a shelf-life of 55 weeks was therefore considered.
The statistical parameters used in both stability studies were ob-tained from linear regression analyses. These parameters, expressed by the slope (b) and the p-level (p), indicate whether a material is or not stable. In this study, the candidate CRM showed to be stable since these statistical parameters were met: |b| < t0.95;n-2 . s(b) and p > 0.05
which can be observed in Tables 5 and 6, confirming the stability of the water content in the AEAC samples on the period of certification of the CRM, according to ISO Guide 35.
CONCLUSION
This study will contribute to ensuring the quality of the results of measuring water content in AEAC providing metrological trace-ability from the use of CRM. The result of the certification of CRM was (3.65 ± 0.11) mg g−1 which meets the requirements specified
in international standards. The Karl Fischer coulometric titration methodoly was well employed leading to reliable results what can be evidenced by the low uncertainty.
It is important to point out that this CRM was the first produced for measuring water content in anhydrous bioethanol and, until now, it is unique in the world.
REFERENCES
1. http://www.agricultura.gov.br/arq_editor/file/Desenvolvimento_ Sustentavel/Agroenergia/estatisticas/producao/atualizacao_20_01_2011/ Producao_Mensal_Cana_Acucar_Alcool_Brasil.pdf, accessed in December 2011.
2. Santos, A. S.; Giannini, R. G.; Valle, M. L. M.; Revista Economia & Energia 2000, 19, 57.
3. http://ecen.com/eee31/merc_alcool.htm, accessed in December 2011. 4. http://ec.europa.eu/energy/res/biofuels_standards/doc/white_paper_icbs_
final.pdf, accessed in December 2011.
5. ISO Guide 30:1992/Amd 1:2008 Terms and definitions used in connec-tion with reference materials. Amendment 1. Revision of definiconnec-tions for reference material and certified reference material.
6. Caixeiro, J. M. R.; Souza, V.; Silva, R. A. L.; Borges, R. M. H.; Couto, P. R. G.; Braz. Arch. Biol. Technol, 2006, 49, 107.
7. Souza, V.; Rodrigues, J. M.; Bandeira, R. D. C. C.; Valente, L. A. N.; Sousa, M. V. B.; Silva, V. F.; Silva, R. A. L.; Accred. Qual. Assur. 2008,
13, 717.
8. ISO Guide 35:2006 Reference materials – General and statistical principles for certification.
9. ISO Guide 34:2009 General requirements for the competence of reference material producers.
10. Pauwels J.; Lamberty A.; Schimmel, H.; Accred. Qual. Assur. 1998, 3, 51.
11. van der Veen, A. M. H.; Linsinger, T.; Pauwels, J.; Accred. Qual. Assur. 2001, 6, 26.
12. van der Veen, A. M. H.; Linsinger, T.; Lamberty, A.; Pauwels, J.; Accred. Qual. Assur. 2001, 6, 257.
13. Bruttel, P.; Schlink, R.; Monograph Water Determination by Karl
Fischer Titration Metrohm Ion analysis, 2003.
14. ISO Guide 5725-Part 2:1994 Accuracy (trueness and precision) of measurement methods and results.
15. Guide to the Expression of Uncertainty in Measurements ISBN 92-67-10188-9 1st ed., ISO: Geneva, 1993.
16. EURACHEM/CITAC Working Group; Quantifying Uncertainty in
Analytical Measurement, 2nd ed., London, 2000.
17. Spitzer, P.; Fisicaro, P.; Seitz, S.; Champion, R.; Accred. Qual. Assur. 2009, 14, 671.