Rational Valuation Formula (RVF) and Time Variability in Asset Rates
of Return
Alexandre Ripamonti
Postdoctoral student, Department of Management, School of Economics, Business Administration and Accounting, University of São Paulo E-mail: [email protected]
Received on 7.13.2012 - Accepted on 7.26.2012 - 3rd version accepted on 2.27.2013
ABSTRACT
The present study examines the long-term relationship between aggregate price and dividend data and the corresponding mechanism for short-term error correction using the rational valuation formula and time-varying cointegration and based on Muth's (1961) theory of rational expectations and price movements. The study assumes the variability of asset rates of return and tests the null hypotheses of error-correction mechanisms for time-constant cointegration vectors and inequality between fundamental value and share price. The series used were provided by Shiller (2005) and refer to aggregate price and dividend data for the U.S. stock market over the period 1871 to 2010. The data were analyzed using Johansen’s cointegration models with the use of restricted variables resulting from the combination of the varia-bles studied with the Chebyshev time polynomial, as proposed by Bierens and Martins (2010). The results indicate rejection of the null hypothesis of constancy of cointegration vectors as well as the non-rejection of the null hypothesis of inequality between fundamental va-lue and share price. These results are consistent with those obtained by Bierens and Martins (2010) and do not corroborate Muth's (1961) theory of rational expectations. It is therefore concluded that investors have different expectations of return for different future periods. The results suggest the validation of the model used and that there is a possibility of the occurrence of speculative movements supported by rationality or rational speculative bubbles.
1 INTRODUCTION
The extent to which a security is traded in capital markets, its variation over time, the returns obtained from it, and the attempt to predict results have all been studied in finance. The ability to estimate with reaso-nable accuracy how much a specific share is worth or how much its price could fluctuate over a given period has significant empirical implications. In cases of de-veloped financial markets with strong informational efficiency (Fama, 1970, 1991), the price should reflect only the future information present in predictions about the benefits of the respective asset. Moreover, given the possibility of information asymmetry, the importance of models that explain prices and returns is even greater because the need for specificity leads to gathering information on numerous accounting and market variables as well as the cash flow generated by the asset. This information is not simultaneously avai-lable to both managers and investors, thus explaining the existence of numerous models for evaluating the fundamental value of the share that are based on the dividend discounts and cash flows of the company or the shareholder, among other factors (Cuthbertson & Nitzsche, 2004). In the present study, however, only the fundamental value of the share obtained through the dividend discount, commonly known as the rational valuation formula (RVF), is considered.
The RVF is supported by the theory of rational ex-pectations (Muth, 1961) and, in this context, would not be consistent in the presence of asymmetric information in financial markets, as amply demonstrated in the lite-rature (Miller & Modigliani, 1961), particularly because the determination of the dividend policy does not have to be linked to profits obtained by corporations. There-fore, the application of the RVF implies the (possibly in-tuitive) need to adopt dividends and discount rates that
change over time, which results in an operational diffi-culty that may be insurmountable. The present study aims to test whether dividend discount rates vary over time and whether the estimation of such rates through an original method would enable the use of dividends to explain share price.
The abovementioned tests were performed throu-gh econometric techniques of cointegration time series using the Chebyshev time polynomial (Bierens & Mar-tins, 2010).
The discussion of the issue of share valuation has sig-nificant ramifications. Any calculation and use of time-varying discount rates that could cause the fundamental value to be close to the share price might contradict studies that admit the bounded rationality of investors, provide a new way to test informational efficiency, and indicate the importance of accounting information in differences be-tween value and price.
This study was conducted for the aggregate price and dividend data of the U.S. stock market over the period 1871 to 2010. In summary, the results indicated that dis-count rates varied over time and that the fundamental value of the stock did not equate to its price in any period, particularly since 2000. Thus, the results are consistent with Bierens and Martins' (2010) study and inconsistent with Muth's (1961) theory of rational expectations, with important implications regarding periods of greater and lesser inequality.
The study is divided into the following sections: the literature on the main concepts of the study are reviewed; methodology, with specific methodological issues; and results and concluding remarks, in which the main results are presented and compared with the literature and the considerations arising from these re-sults are discussed.
2 THEORETICAL FRAMEWORK
2.1 Rational Expectations.
The Theory of Rational Expectations and Price Move-ment (RE) developed by John F. Muth (1961) is the basis of the present work. The rational expectations hypothesis (REH), which supports the theory, states that information is scarce, the economic system generally does not waste in-formation, expectations are formed based on the structure of the relevant system describing the economy, and public prediction does not substantially influence the operation of the economic system (Muth, 1961). Thus, specifically for the present study, the price of a stock would represent all the information about future benefits arising from it. Price movements should therefore occur only when new infor-mation arrives on the market.
RE has had a profound effect on economic theory, but a strategic foundation is still required (Reny & Perry, 2006). Milgron (1981) analyzed RE and market
expectations (Burkley & Harris, 1997); to compare surveys conducted among housewives and economic analysts (Carroll, 2003); to set insurance premiums (Cummins & Outreville, 1987); and with the assump-tion that investment in shares does not constitute pro-tection against monetary inflation (Danthine & Donal-dson, 1986), among other studies.
2.2 Cointegration.
The long-term relationship between prices and divi-dends can be estimated using the econometric techniques of cointegration. The estimate resulting from this method corresponds to the discount rate applied to dividends to calculate the fundamental value of the share.
Cointegration provides a meaning for the regres-sion of two or more non-stationary variables individu-ally (Wooldridge, 2008), the combination of which may enable the elimination of non-stationarity (Asteriou & Hall, 2007), thus indicating the presence of a vector that transforms stationarity (Engle and Granger, 1987; Jo-hansen, 1991) and eliminates the problem of spurious regressions. The most commonly used measures of coin-tegration (Gregory, Haug, & Lomuto, 2004) are those re-presented by the Augmented Dickley Fuller (ADF) (En-gle and Granger, 1987), Zα (Phillips & Ouliaris, 1990), Trace (TR), maximum eigenvalue or maximum like-lihood (MAX) (Johansen, 1988, 1991), and Reinsel and Ahn (Gregory et al. 2004) tests.
However, it is necessary to use cointegration vector error correction mechanisms (VECM), which allow a part of the imbalance of the relationship between va-riables in one period to be corrected in the next period (Engle and Granger, 1987), so that short- and long-term relationships between variables can be captured by the models (Asteriou & Hall, 2007; Cuthbertson & Nitzsche, 2004, Engle and Granger, 1987) and so that the advan-tages of imbalance correction, elimination of spurious regressions, better selection of specific models, and the prevention of error growth in long-term relationships are incorporated into the cointegration models (Aste-riou & Hall, 2007).
Even so, the error-correction mechanisms assume as a premise cointegration time-invariant vectors (TI VECM) (Bierens & Martins, 2010), which indicate the possibility of not adequately capturing existing structu-ral breaks in long-term time series, resulting in model misspecification (Martins, 2005). For structural breaks to be identified, the vectors must vary over time, ena-bling the study of time-varying cointegration vector error-correction mechanisms (TV VECM) (Bierens & Martins, 2010).
2.3 TV VECM.
As noted in the previous section, the long-term lationship between price and dividends does not re-main constant over time, being subject first to error correction arising from possible residuals and then from the intrinsic variation of estimated discount
ra-tes. Error correction is dealt with by specific models, for which the rate would be constant, while the in-trinsic variation requires specification that includes time-varying vectors.
TV VECM have been the subject of several studies. TV VECM models can include the following features: periodic cointegration, which enables the seasonal variation of the cointegration vector, called periodic cointegration (Boswijk & Franses, 1995); fractional cointegration, in which vectors are fractioned in ortho-gonal cointegrating subspaces (Chen & Hurvich, 2006); intercept subspaces for ascertaining unobservable va-riables (Deschamps, 2003); average, space, and quan-tile for the design of cointegrating subspaces (Granger, 2010); incorporation of the Markov chain (Hall, Psara-dakis, & Sola, 1997); incorporation of canonical coin-tegration regression (Kim & Lee, 2001); incorporation of deviations from the unit root in the test of interest rate spreads (Lanne, 2000); no prior knowledge of the memories of time series in fractionally integrated com-ponents (Marmol & Velasco, 2004); the combination of Markov chain with Monte Carlo simulation (Koop, Le-on-Gonzalez, & Strachan, 2008); filtering and pre-estimation of models with time-varying coefficients (Park & Hahn, 1999); maximum likelihood to estima-te the Capital Asset Pricing Model - CAPM (Engel & Rodrigues, 1989); transience testing with permanent structural breaks (Engle & Smith, 1999); discrete time systems on the errors generated (Phillips, 1991); and a time-variant discount rate for studying cointegration failure (Timmermann, 1995). Surveying cointegration models and ECM (Error Correction Model) demons-trates the explanatory superiority of TV VECM (Chan, Koop, Leon-Gonzalez, & Strachan, 2010). Some stu-dies have used the Chebyshev time polynomial (Boyd, 2000) for the test of unit roots in a time series (Bierens, 1982, 1997), while others have considered the mentio-ned polynomial in MAX, TR, and LR (Likelihood Ra-tio) tests to study TV VECM (Martins, 2005; Bierens & Martins, 2010). Finally, TV VECM has been the object of study using the Generalized Auto Regressive Con-ditional Heteroskedasticity (GARCH) model (Williams & Ioannidis, 2010).
2.4 Chebyshev.
As noted, one way to estimate time-varying discount rates is by applying cointegration techniques in combi-nation with the Chebyshev time polynomial. The poly-nomial allows estimation of the long-term relationship, error correction, and the temporal variability of vec-tors and is also easy to apply. Thus, this technique, first used by Bierens and Martins (2010), will be used in the present study.
cosine coefficients (Boyd, 2000).
Bierens (1982) initially used the CTP in developing misspecification tests and considered it not very refi-ned but having the advantage of computational simpli-city. In another study, Bierens (1997) noted that due to its orthogonality property, the CTP is recommended for solving nonlinear functions and that any time func-tion can be arbitrary and powerfully approximated by a CTP linear function. In this study, ADF applications with time variations were developed, considering the alternative hypothesis that time series are stationary in any time-determining arbitrary function. Martins (2005) used the CTP explicitly in an attempt to capture time in the VECM parameters, making it possible to
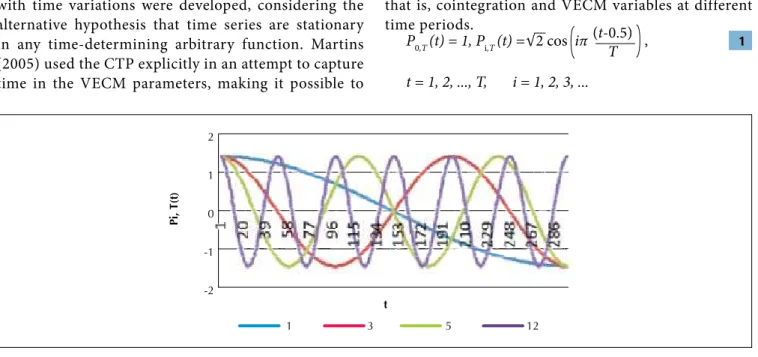
use MAX, TR, and LR directly with critical values of LR developed by simulation for different sample sizes and without resorting to other effects not directly related to time, such as the use of level variables transformed by the respective natural logarithms. Bierens and Martins (2010) perfected some aspects of Martins' (2005) work and validated the use of the CTP in capturing the time variability of cointegrated time-series regression pa-rameters and their respective correction mechanisms, that is, cointegration and VECM variables at different time periods.
t = 1, 2, ..., T, i = 1, 2, 3, ...
P0,T (t) = 1, Pi,T (t) = 2 cos iπ , (t-0.5) 1
T
Figure 1 The Chebyshev time polynomial for T = 298 and i = 1, 3, 5, and 12
2.5 RVF.
The CTP has been used in several manners: to develop algorithms to solve overdetermined systems of linear equa-tions (Abdelmalek, 1976); to solve nonlinear equaequa-tions in one dimension (Berzins & Dew, 1981); to develop an algo-rithm for linear constraints with rank deficient or ill-condi-tioned matrices (Brannigan, 1981); with logarithmic singu-larity in regression coefficient estimates (Chawla, 1967); in the method for the numerical solution of the heat transfer equation (Dew & Scraton, 1972); and in parabolic partial differential equations in a region that permits transforma-tion in quadratic equatransforma-tions or a circular cylinder (Dew & Scraton, 1975).
Furthermore, the CTP has been used in the best appro-ximation for all sets of polynomials and the alternation of error curves and uniqueness (Dunham, 1972); in polyno-mial interpolation with the conversion of expressions in an algebraic nonlinear programming problem (Elanagar & Khamayseh, 1997); and in the development of monomial basis modification algorithms to find CTP zeros and exten-sion to other bases (Grant & Ghiatis, 1983).
Finally, the CTP has been used in tests of misspecifica-tion based on the concurrent validity of the CTP (Hong & White, 1995; Bierens, 1982); to solve time-delay dynamic equations (Hsu & Chou, 2007); to solve infinite triangular arrays of points that constitute the roots of the unit (Iva-nov, Rivlin, & Saff, 1990); to develop a model of smooth partitioning of blocks from a set (Mansour, 2009); using
the barycentric form of the Lagrange interpolation for-mula and in confluent divided differences (Salzer, 1971); to solve numerically linear and nonlinear differential and integral equations (Sweilam & Khader, 2010); to develop an algorithm to solve the overdetermined system of com-plex linear equations (Watson, 1988); and to accelerate the convergence of iterative solutions of simultaneous equations originated while solving partial differential equations (Wrigley, 1963).
Present value and asset pricing models have signi-ficant relevance as study objects in finance. In their seminal studies, Campbell and Shiller (1987a, 1987b) assessed cointegration for stock prices, government bonds, dividends, and earnings per share, where the rate or discount factor δ/1-δ was obtained through the cointegration vector between prices and dividends, where another factor may have been the average. They found that short- and long-term interest rates were cointegrated, with persistent disturbances between pri-ces and stocks and dependence on the discount factor used, and that moving average profits over long periods have explanatory power in the regression against sto-ck prices. Scott (1985) compared estimates using two methods to test propositions that he considered easi-ly adaptable to long-term dividends. In addition, West (1987) developed a test to identify speculative bubbles and ended up rejecting the null hypothesis of the ine-xistence of such bubbles.
2
1
0
-1
-2
t
Pi,
T(t)
West (1988) also supported the quantitative and sta-tistically significant rejection of RVF by analyzing the re-lationship between price and dividend variances. Chow (1989) rejected REH, concluding that RVF data are not explained by RE. DeJong and Whiteman (1991) claimed the impossibility of existence of cointegration between stock prices and dividends. Froot and Obstfeld (1991) sought to detect the induction of persistent deviations in RVF due to intrinsic bubbles in the U.S. market by linking the bubbles to the aggregate dividend and exo-genous macroeconomic variables. Lee (1995) attributed the volatility of stock prices to the sum of permanent and transitory shocks to dividends. Donaldson and Kamstra (1996) demonstrated the inexistence of speculation in the American crisis of 1929 using an autoregressive conditio-nal heteroskedasticity (ARCH) model, an autoregressive
moving average (ARMA) model, and artificial neural ne-tworks. Timmermann (1996) attributed the excess in vo-latility to the phenomenon known as present value with learning or something like RVF with learning. Chow and Liu (1999) argued that the memory of dividend changes might explain the volatility of stock prices.
As observed in the reviewed literature regarding the main concepts of the present study, this is the first appli-cation of the model on data from the U.S. stock market. Although Bierens and Martins (2010) have also applied the model used in this study, the empirical evidence was based on the purchasing power parity of European countries. Campbell and Shiller (1987a, 1987b) highli-ghted the dependence of results on the discount factor used and did not use a methodology in which vectors varied over time.
3 METHODOLOGY
3.1 Modeling.
Assuming constant dividends and discount rates (Cuth-bertson & Nitzsche, 2004), the price of a stock is equal to the present value of its dividend, which implies that the RVF demonstrated in (2), where Pt represents the funda-mental value of the stock; Et is the mathematical expecta-tion operator based on the informaexpecta-tion set Ωt; δi is the cons-tant discount rate; and Dt+i is the dividend per share, which is applicable to various types of investors (Cuthbertson & Nitzsche, 2004).
Substituting (2) and writing it in a more compact nota-tion, we obtain (3), which may be considered non-opera-tional (Cuthbertson & Nitzsche, 2004), where the funda-mental value of the share Pt is the sum of the results of the application of exponentially accumulated discount rates Π δt+i on all future dividends Dt+j.
To circumvent the possible lack of operationalization, hypotheses about investors' dividend and discount rate fo-recasts and/or econometric models that achieve structural changes in time series (Bierens & Martins, 2010) should be tested, as proposed in (4), in which TV VECM is represen-ted without intercepts and trends, with errors following a Gaussian distribution, with Τ being equal to the number of observations, with Π'tYt-1 being the product of imbalances occurring at the level of the lagged variable in the previous period, and with Σ ΓjΔYt-j being the sum of the products of imbalances occurring in the differences in the variable in all periods (Martins, 2005), but that would not allow the direct application of tests.
Pt = Et δi D
t+i 2
Σ
i=1∞t=1 j
Pt = Et δ
Σ
∞ t+i Dt+j Et δt,t+j Dt+j 3j=1
Π
j
i=1
Σ
∞
j=1
p-1 j=1
ΔYt =Π'tYt-1 + Γ
Σ
jΔYt-j + εt , t=1, ..., T 4p-1
j=1
ΔYt = α ξ
Σ
i Pi,T(t) 'Yt-1 + ΓjΔYt-j + εt 5m
I=0
Σ
p-1
j=1
The direct application of the usual cointegration sta-tistics and tests can be resolved in (4) with the CTP (Boyd, 2000) and subsequent transformation into (5), helping to operationalize (3).
In the present study, the hypothesis testing arising from the application of (5) and the operationaliza-tion of (3) are the main objectives for validating the model's ability to capture the time variability of the cointegration vectors and use the corresponding esti-mators for estimating the discount rate, which would enable the determination of the fundamental value of the share.
3.2 Basic Aspects.
The main objective of the present study is to test the rationality of economic agents in the formation of U.S. stock prices by testing the null hypothesis of TI VECM (6) and inequality between price and fundamental value of the share (8). That is, the objective is to investigate whether the price of a share in the U.S. market can be predicted by its dividend, which corresponds to the RVF. However, the RVF will be applied with rates of return that are supposedly unstable or variable at different ti-mes and that are estimated using econometric techni-ques applicable to time series, with the inclusion of the CTP as a variable restricted to the model.
The variables are the aggregate price and dividend data of the corporations used by Shiller (2005) and made available electronically1 for the years 1871 to 2010.
Table 1 Critical values of LRtvc
m 10% 5% 1%
1 4.790 6.275 9.530
2 8.149 10.015 14.173
3 11.181 13.197 18.042
4 14.059 16.400 21.193
5 17.059 19.452 24.749
10 31.247 34.608 40.850
15 45.621 49.515 56.899
25 76.331 81.177 91.638
Source: Bierens and Martins (2010).
H0: TI VECM 6
H1: TV VECM 7
H0: Pt ≠ Et
Σ
∞ δt,t+j Dt+j 8j=1
H1: Pt Et
Σ
∞ δt,t+j Dt+j 9j=1
After testing the null hypothesis of TI VECM and the matrix solution with the estimators obtained in this pro-cess, the present value of the dividend moving average was compared with the share price in each month. In this case, the null hypothesis H0 is the inequality between the price and the fundamental value of the share, as expressed in (8) with the alternative hypothesis H1 being of equality betwe-en them, as in (9).
The important contribution of the studied subject is the attempt to validate the model, which will enable research on TV VECM to be conducted, such as that proposed by Williams and Ioannidis (2010).
3.3 Application of Models.
The ADF, MAX, TR, and LR models and tests were ap-plied using two econometrics software packages. Cointe-gration vector coefficients and error-correction mechanis-ms were obtained using OxMetrics 5:10. The ADF, HQC (Hanna Quin Information Criteria), BIC (Schwarz Baye-sian Information Criteria), MAX, TR, LR, and LRtvc tests were all performed with the software EasyReg Internatio-nal, which was developed by Herman J. Bierens and is free-ly distributed by The Pennsylvania State University2.
The determining factor for the selection of the OxMetrics software was to obtain the cointegration vector coefficients and the error-correction mechanisms. This software uses the multiple time-series equation models of the PC GIVE mo-dule, with the selection of price and dividend variables, with seasonal constants, and with combinations of variables with the CTP as new variables restricted to the model.
The EasyReg International software was selected due the perfect parameterization and adoption of the CTP and of the tests of null hypothesis of TI VECM with critical LRtvc values and because the software was developed by Bierens, one of the authors of studies on the subject (Bierens & Martins, 2010). The statistics were obtained using Johansen's cointegration analysis, which is listed on the menu; multiple equations models, with the selection of price and dividend variables; and indication of the model with intercepts and seasonal dummies with cointe-gration restrictions imposed on the intercept parameter, calcu-lation and choice of the VAR lag, the number of cointegration vectors, and the maximum number of CTP polynomials.
Other models could have been used in testing the hy-pothesis of non-stationarity of the data, with the possibi-lity of generating better results for large samples (Pantula & Fuller, 1993) or even specifically for the CTP (Bierens, 1982, 1997). However, for operational reasons, the models described above were selected.
4 RESULTS
4.1 Descriptive Statistics.
There were no apparent problems in the data. Only the price variable was non-stationary, which does not affect the assumption of cointegration (Granger, 1981). The Schwartz Bayesian information criterion indicated two periods for the best choice of VAR lag, with a cointegration vector be-tween price and dividends, as shown in Tables 2-5.
Table 2 Mean and standard deviation
P D
Mean SD Mean SD
385.79208 384.68848 12.35205 5.698750
Table 3 ADF Test
P D
t adf p-value t adf p-value
-0.5218 0.8900 -2.8883 0.0500 *
* - signiicant at 10%
Table 4 Choice of VAR lags by HQC and BIC information criteria
VAR
HQC BIC
2 2
Table 5 MAX and TR tests for cointegration rank
rank MAX TR
1 2.50 2.50
4.2 TV VECM.
The average discount rate for the Shiller frequency yiel-ded a value of 0.046159 over the month, as shown in Table 6, was positive throughout, and did not exhibit counterin-tuitive values. Figure 2 shows the time of maximum rate, which occurred at approximately 1930.
Table 6 Average discount or return rate
Mean SD Maximum Minimum
0.046159 0.0182803 0.165598 8.3E-05
Figure 2 Discount or return rates
The null hypothesis of constancy of the cointegration vectors was significantly rejected in all polynomials used, from m = 1 to m = 15, as shown in Table 7, with the results being analyzed in relation to Bierens and Martins' (2010) critical LRtvc values. This result is extremely relevant for stu-dies of the U.S. stock market, suggesting a robust validation of Bierens and Martins' (2010) model for the monthly ag-gregated data used herein. The first null hypothesis of the study is therefore rejected.
Table 7 LR statistics for Shiller frequency
m=1 m=2 m=3 m=4 m=5
LR p-value LR p-value LR p-value LR p-value LR p-value
7.7500 0.0208 ** 10.4600 0.0334 ** 11.2200 0.0817 * 15.9500 0.0431 ** 23.3800 0.0094 ***
m=6 m=7 m=8 m=9 m=10
LR p-value LR p-value LR p-value LR p-value LR p-value
25.5800 0.0123 ** 31.9600 0.0041 *** 37.8800 0.0016 *** 46.1300 0.0003 *** 47.8400 0.0005 ***
m=11 m=12 m=13 m=14 m=15
LR p-value LR p-value LR p-value LR p-value LR p-value
48.8600 0.0008 *** 51.9400 0.0008 *** 60.4700 0.0001 *** 70.3900 0.0000 *** 77.9900 0.0000 ***
*** - Signiicant at 1%. ** - Signiicant at 5%. * - Signiicant at 10%.
4.3 RVF.
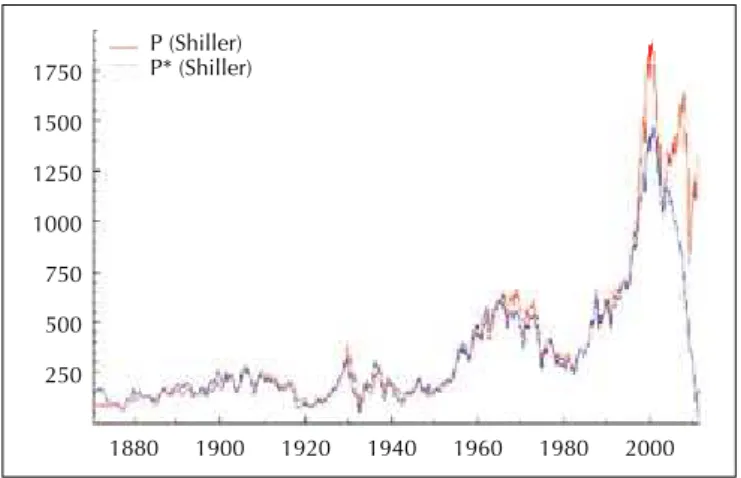
As there were no apparent problems in discount or re-turn rates, the second null hypothesis of the study can now be considered by comparing the fundamental value and price of the share. As shown in Figure 3, the null hypothesis of inequality between fundamental value and price of the share cannot be rejected for the whole study period. There was a significant difference between value and price from the mid-1990s that increased until 2000, and this difference cannot be attributed to the extension of the dividend series used in the calculation of the fundamental value.
Figure 3 Fundamental Value of share (P*) and price (P)
The null hypothesis of inequality between fundamental va-lue and price of the share, which is the second hypothesis of the present study, therefore also cannot be rejected in relation to the Shiller frequency. This is inconsistent with Muth's (1961) RE, which was used as a theoretical reference in this study.
4.4 Comparison.
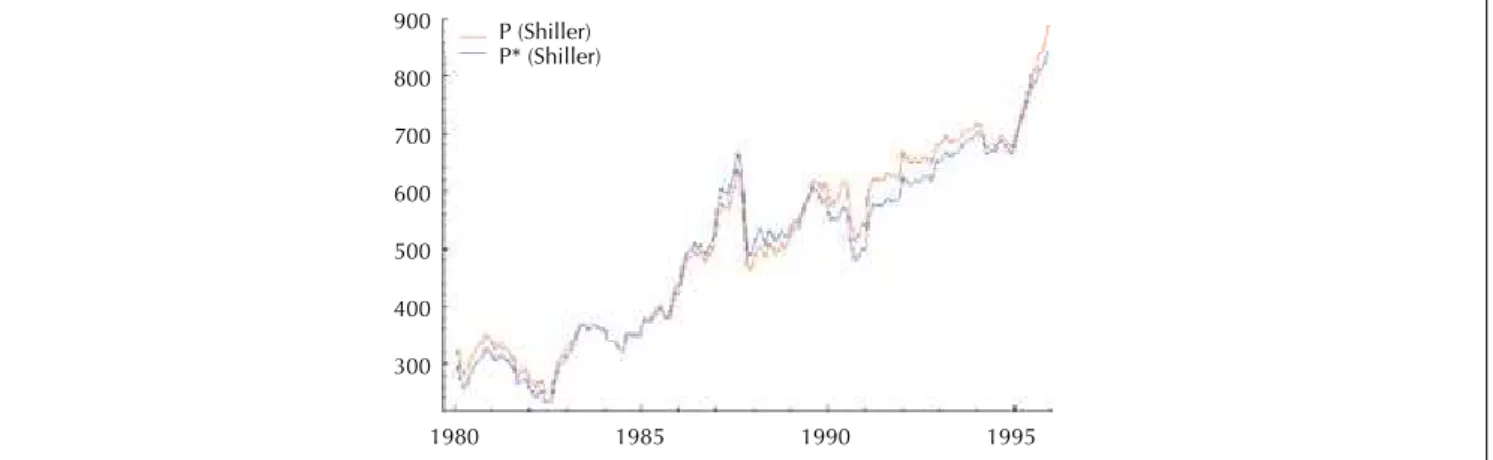
The result shown in Figure 3 is similar to that obtained by Campbell and Shiller (1987a) up to 1980. At approxima-tely 1930, the price exceeds the fundamental value. Howe-ver, in that study, from 1960 to 1980, the fundamental value did not exceed the share price again, unlike the results ob-served herein. From 1980 to 1995, the fundamental value and price of the share have some moments of equality, as shown in Figure 4. Therefore, while the second null hypo-thesis of the present study is not rejected, the results suggest the validation and explanatory power of the model used.
The historical background provided by Granger (2010) demonstrates the trend of TV VECM studies. In Bierens and Martins (2010), the model was used for purchasing power parity. In the present study, the use of MAX, TR, and LR with CTP in level variables allowed the capture of variability of vectors for the monthly price and dividend series, which su-ggests validation of the model and of LRtvc (Bierens & Mar-tins, 2010) and strengthens the abovementioned trend.
0.150
0.125
0.100
0.075
0.050
0.025
1880 1900 1920 1940 1960 1980 2000 Delta Shiller
1750
1500
1250
1000
750
500
250
1880 1900 1920 1940 1960 1980 2000 P (Shiller)
Figure 4 Fundamental Value of share (P*) and price (P) from 1980 to 1995
900
800
700
600
500
400
300
1980
P (Shiller)
P* (Shiller)
1985 1990 1995
5 FINAL CONSIDERATIONS
In summary, the results demonstrate the validation of an innovative and unique model for analysis of time series and the inequality between the fundamental value and the price of a share in the U.S. stock market. This demonstra-tion raises important considerademonstra-tions.
In terms of the model, unexplored research fron-tiers can be overcome, such as the analysis of invest-ment decisions, financing, and distribution of corpora-te results, and the consideration of variables for shares, debt, capital structure, and information asymmetry at the company level. This is possible because the appro-priateness of using level variables, rather than differen-ces or changes, and, in particular, the ability to capture smooth and continuous structural changes in time se-ries has been demonstrated, opening new perspectives for corporate finance research. Specifically, the use of level variables allows models to capture characteristics intrinsic to the variable without being affected by po-tential residuals arising from their variation from one period to another or from their transformation into a natural logarithm, which mistakenly leads non-statio-nary variables into a stationon-statio-nary condition and implies
a significant distortion of the application of cointegra-tion tests.
The rationality testing of speculative bubbles can also be extended, bearing in mind that the inequality of fundamental value and share price may be due to rational decisions that can now be better incorporated into the model used herein. It is possible that the li-mit of vector oscillation has been reached, leaving the hypothesis of rationality of speculative movements to explain such an inequality.
The role of the quality and availability of accounting in-formation is emphasized in this sense because the period of inequality between price and fundamental value coincides with that of increased international accounting harmoniza-tion efforts, with the objective of determining their impact on information asymmetry.
Moreover, regarding the period of apparent equality be-tween fundamental value and share price, it is important to assess whether this result was exclusively due to the model used or a potential misspecification of the models used in previous studies and whether other models using time-va-rying vectors would achieve a similar result.
Abdelmalek, N. (1976). he discrete linear one-sided Chebyshev
approximation. Journal of Applied Mathematics, 18 (1), 361-370.
Asteriou, D., & Hall, S. (2007). Applied econometrics: a modern approach
using Eviews and Microit (Revised ed.). New York: Palgrave Macmillan.
Ball, L., & Croushore, D. (2003). Expectations and the efects of monetary
policy. Journal of Money, Credit and Banking, 35 (4), 473-484.
Berzins, M., & Dew, P. (1981). A generalized Chebyshev method for
non-linear parabolic equations in one space variable. Journal of Numerical
Analysis, 1981 (1), 469-487.
Bierens, H. (2011). Easyreg International. Recuperado em 24 abril, 2011,
de http://econ.la.psu.edu/~hbierens/OLDERVER.HTM. Bierens, H., & Martins, L. (2010). Time-varying cointegration.
Econometric heory, 2010 (1), 1-38.
Bierens, H. J. (1982). Consistent model speciication tests. Journal of
Econometrics, 20 (1), 105-134.
Bierens, H. J. (1997). Testing the unit root with drit hypothesis against nonlinear trend stationarity, with an application to the US price level
and interest rate. Journal of Econometrics, 81 (1), 29-64.
Binder, M., & Pesaran, M. (1998). Decision making in the presence of
heterogeneous information and social interactions. International
Economic Review, 39 (4), 1027-1052.
Bonim, A. N., & Diebold, F. (1997). Bounded rationality and strategic complementarity in a macroeconomic model: policy efects, persistence
and multipliers. he Economic Journal, 107 (444), 1358-1374.
Boswijk, H., & Franses, P. (1995). Periodic cointegration: representation
and inference. he Review of Economics and Statistics, 77 (3), 436-454.
Boyd, J. (2000). Chebyshev and Fourier Spectral Methods. (2nd ed.).
Mineola: Dover Publications.
Brannigan, M. (1981). heory and computation of best strict constrained
Chebyshev approximation of discrete data. Journal of Numerical
Analysis, 1981 (1), 169-184.
Brav, A., & Heaton, J. (2002). Competing theories of inancial anomalies.
he Review of Financial Studies, 15 (2), 575-606.
Bray, M., & Savin, N. (1986). Rational expectations equilibria, learning,
and model speciication. Econometrica, 54 (5), 1129-1160.
Bruno, M., & Fischer, S. (1990). Seigniorage, operating rules, and the high
inlation trap. he Quarterly Journal of Economics, 105 (2), 353-374.
Burkley, G., & Harris, R. (1997). Irrational analysts' expectations as a cause
of excess volatility in stock prices. he Economic Journal, 107 (441),
359-371.
models. he Journal of Political Economy, 95 (5), 1062-1088. Campbell, J., & Shiller, R. (1987b). Stock Prices, earnings, and expected
dividends. he Journal of Finance, 43 (3), 661-676.
Carroll, C. (2003). Macroeconomic expectations of households and
professional forecasters. he Quarterly Journal of Economics, 118 (1),
269-298.
Chan, J., Koop, G., Leon-Gonzalez, R., & Strachan, R. (2010).
Time-varying dimension models. Working Paper, 1-33.
Chawla, M. (1967). A note on the estimation of the coeicients in the Chebyshev series expansion of a function having a logarithmic
singularity. he Computer Journal, 1967 (1), 413-419.
Chen, W., & Hurvich, C. (2006). Semiparametric estimation of fractional
cointegrating subspaces. he Annals of Statistics, 34 (6), 2939-2979.
Chow, G. (1989). Rational versus adaptive expectations in present value
models. he Review of Economics and Statistics, 71 (3), 376-384.
Chow, Y., & Liu, M. (1999). Long swings with memory and stock market
luctuations. he Journal of Financial and Quantitative Analysis, 34
(3), 341-367.
Cummins, J., & Outreville, J. (1987). An international analysis of
underwriting cycles in property-liability insurance. he Journal of
Risk and Insurance, 54 (2), 246-262.
Cuthbertson, K., & Nitzche, D. (2004). Quantitative inancial economics:
stocks, bonds and foreign exchange. (2nd ed.). Chichester: John Wiley & Sons.
Danthine, J.-P., & Donaldson, J. (1986). Inlation and asset prices in an
exchange economy. Econometrica, 54 (3), 585-605.
Dejong, D., & Whiteman, C. (1991). he temporal stability of dividends
and stock prices: evidence from the likelihood function. he
American Economic Review, 81 (3), 600-617.
Deschamps, P. (2003). Time-varying intercepts and equilibrium analysis:
an extension of the dynamic almost ideal demand model. Journal of
Applied Econometrics, 18 (2), 209-236.
Dew, P., & Scraton, R. (1972). An improved method for the solution of the
heat equation in Chebyshev series. Journal of Applied Mathematics, 9
(1), 299-309.
Dew, P., & Scraton, R. (1975). Chebyshev methods for the numerical solution of parabolic partial diferential equations in two and three
space variables. Journal of Applied Mathematics, 16 (1), 121-131.
Donaldson, R., & Kamstra, M. (1996). A new dividend forecasting procedure that rejects bubbles in asset price: the case of 1929's stock
crash. he Review of Financial Studies, 9 (2), 333-383.
Dunham, C. (1972). Chebyshev approximation by A+B* log (1 + CX) II.
Journal of Applied Mathematics, 10 (1), 369-372.
Elanagar, G., & Khamayseh, A. (1997). On the optimal spectral Chebyshev solution of a controlled nonlinear dynamical system.
Journal of Applied Mathematics, 58 (1), 147-157.
Engel, C., & Rodrigues, A. (1989). Tests of international CAPM with
time-varying covariances. Journal of Applied Econometrics, 4 (2),
119-138.
Engle, R., & Granger, C. (1987). Co-Integration and error correction:
representation, estimation, and testing. Econometrica, 55 (2),
251-276.
Engle, R., & Smith, A. (1999). Stochastic permanent breaks. he Review of
Economics and Statistics, 81 (4), 553-574.
Fama, E. F. (1970). Eicient capital markets: a review of theory and
empirical work. he Journal of Finance, 25 (2), 383-417.
Fama, E. F. (1991). Eicient capital markets: II. he Journal of Finance, 46
(5), 1575-1617.
Froot, K., & Obstfeld, M. (1991). Intrinsic bubbles: the case of stock
prices. he American Economic Review, 81 (5), 1189-1214.
Granger, C. (1981). Some properties of time series data and their use in
econometric model speciication. Journal of Econometrics, 16 (1981),
121-130.
Granger, C. (2010). Some thoughts on the development of cointegration.
Journal of Econometrics, 158 (2010), 3-6.
Grant, J., & Ghiatis, A. (1983). Determination of the zeros of a linear
combination of Chebyshev polynomials. Journal of Numerical
Analysis, 1983 (3), 193-206.
Gregory, A., Haug, A., & Lomuto, N. (2004). Mixed signals among tests
for cointegration. Journal of Applied Econometrics, 19 (1), 89-98.
Hall, S., Psaradakis, Z., & Sola, M. (1997). Cointegration and changes
in regime: the japanese consumption function. Journal of Applied
Econometrics, 12 (2), 151-168.
Hong, Y., & White, H. (1995). Consistent speciication testing via
nonparametric series regression. Econometrica, 63 (5), 1133-1159.
Hsu, M., & Chou, J. (2007). Solutions of TS fuzzy model based time-delay
dynamic systems via Chebyshev series approach. Journal of Vibration
and Control, 13 (95), 95-106.
Ivanov, K., Rivlin, T., & Saf, E. (1990). he representation of functions in term of their divided diferences at Chebyshev nodes and roots of
unity. Journal of London Mathematics Society, 2 (42), 309-328.
Johansen, S. (1988). Statistical analysis of cointegration vectors. Journal of
Economics Dynamics and Control, 12 (1), 231-254.
Johansen, S. (1991). Estimation and hypothesis testing of cointegration.
Econometrica, 59 (6), 1551-1580.
Kim, H., & Lee, J. (2001). Quasi-ixed inputs and long-run equilibrium in
production: a cointegration analysis. Journal of Applied Econometrics,
16 (1), 41-57.
Koop, G., Leon-Gonzalez, R., & Strachan, R. (2008). Bayesian inference in
the time varying cointegration model. Working Paper, 1-48.
Lanne, M. (2000). Near unit roots, cointegration, and the term structure
of interest rates. Journal of Applied Econometrics, 15 (5), 513-529.
Lee, B. (1995). he response of stock prices to permanent and temporary
shocks to dividends. Journal of Financial and Quantitative Analisys,
30 (1), 1-22.
Mansour, T. (2009). Smooth partitions and Chebyshev polynomials. Bull.
London Mathematics Society, 41 (2009), 961-970.
Marmol, F., & Velasco, C. (2004). Consistent testing of cointegrating
relationships. Econometrica, 72 (6), 1809-1844.
Martins, L. (2005). Structural changes in nonstationary time series
econometrics: time varying cointegration and modeling catastrophic events. hesis doctor of Philosophy in Economics, he Pennsylvania State University, Philadelphia.
Milgron, P. R. (1981). Rational expectations, information acquisition and
competitive bidding. Econometrica, 49 (4), 921-943.
Miller, M. H., & Modigliani, F. (1961). Dividend policy, growth and
valuation of shares. he Journal of Business, 34 (4), 411-433.
Muth, J. (1961). Rational expectations and the theory of price movements.
Econometrica, 29 (3), 315-335.
Pantula, S. G., & Fuller, W. A. (1993). he large sample distribution of the
roots of the second order autoregressive polynomial. Biometrika, 80
(4), 919-923.
Park, J., & Hahn, S. (1999). Cointegrating regressions with time varying
coeicients. Econometric heory, 15 (1999), 664-703.
Phillips, P. (1991). Error correction and long-run equilibrium in
continuous time. Econometrica, 59 (4), 967-980.
Phillips, P., & Ouliaris, S. (1990). Asymptotic properties of residual based
tests for cointegration. Econometrica, 58 (1), 165-193.
Reny, P., & Perry, M. (2006). Toward a strategic foundation for rational
expectation equilibrium. Econometrica, 74 (5), 1231-1269.
Salzer, H. (1971). Lagrangian interpolation at the Chebyshev points x
n,v = cos (VTT/AZ), V = 0(1)//; some unnoted advantages. he
Computer Journal, 15 (2), 156-159.
Scott, L. (1985). he present value model of stock prices: regression tests
and Monte Carlo results. he Review of Economics and Statistics, 67
(4), 599-605.
Shiller, R. (2005). Irrational exuberance. (2nd ed.). New York: Broadway
books.
Shiller, R. (2005b). Online data. Recuperado em 7 março, 2011, de http://
www.econ.yale.edu/~shiller/data.htm.
Sweilam, N., & Khader, M. (2010). A Chebyshev pseudo-spectral method
for solving fractional-order integro-diferential equations. Anzian
Journal, 2010 (1), 1-12.
Timmermann, A. (1995). Cointegration tests of present value models
with a time-varying discount factor. Journal of Applied Econometrics,
10 (1), 17-31.
Timmermann, A. (1996). Excess volatility and predictability of stock
prices in autoregressive dividend models with learning. he Review of
Economic Studies, 523-557.
Watson, G. (1988). A method for the Chebyshev solution of an
overdetermined system of complex linear equations. Journal of
Numerical Analysis, 1988 (8), 461-471.
West, K. (1987). A speciication test for speculative bubbles. he Quarterly
Journal of Economics, 102 (3), 553-580.
West, K. (1988). Dividend innovations and stock price volatility.
Econometrica, 56 (1), 37-61.
Williams, J., & Ioannidis, C. (2010). Vector error correction models with
time varying second moments. Working Paper, 1-8.
Wooldridge, J. (2008). Introductory econometrics - a modern approach.
(2nd ed.). Stanford: Cengage Learning International. Wrigley, H. (1963). Accelerating the Jacobi method for solving
simultaneous equations by Chebyshev extrapolation when the
eigenvalues of the iteration matrix are complex. he Computer