Comprehensive evaluation on housing market supply & demand
based on principal component analysis: the case of Xi'an, China
Jianping Yang1, Yanwei Zhang2 1
Department of Management, Xi’an University of Architecture Technology Xi’an, Shanxi Province, China
2
Department of Management, Xi’an University of Architecture Technology Xi’an, Shanxi Province, China
Abstract
At present, China's housing prices and structures have been severe distorted, which have been done serious harm on the development of national economy and people's lives, the government has implemented the most strictest macro-control. This paper applies the correlation and principal component analysis on the supply & demand of housing market. Aims to points out clear direction for the implementation of macro-control policies in the future.
Keywords: Macro-control; Correlation (Statistics); Principal Component Analysis; Comprehensive Evaluation; Supply & Demand Coordination Degree; Tourism Real Estate
1 Introduction
In recent years, China's housing market has entered a white-hot stage, the prices and structures of housing are irrational, and the housing market distortions do serious harm to the social and economic development. After 2010, the government has taken the most severe macro-control policies to promote the healthy and orderly development of the housing market. The supply & demand relationship development is the culprit of many problems and most intuitive response to market conditions, studying the current housing market supply & demand is imminent. The purpose of research is to study the supply & demand analysis indicators to provide accurate information on the country's macro-control of intensity and direction in the future.
2 Some Related References Background
Until now, there have been many references studying supply & demand of housing, and correlation and principal component analysis (PCA) have been applied widely in various domain including science, commerce, agriculture, medicine, and industry. In [1], housing supply is affected by construction costs, demand is determined by the renting/buying considerations of the public, adopting three
price indices of the Taiwan housing market, the CCI, the RPI and the HPI, and examines long-term and short-term correlations among the three indices [1]. The reference [2] focuses on the housing demand increase in Belgium. An overview of the housing market is presented wherein several are identified such as rental, private, new-build and secondhand. Forty-three percent of households looking for housing in 2009 bought an existing house, 43 percent rented, 11 percent opted for new self-build, and three percent bought a new house [2]. The reference [3] hypothesizes that the increase in money supply accosted by rapid economic growth leads to strong investment demand in the Taiwanese housing market. When the growth rate of money supply is below the model's estimated threshold value, household number, income, and user cost of housing capital are significant variables. Results suggest that non-linear movement of housing prices is primarily driven by investment demand [3]. The reference [4] discusses briefly the methodology used, the housing situation, the dynamics of the housing sector, and etc. the main parts of the research is to analyze the policies and practices, supply factors and demand factors. Showing the housing policy adopted by the government aims to diversify housing types according to household incomes. And analyzing two supply factors which are land development regulations and ownership, and housing production and ownership, and two demand factors which are housing finance and housing subsidies [4]. The reference [5] aims to solve the current high price's dilemma, according to the effective housing demands, and combining the local real income levels then build up three high, middle and low real estate markets with independent operation, and mutual connection and conversion [5], and etc [6-8].
the input variable, by substituting a principal component for a single variable and 2) by creating an orthogonal set of predictor variables, and thus fulfilling the no colinearity assumption of the linear regression methods. The proposed PCA method should be universally applicable to LUR methods and will expand their economical attractiveness [9]. The reference [10] applies the principal component analysis and parallel analysis to smoothed tetrachoric correlation matrices were investigated in a simulation study. To evaluate the effect of several smoothing algorithms, 360 different types of data sets were simulated [10], and etc [11-12].
3 China's Housing Market Performances
under the Macro-control Background
3.1 A slump in China's housing market
At the beginning of 2011, the country has implemented series of forceful measures, such as purchase limit, credit limit, price limit, and etc. the government used widely of the land, finance, taxation and other means to return to the reasonable prices and structures of housing. According to the concerned statistic data of 2011 shown, real estate enterprises invested 4430.8 billion in the construction of housing, it grown 30.2% than 2010, increasing ratio decreased 2.6%. The sales of commercial housing area and the transactions of second-hand housing area also declined sharply. The commodity housing sales area is 970.3 million square meters, increasing ratio declined 4.4%; second-hand housing transaction area is 93.38million square meters, declined 33.0% than 2010. The boom index of real estate has dropped fall since in June 2011, it has fallen to 99.87 and 98.89 in November and December respectively, which dropped below the boom line 100 for the first time since 2009.
3.2 Real estate industry structure confronted
adjustment
At present, under the background of the draconian control policies and the inflation, the real estate industry is confronted with the adjustment of industrial structure. The real estate industry structure ratio will be transformed from the domination of the housing real estate in the world into the commercial real estate as its core with a collection of the industry chain. Along with the policy changes in recent years, the financing costs, transaction costs and holding costs of the real estate have increased gradually, and the housing real estate investment function has been disappeared step by step, thus housing estate will be gradually transformed into a product against inflation. Along with the Chinese enterprises in the industrial restructuring, consumer consumptive habits transformation,
the reform of financial system and the adjustment of industrial structure, China's commercial real estate development model will be changed from simple property rental into commercial estate as the core with the integration of the industry chain and capital chain.
National implementation of stringent regulation policy aims to adjust market supply & demand, and from the performance of the housing market and the real estate industry we can see that, the implementation of the policy also played a certain role, thus analysis of housing market supply & demand coordination degree seems much more necessary.
4 Housing Market Supply & Demand Analysis:
The Case of Xian
4.1 The selection of Indexes and analysis tools
1) In this paper, the analysis of data processing, correlation, principal component and parameter interval estimation, and the calculation of comprehensive evaluation value, all use the software of Excel 2007 and SPSS Statistics 20.
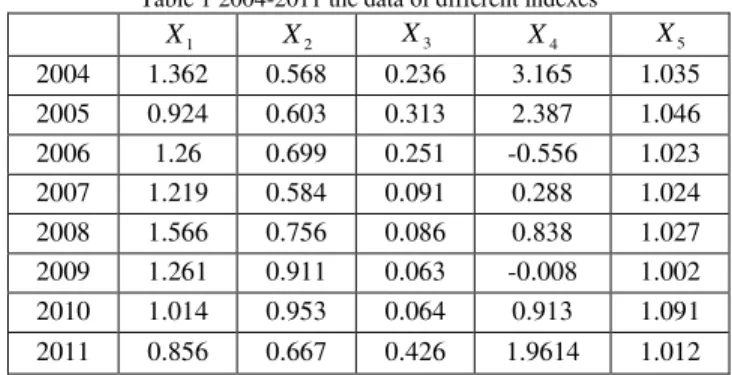
2) According to the related references, there have selected five indexes which can synthetically reflect the housing market supply & demand: housing capital fund / the sales of housing X1, housing pre-sale area / housing area
salesX2, the completed housing area / housing vacancy X3,
housing average price growth rate / urban per capita disposable income growthX4, housing sales price index /
housing sales price indexX5, show as Table 1.
Table 1 2004-2011 the data of different indexes
1
X X2 X3 X4 X5 2004 1.362 0.568 0.236 3.165 1.035 2005 0.924 0.603 0.313 2.387 1.046 2006 1.26 0.699 0.251 -0.556 1.023 2007 1.219 0.584 0.091 0.288 1.024 2008 1.566 0.756 0.086 0.838 1.027 2009 1.261 0.911 0.063 -0.008 1.002 2010 1.014 0.953 0.064 0.913 1.091 2011 0.856 0.667 0.426 1.9614 1.012
Notes: the above data derived from 2003-2012 the statistical year books of Shaanxi Province
4.2 The analysis of index correlation
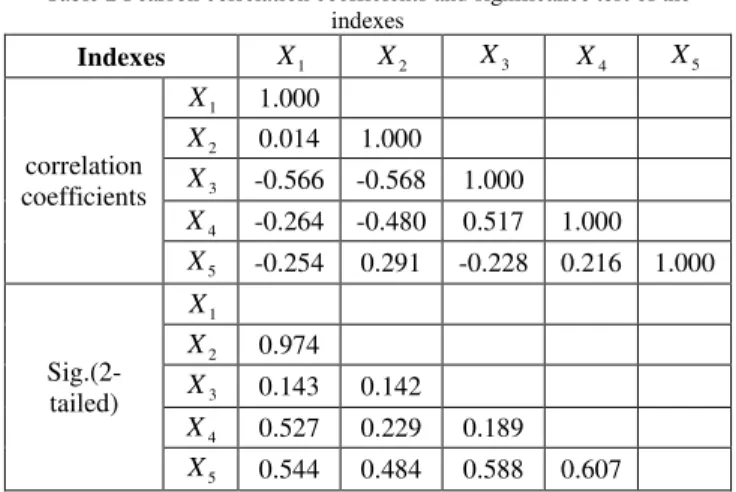
Table 2 Pearson correlation coefficients and significance test of the indexes
Indexes X1 X2 X3 X4 X5
correlation coefficients
1
X 1.000 2
X 0.014 1.000 3
X -0.566 -0.568 1.000 4
X -0.264 -0.480 0.517 1.000 5
X -0.254 0.291 -0.228 0.216 1.000
Sig.(2-tailed) 1 X 2 X 0.974 3
X 0.143 0.142 4
X 0.527 0.229 0.189 5
X 0.544 0.484 0.588 0.607 * *Correlation is significant at the 0.05 level (2-tailed).
According to table 2, it can be known that 1) the significance of the t-test between the correlation coefficient among the five index is significantly greater than 0.05, thus the null hypothesis is accepted, and there is no significant linear correlation among the five index.2) There is a correlation between different index. Results X1 is
negatively correlated with X3 , X4 and X5 ˈ X2 is
negatively correlated with X3andX4, negative correlation
is existed between X3 and X5 ,other are positively
correlated, so that they provide information about the overlap. Therefore, the direct usage of these indexes is difficult to accurately evaluate the housing market supply & demand, require the application of principal component analysis method.
5 Comprehensive Evaluation of Housing
Market Supply & Demand Coordination
Degree Based on Principal Component
Analysis
5.1 The principal component analysis basic model
The principal component analysis method is a multivariate statistical method aims to use the idea of dimension reduction, by researching the inner structure relation of the index system, to transform a lot of indices into a few independent indices which are comprehensive indices contain most information of the original index (80% ~ 85%).
If there are m indicators, the observed value of each indicator is n, so the principal component analysis model is established as follows:
n nm m m m n n n n X a X a X a Z X a X a X a Z X a X a X a Z 2 2 1 1 2 2 22 1 12 2 1 2 21 1 11 1
(1)
In (1), a1i,a2i,ani(i1,2,m)is the characteristic vector of the characteristic value of the covariance matrix of X, and X1, X2,Xnis the standardized variable of X,
aij mn
a a am
a 1ˈ 2ˈ ˈ
i i
ai a
R
ˈR is thecorrelation coefficient matrix,
i is the correspondingcharacteristic value,
a
i is the unit orthogonal vector, and0 2
1
n
.5.2 The process of the principal component analysis
The data in table 1 is analyzed by the principal component analysis method, and then obtained total variance explained, show as Table 3.
Table 3 Total Variance Explained
Component
Eigen-vector of different indexes
1
X X2 X3 X4 X5 1 -0.248 -0.323 0.404 0.335 -0.040
2 -0.422 0.339 -0.050 0.150 0.631
3 0.625 -0.345 -0.332 0.583 0.438
Component
Extraction sums of Squared Loadings Total % of
Variance Cumulative %
1 2.255 45.098 45.098
2 1.396 27.915 73.013
3 0.869 17.376 90.389
The data in table 3 shows that: in the first three indices of cumulative contribution rate of 90.389%, indicating that the first three index reflects the original index mostly, can be substituted for the original five index of the Xi'an housing market supply & demand for comprehensive evaluation, according to the standardization eigenvector, there can get the expressions of the three new comprehensive index:
CI(1)=ˉ0.248X1ˉ0.323X2ˇ0.404X3ˇ0.335X4ˉ
0.040X5 (2)
CI(2)=ˉ0.422X1ˇ0.339X2ˉ0.050X3ˇ0.150X4ˉ
0.631X5 (3)
CI(3)=ˉ0.625X1ˇ0.345X2ˉ0.332X3ˇ0.583X4ˉ
From the above expression can be clearly seen that 1) by the reducing dimension, can make the 5 original interrelated supply & demand indexes into three new independent comprehensive indexes, and retain the information of the original index 2) most of the information of different indexes on CI(x) effect is also different. In the CI(1), X2 and X4 have the greatest impact
on the evaluation value; In CI(2), the impact of X5 and 1
X is the biggest, but the former has positive effect, the
latter produces negative effect; in the CI(3), X1and X4is
the maximum impacts 3) the three new comprehensive index contribution different rates will exercised different influence on CI(x), so there should goes further in the comprehensive evaluation.
5.3 Comprehensive evaluation on the housing market
supply & demand coordination degree
1) The comprehensive evaluation expression
According to the principal component expressions, there can calculate 2004-2011 Xi'an housing market supply & demand comprehensive evaluation value of CI(x); according to the contribution rate and the contribution rate of (Table 3), there can calculate the comprehensive indicator weight K1=0.4989, K2=0.219 3088, K3=0.1922,
respectively, and then establish Xi'an housing market supply & demand coordination degree comprehensive evaluation expression CE:
CE=CI(1)*K1+CI(2)*K2+CI(3)*K3 (5)
2) The comprehensive evaluation grade
According to the parameter interval estimation principle, CE is analyzed by the method of confidence intervals, therefore, Xi'an housing market supply & demand comprehensive evaluation grade can be calculated, show as Table 4.
Table 4 Comprehensive evaluation grade of the housing market supply & demand coordination grade
Grade coordinated Perfect coordinated Well Coordinated
Range 1.293 (0.848,1.293) (-0.041,0.848)
Grade Not well coordinated coordinated Not
Range (-0.485,-0.041) -0.485
3) The comprehensive evaluation results
According to the comprehensive evaluation expression and grade, Xi'an housing market supply & demand
comprehensive evaluation results can be obtained, show as Table 5.
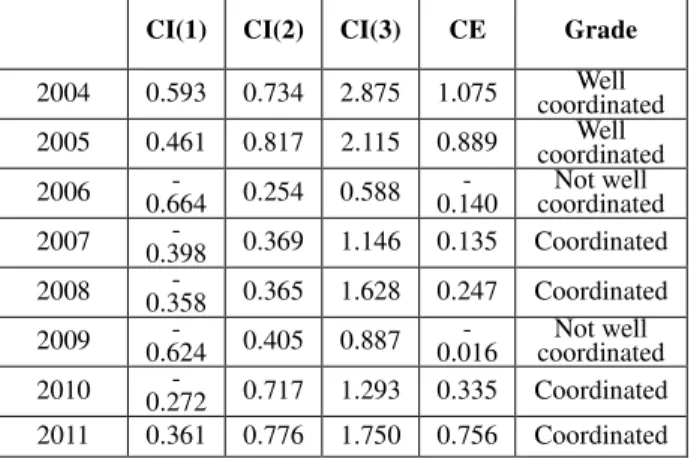
Table 5 the comprehensive index value CI(x) and comprehensive evaluation value CE of the housing market supply & demand
CI(1) CI(2) CI(3) CE Grade
2004 0.593 0.734 2.875 1.075 coordinated Well
2005 0.461 0.817 2.115 0.889 coordinated Well
2006 0.664 - 0.254 0.588 0.140 - coordinated Not well
2007 0.398 - 0.369 1.146 0.135 Coordinated
2008 0.358 - 0.365 1.628 0.247 Coordinated
2009 0.624 - 0.405 0.887 0.016 - coordinated Not well
2010 0.272 - 0.717 1.293 0.335 Coordinated
2011 0.361 0.776 1.750 0.756 Coordinated
From table5 and Figure 1, it can be known: 1) In 2004 and 2005 Xi'an housing market supply & demand coordination grades both are the Well coordinated, 2004 Xi'an housing market supply & demand coordination degree reached 1.075, it decline from 0.889 of 2005 to minimum value -0.140 of 2006 in the 8 years, the grade of coordination degree is down to coordinated from not well coordinated. 2006-2008 supply & demand improved slightly, rising the grade of coordinated. because of the 2008 financial crisis, 20082009 the comprehensive evaluation value decline to -0.016, nearly the minimum value of 2006, return to the grade of not well coordinated; In 2009-2011, because the country introduced a series of incentives, Xi'an housing supply & demand coordination degree high speed increased by 0.772 points; In 2011, owing to the implementation of the most stringent regulatory policies by far, Xi'an housing market supply & demand coordination degree increased by 0.071 comparing 2011 to 2010, and up to the grade of coordinated.2) At present, Xi'an housing market supply & demand is at the grade of coordinated. The implementation of the macro-control policies played a significant effect on curbing the speculative demand, reducing price and adjusting housing structure. Therefore, the government of housing market ironhanded
macro-control can’t relax, and must guide effective demand at the same time.
6 Recommendations
6.1 Focus on the housing market regulation,
meanwhile deepen comprehensive housing policies
Under the market economic system, the housing real estate, like other commodity markets, run under the interaction of the supply & demand mechanism, price mechanism and competition mechanism, but because of the particularity and complexity of the supply & demand, the supply & demand balance of the housing market is a long and difficult task under normal circumstances. So there should give priority to the market adjustment, meanwhile continue to use the visible hand to make up for market failure, to correct market irregularities, by the comprehensive use of economic, legal and requisite administrative means to achieve the equilibrium of supply & demand. There should strengthen the macro-control policies, the banking and credit system, and actively and effectively play the regulatory role of the property tax, to deepen the policy of regulation, in order to curb the speculative demand and guide the effective demand, prompting prices return to reasonable.
6.2 Strengthen the construction of the indemnificatory
housing, establish multifunctional housing supply
system
There should strengthen the government oversight and enforcement, meanwhile improve the laws and regulations for indemnificatory housing. There should accelerate the implementation of the "Twelfth Five-Year Plan" of the indemnificatory housing industry, further enhance the construction of the affordable housing, capped-price housing, public rental housing, low-rent housing as well as the shed housing vigorously. To steadily solve the housing problem of all income groups, such as city employees (mainly college graduates newly participate in the work) as well as the migrant workers' quickly. All of this is in order to establish indemnificatory housing supply system step by step, which is based on protection of basic needs and guidance of rational consumption, is the government provide basic protection mainly and the market meet the multi-level needs mainly.
6.3 Coordinate at all levels of real estate markets,
balance supply & demand
There should establish the monitoring and evaluation system of the land market and perfect the land market information communication mechanism, improve the differentiation of the land supply policy to ensure the land transaction is fair and reasonable moderate, further stabilize market expectations. There should coordinate the development of secondary real estate market, guide he real estate developer to invest reasonably and the buyers consume rationally, and improve the real estate market
information system to make the information transparent, in order to avoid blind investment and consumption. There should promote the reform of state-owned real estate enterprises, improve enterprise and personal credit file and evaluation system, guide the healthy development of the real estate market. We know that China’s large population, poor little rich, so less indemnificatory housing in solving the housing problems of lower-middle class is just a drop in the bucket, it's necessary to promote reasonable housing concept vigorously, encourage low-income and middle-income groups to purchase second-hand and rental housing, and guide the second-hand rental housing market actively, that play the linkage effects of the real estate markets at all levels to promote the equilibrium of supply & demand.
6.4 Conformed and combined with the tourism,
accelerate the sustainable development of tourism
real estate
Tourism real estate is a new convergence industry which is combined tourist industry with real estate industry. A successful tourism real estate projects always have itself cultures, which are not just rely merely on the tourism resources. Therefore, the real estate the real estate developers should find their strength and make the best use of opportunities instead of using housing development ideas on the development of tourism real estate, they need to make innovations and open up different development concept. 1) housing real estate should be transformed from low-end to high-end, from a single housing real estate to the diversification of the tourism real estate, from one-time development to sustainable development, and increase the diversification of the tourist hotels, vigorously develop the service industry, and then strengthen the real estate industry 2) whereby the quality of tourism industry to promote the development of the real estate market, which will be the long-term way of Xi'an development. So there should establish the orderly development of high-end tourism real estate goals, adhere to high standard, high-quality and high-end development principles, to construct a diversified tourism real estate supply system which includes high-star hotel, the hotel property, high-end leisure houses, and so on.
6.5 Accelerate the adjustment of the real estate
industry
structure,
promote
the
housing
industrialization gradually
the medium-end, has the market in the high-end, and has the reputation in the characteristics. There should gradually promote the housing industrialization. First, there should develop a variety of housing standards, and narrow the gap between the standard; Second, there should focus on building energy efficiency, and reduce the construction cost; Third, there should adapt to the needs of the residents, and strengthen the demonstration and driving effect of the government; Fourth, there should take the concept of green and sustainable development, healthy and comfortable living environment as the prerequisite to accelerate the process of housing industrialization.
7 Conclusions
In this paper, the application of correlation analysis and
principal component analysis method on the
comprehensive evaluation of Xi'an housing market supply & demand under the macro control, the results show that under the sustaining implementation of the housing policies in the last two years Xi'an housing market has obtained satisfaction effect, so the study verifies the effect of the government regulation and the efficiency of the principal component analysis method in the application of the housing market supply & demand comprehensive evaluation. The results provide the meaningful guidance for the intensity and direction of the macro-control in the future, and what great important is the meaningful reference and valuable theoretical basis for the future research.
References:
[1]Tsai, I-chun, Housing Supply, Demand and Price: Construction Cost, Rental Price and House Price Indices Housing Supply, Demand and Price: Construction Cost, Rental Price and House Price Indices, Asian Economic Journal, Vol. 26 Issue 4, p381-396, Dec 2012
[2]Loosveldt, Filiep, Investment in housing-the case for demand and supply-side subsidies; the example of the Belgian housing market, Housing Finance International; Vol. 26 Issue 3, p28-30, Mar2012
[3]Ming-Chi Chen, Chin-Oh Chang, Chih-Yuan Yang, Bor-Ming Hsieh, Investment Demand and Housing Prices in an Emerging Economy, Journal of Real Estate Research, Vol. 34 Issue 3, p345-373, Jul-Sep2012
[4]Bellal, Tahar, Housing supply in Algeria: affordability matters rather than availability, Theoretical and Empirical Researches in Urban Management 12, p 97-114, Aug 2009
[5]Qingquan, Li, Guohua, She, Building Cascaded Hierarchical Real Estate Market Based on the Housing Consumption Theory and the Security Theory, Management Science and Engineering 5.3, p 68-71, 2011
[6]Fingleton, Bernard, Housing Supply, Housing Demand, and Affordability, Urban Studies, v 45, n 8, p 1545-1564,2008 [7]Dol, Kees, Kleinhans, Reinout, Going too far in the battle
against concentration? On the balance between supply and
demand of social housing in Dutch cities, Urban Research & Practice, Vol. 5 Issue 2, p273-283, Jul2012
[8]Kemp, Brian, The Housing Market--A Case for Supply and Demand Analysis, Economics, 13, 58, 40-5, Sum 77. [9]Olvera, Hector A., Garcia, Mario, Li, Wen-Whai, Yang,
Hongling, Amaya, Maria, Myers, Orrin, Burchiel, Scott W., Berwick, Marianne Pingitore, Nicholas E. Principal component analysis optimization of a PM2.5 land use regression model with small monitoring network, Science of the Total Environment; Vol. 425, p27-34, May2012
[10]Debelak, Rudolf, Tran, Ulrich S.,Principal Component Analysis of Smoothed Tetrachoric Correlation Matrices as a Measure of Dimensionality, Educational & Psychological Measurement; Vol. 73 Issue 1, p63-77, Feb2013
[11]Khatun, Tahmina, Measuring environmental degradation by using principal component analysis. Environment, Development & Sustainability; Vol. 11 Issue 2, p439-457, Apr2009
[12]Cadima, Jorge, Calheiros, Francisco Lage, Preto, Isabel P., The eigenstructure of block-structured correlation matrices and its implications for principal component analysis, Journal of Applied Statistics; Vol. 37 Issue 4, p577-589, Apr2010
First Author Jianping Yang: male, born in 1969, Ph. D, Professor, master's tutor, national registered real estate valuer, National Registered Consulting Engineer (investment), is the committee of the Architectural Society of China economic housing construction real estate economy professional, Shaanxi Province Civil Society Construction Economy, and the executive director of Xi'an real estate Appraisal Association, the main research directions are construction and real estate economics and management of the city, investment decision and project evaluation, the management of the construction and real estate enterprises, building energy saving and other relevant teaching and research work. Hosted and participated in the National Natural Science Foundation of China, natural science foundation, longitudinal and transverse scientific research and teaching research for more than 30 items, is the editor in chief, deputy editor of more than 10 textbooks and other books, published teaching and academic papers nearly 20 pieces, and won the award of provincial government science and technology second prize, science and technology progress province college first prize, college scientific and technological progress first prize, and the school project award, the paper award and the teaching achievement award nearly 20 items.