vol. 41, n. 4, out./dez., 2005
Quantitative determination of ciprofloxacin and norfloxacin in
pharmaceutical preparations by high performance liquid chromatography
Nájla Mohamad Kassab, Anil Kumar Singh, Erika Rosa Maria Kedor-Hackmam,
Maria Inês Rocha Miritello Santoro*
Departamento de Farmácia, Faculdade de Ciências Farmacêuticas, Universidade de São Paulo
The objective of this research was to develop and validate an analytical method for quantitative determination of ciprofloxacin (CIP) and norfloxacin (NOR) in pharmaceutical preparations. A simple and rapid chromatographic method was developed and validated for quantitative determination of two fluoroquinolone antibiotics in tablets and injection preparations. The quinolones were analyzed by using a LiChrospher® 100 RP-18 column
(5 µm, 125 x 4 mm) and a mobile phase consisted of water:acetonitrile:triethylamine (80:20:0.3 v/v/v). The pH of final mixture was adjusted to 3.3 with phosphoric acid. The flow rate was 1.0 mL/min and UV detection was made at 279 nm. The analyses were performed at room temperature (24 ± 2 ºC). CIP and NOR were eluted within 5 min. The calibration curves were linear (r > 0.9999) over a concentration range from 4.0 to 24.0 µg/mL. The relative standard deviation (RSD) was < 1.0% and the mean recovery was 101.85%.
INTRODUCTION
Fluoroquinolones comprise a series of broad-spectrum synthetic antibacterial agents derived from nalidixic acid. They were discovered casually in 1962 and since then are essentially used in the treatment of several infectious diseases (Bertino and Fish, 2000; Fierens, Hillaert and Van Den Bossche, 2000; Marzo and Dal Bo, 2002; Arteseros et al., 2002).
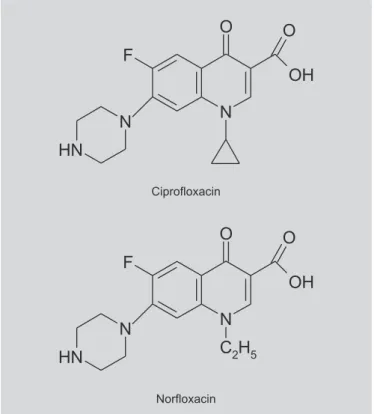
Ciprofloxacin (CIP) and norfloxacin (NOR) are quinolones with fluorine at position 6 of naphthyridine ring. The chemical structures of fluoroquinolones are shown in Figure 1. Published structure-activity data shows that fluorine atom help broadens their activity spectrum against both gram-negative and gram-positive pathogens (Lorian,
1996; Bertino, Fish, 2000; Fierens, Hillaert and Van Den
Bossche, 2000; Arteseros et al., 2002; Samanidou,
Demetriou, Papadoyannis, 2003).
The primary target of fluoroquinolones is bacterial enzyme DNA gyrase or topoisomerase II (Mandel, Petri Júnior, 1996; Bertino, Fish, 2000; Marzo, Dal Bo, 2000; Arteseros et al., 2002). They are generally well tolerated, safe and adverse effects vary significantly depending on their physicochemical properties (Mandel, Petri Júnior, 1996; Bertino, Fish, 2000). Majority of them are well absorbed through oral route and have a long half-life, being widely distributed within body tissues and fluids (Marzo, Dal Bo, 2002; Samanidou, Demetriou, Papadoyannis, 2003).
Due to the minor structural differences amongst members of the same group, it is difficult to identify and to
*Correspondence:
M. I. R. M. Santoro Departamento de Farmácia, Faculdade de Ciências Farmacêuticas, Universidade de São Paulo, CP 66083, CEP 05315-970, São Paulo, Brasil
E-mail: [email protected]
Uniterms
• Ciprofloxacin • Norfloxacin
determine their respective degradation products (Joshi, 2002). Several analytical methods for quantitative determination of fluoroquinolones in pharmaceutical formulations are described in scientific literature, like capillary electrophoresis (Bhowal, Das, 1991; Flurer, 1997; Sun, Chen, 1997), UV spectro-photometry (Fratini, Schapoval, 1996; Chowdary, Rao, 1997), titrimetry (Belal, Al-Majed, Al-Obaid, 1999), and high performance liquid chromatography (HPLC) (United States Pharmacopeia , 2004; British Pharmacopoeia, 1999; Mazuel, 1991), amongst others.
HPLC is widely employed for the determination of CIP and NOR either in biological fluids, edible animal products, feed and pharmaceutical formulations (Barbosa, Berges, Sanz-Nebot, 1996; Belal, Al-Majed, Al-Obaid,
1999; Budvari-Barany et al. 1991; Córdoba-Borrego,
Cordoba-Diaz, Cordoba-Diaz, 1999; Husain et al. 1995;
Kirkland, Mccombs, Kirkland, 1994; Lacroix, Curran, Sears, 1996; Morley, Erold, 1993; Samanidou, Christodoulou, Papadoyannis, 2005; Sowinski, Kays, 2004;
Thoppil, Amin, 2000; Tiefenbacher et al. 1994; Torniainen,
Tammilehto, Ulvi, 1996; Vybiralova et al. 2005).
Majority of these HPLC methods were applied in determination of fluoroquinolones in biological fluids, edible animal products, feeds and to a lesser extent in pharmaceutical formulations. Most of the reported methods involve troublesome mobile phase (buffers) and
difficult sample preparation. The objective of this research was to develop and validate an efficient HPLC method for quantitative determination of second-generation quinolones in pharmaceutical preparations. A rapid, accurate and sensitivity method was developed for quantitative determination of two fluoroquinolones: CIP and NOR in tablets and injectable preparations.
EXPERIMENTAL
Material
Reagents and chemicals
All solvents were of HPLC grade and reagents were analytical grade. Acetonitrile and phosphoric acid were
obtained from Merck®. Analytical grade triethylamine was
purchased from Sigma®. Water was purified with Milli-Q®
Plus, Millipore System. All solvents and solutions were
filtered through membrane filter (Millipore Millex® - HV
filter units, Durapore - PVDF, polyethylene, 0.45 µm pore size) and degassed before use.
The active pharmaceutical ingredients (API) including CIP (99.5%) and NOR (100.1%) were kindly donated by a local pharmaceutical industries and were used as reference standards without further purification.
Samples
The samples used in this research are presented in Table 1.
TABLE I - Commercial pharmaceutical dosage form samples of ciprofloxacin and norfloxacin used in the research
Sample Pharmaceutical Drug Pharmaceutical
number industries (a) dosage form
1 A Ciprofloxacin Tablets
hydrochloride (250 mg)
2 B Ciprofloxacin Tablets
hydrochloride (500 mg) 3 C Ciprofloxacin Injection 100 mL
(freebase) (20 mg/mL)
4 D Norfloxacin Tablets
(freebase) (400 mg)
5 E Norfloxacin Tablets
(freebase) (400 mg)
(a) Pharmaceutical industries are identified by letters and
samples by numbers
Instrumentation
A. HPLC System
High performance liquid chromatographic system
model Varian® 5000, equipped with injection valve –
Rheodyne® model 7125 with 20 µL fixed loop, variable
ultraviolet detector Varian® model 4000 and integrator
Varian® model 4400.
B. Column
The analytical column was a reversed phase
LiChrospher® 100 RP-18 (125 x 4 mm, 5 µm) in
LichroCART® – Merck.
Methods
Chromatographic conditions
All analyses were done at ambient temperature (24 ± 2 ºC) under isocratic conditions. The mobile phase consisted of a volumetric mixture of water:aceto-nitrile:triethylamine (80:20:0.3 v/v/v). The pH of final mixture was adjusted to 3.3 with phosphoric acid. The flow rate was 1.0 mL/min and volume of injection was 20 µL. All solutions, including mobile phase, were sonicated during 25 min before use. The UV detection was made at 279 nm.
Standard solutions preparation
Accurately weighed amount of standards of CIP and NOR, equivalent to 20.0 mg of freebase were transferred to 100 mL volumetric flasks, separately. The volume was completed with mobile phase and methanol, in case of CIP and NOR, respectively. The resulting solutions were sonicated during 25 min and filtered through a filtration membrane. Fi-nal concentrations were 200.0 µg/mL. Aliquots of each solution were accordingly diluted with mobile phase in order to obtain solutions with final concentration of 50.0 µg/mL.
Calibration curves
Six different concentration levels (4.0, 8.0, 12.0, 16.0, 20.0 and 24.0 µg/mL) were obtained of each standard solution, conveniently diluted with mobile phase. Each solution was injected in the chromatographic system (n = 3) and mean values of peak areas were plotted against concentrations. The curves were adjusted by linear regression with least mean square method (Harris, 2001; Leite, 2002).
Linearity
The linearity of the proposed method was evaluated by using calibration curves to calculate coefficient of correlation and intercept values.
Sample preparation
Tablets
Twenty tablets of each sample were individually weighed and triturated to obtain homogeneous mixture. An amount of powder equivalent to 100.0 mg of freebase, was transferred to a 100 mL volumetric flask. The volume was completed with mobile phase for CIP, while for NOR, methanol was used. The resulting solutions were sonicated during 25 min to facilitate proper solubilization. All the solutions were filtered through Whatman filter paper nº 1 Aliquots of each filtered solution were accordingly diluted, with mobile phase, in order to obtain solutions with final concentration of 50.0 µg/mL. Assays were performed after appropriate dilutions of above solution.
Injectable preparations
For injectable sample, 5.0 mL of the solution was accurately measured and the procedure adopted for sample preparation was similar to that described for tablets. Appropriate dilutions were made with mobile phase to fi-nal solutions containing 50.0 µg/mL of the drug in freebase. Assays were performed after appropriate dilutions of above solution.
Specificity
The specificity of proposed method was evaluated by comparing the results obtained by analysis of placebo formulations using the proposed method.
Accuracy
To evaluate the accuracy of the proposed method, recovery tests were carried out with all samples. Recovery tests were performed by adding known amounts of standard solutions to sample followed by analysis using the proposed method. Aliquots of standard and samples solutions were transferred to 25 mL volumetric flasks and final volumes were completed with mobile phase. The percentage of recovery (R%) was calculated as indicated by Association of Official Analytical Chemists International (2002).
Precision
Robustness
The robustness of the proposed method was evaluated by intentional minor modifications in the composition of the mobile phase as well as its pH. The modified mobile phase was used to analyze drug samples (Chromatograms not shown).
Detection limit (DL) and quantification limit (QL)
The DL and QL were calculated through following equations:
(Equation 1)
(Equation 2)
Where:
SD = Standard deviation of curve,
α = Slope of curve
RESULTS AND DISCUSSION
In order to validate an efficient method for analysis of drugs in pharmaceutical formulations, preliminary tests were performed with the objective to select adequate and optimum conditions. Parameters such as detection wavelength, ideal mobile phase and their proportions, optimum pH and concentration of the standard solutions were exhaustively studied.
Several binary or ternary eluents were tested using different proportions of solvents such as acetonitrile, methanol and water. Some ion-pair reagents were also studied. A flow rate of 1.0mL/min was selected after preliminary tests.
The proposed method is simple and do not involve laborious time-consuming sample preparation. The method was statistically validated for their accuracy and precision. The chromatograms of sample containing CIP and NOR can be observed in Figure 2 (a - b) and 2c, respectively. As could be seen, excipients did not interfere in the analysis of CIP and NOR using proposed method.
The calibration curves showed linearity over a concentration range from 4.0 to 24.0 µg/mL. The correlation coefficients obtain with linear regression of curve were better than 0.9999. Linearity data shows concentration interval of studied fluoroquinolones in which the intensity of the detector response is proportional to the concentration of the analyzed substance. The DL and QL
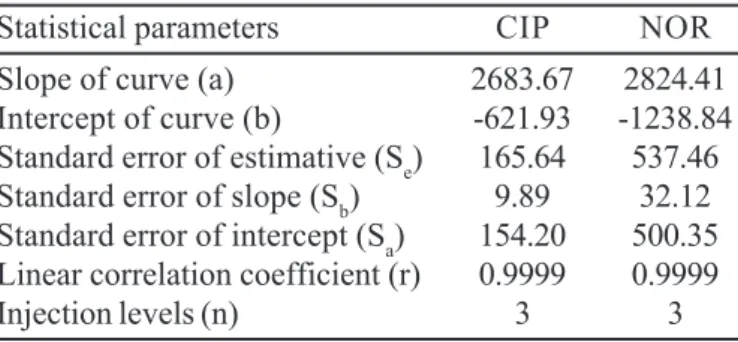
of CIP and NOR were 0.16, 0.50 and 0.28, 0.86 µg/mL, respectively. Table 2 shows the statistical parameters of CIP and NOR analyzed by the proposed method.
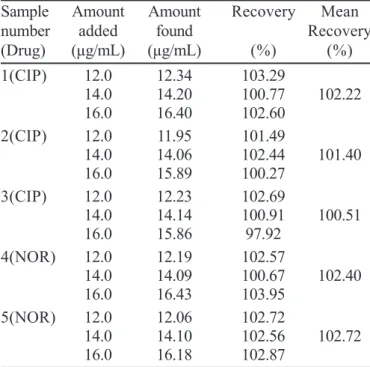
The standard deviation amongst replicate responses and relative standard deviation values (RSD) were less than 1.0%, indicating precision of the method. The statistical data results obtained in the analysis of commercially available samples are shown in Table 3. The recovery values obtained were between 97.92 and 103.95%, confirming accuracy of the proposed method. The percentage of recovery results are presented in Table 4.
FIGURE 2 - Chromatograms of samples: (a) ciprofloxacin tablet, (b) ciprofloxacin injectable and (c) norfloxacin (15.0
µg/mL). Conditions: LiChrospher® RP-18 column (5 µm,
125 x 4 mm) in LiChroCART®, mobile phase
H2O:MeCN:TEA (80:20:0,3 v/v), pH adjusted to 3.3 with
phosphoric acid, flow rate 1.0 mL/min, UV detection at 279 nm and ambient temperature (24 ± 2 °C).
TABLE II - Statistical results of linear regression analysis in the determination of CIP and NOR by proposed method
Statistical parameters CIP NOR
Slope of curve (a) 2683.67 2824.41
Intercept of curve (b) -621.93 -1238.84
Standard error of estimative (Se) 165.64 537.46
Standard error of slope (Sb) 9.89 32.12
Standard error of intercept (Sa) 154.20 500.35
Linear correlation coefficient (r) 0.9999 0.9999
There was minor delay in the retention time when pH of the mobile phase varies in 0.5 units. Practically no effect was observed when mobile phase components were intentionally deviated. Changes as much as 5 mL of each component in the mobile phase were altered. Consequently, due to this observation, the robustness of the method can be confirmed.
CONCLUSION
The proposed HPLC method enables quantitative determination of second generation quinolones such as CIP and NOR in pharmaceutical formulations. UV detection at 279 nm was found to be suitable without any interference from tablets or injectable solution excipients or solvents. The calibration curves were found to be linear with correlation
coefficients above 0.9999. The relative standard deviations values were less than 1.0%. Analytical results of samples were in accordance with those of standard solution in the same concentrations. Preparation of samples is easy and efficient. The proposed HPLC method is fast, precise, accurate, sensitive, and efficient and can be used in routine analysis in quality control laboratories.
ACKNOWLEDGEMENT
The authors gratefully thank “Coordenação de Aper-feiçoamento de Pessoal de Nível Superior (CAPES)”.
RESUMO
Determinação quantitativa do ciprofloxacino e do norfloxacino em preparações farmacêuticas por
cromatografia líquida de alta eficiência
O objetivo desta pesquisa foi desenvolver e validar um método analítico para a determinação quantitativa do ciprofloxacino (CIP) e do norfloxacino (NOR) em prepa-rações farmacêuticas. Um método cromatográfico sim-ples e rápido foi desenvolvido e validado para a deter-minação quantitativa de dois antibióticos fluoroquino-lônicos em comprimidos e injetáveis. As quinolonas fo-ram analisadas empregando-se uma coluna RP-18, LiChrospher® 100 (125 x 4 mm, 5µm) e fase móvel cons-tituída por água:acetonitrila:trietilamina (80:20:0.3 v/v/ v). O pH da mistura final foi ajustado a 3,3 com ácido fosfórico. A vazão da fase móvel foi de 1,0 mL/min e a detecção em UV a 279 nm. As análises foram realizadas à temperatura ambiente (24±2 ºC). O CIP e o NOR eluíram em menos de 5 min. As curvas de calibração foram lineares (r > 0.9999) na faixa de concentração entre 4,0 e 24,0 µg/mL. O desvio padrão relativo (RSD) foi < 1,0% e a recuperação média foi de 101,85%.
UNITERMOS: Ciprofloxacino. Norfloxacino. Prepa-rações farmacêuticas. CLAE.
TABLE IV - Recovery data of standard solutions added to the samples analyzed by using the proposed HPLC method
Sample Amount Amount Recovery Mean
number added found Recovery
(Drug) (µg/mL) (µg/mL) (%) (%)
1(CIP) 12.0 12.34 103.29
14.0 14.20 100.77 102.22
16.0 16.40 102.60
2(CIP) 12.0 11.95 101.49
14.0 14.06 102.44 101.40
16.0 15.89 100.27
3(CIP) 12.0 12.23 102.69
14.0 14.14 100.91 100.51
16.0 15.86 97.92
4(NOR) 12.0 12.19 102.57
14.0 14.09 100.67 102.40
16.0 16.43 103.95
5(NOR) 12.0 12.06 102.72
14.0 14.10 102.56 102.72
16.0 16.18 102.87
(a) Average of three determinations
TABLE III - Statistical data obtained in the analysis of samples using the proposed method
Sample number Declared theoretical Found experimental SD* RSD(%) Content (%)
(Drug) concentration (µg/mL) concentration(µg/mL)* Confidence interval**
1(CIP) 15.00 15.51 0.08 0.51 103.38 ± 0.06
2(CIP) 15.00 16.05 0.13 0.78 107.01 ± 0.09
3(CIP) 15.00 15.06 0.08 0.51 100.43 ± 0.06
4(NOR) 15.00 14.94 0.06 0.40 099.59 ± 0.04
5(NOR) 15.00 14.91 0.11 0.74 099.41 ± 0.08
REFERENCES
ARTESEROS, J.A.H.; BARBOSA, J.; COMPANO, R.; PRAT, M.D. Analysis of quinolone residues in edible
animal products. J. Chromatogr. A, Amsterdam, v.945,
p.1-24, 2002.
ASSOCIATION OF OFFICIAL ANALYTICAL
CHEMISTS INTERNATIONAL. Official methods of
analysis of AOAC International. 17 ed. Gaithersburg: AOAC, 2002. v.1, p.xx.
BARBOSA, J.; BERGES, R; SANZ-NEBOT, V. Solvatochromic parameter values and pH in aqueous-organic mixture and use in liquid chromatography.
Prediction of retention of series of quinolones. J.
Chromatogr., A, Amsterdam, v.719, p.27-36, 1996.
BELAL, F.; AL-MAJED, A.A.; AL-OBAID, A.M. Methods
of analysis of 4-quinolone antibacterials. Talanta,
Amsterdam, v.50, n.4. p.765-786, 1999.
BERTINO, J.; FISH, D. Safety profiles of the fluoroquinolones.
Clin. Ther., Hillsborough, v.22, p.798-817, 2000.
BHOWAL, S.K.; DAS, T.K. Spectrophotometric determination of same recently introduced antibacterial drugs using ferric chloride. Anal. Lett., New York, v.24, p.25-37, 1991.
BRITISH pharmacopoeia 1999. London: Her Majesty’s Stationery Office, 1999. p.369-370, 1034-1035.
BUDVARI-BARANY, Z.S.; SZASZ, G.Y.; TAKACS-NOVAK, K.; HERMECZ, I.; LORE, A. The pH influence on the HPLC-retention of chemotherapeutic
fluorquinolone derivatives. J. Liq. Chromatogr., New
York, v.14, p.3411-3424, 1991.
CHOWDARY, K.P.R.; RAO, G.D. Spectrophotometric method for the determination of lomefloxacino
hydrochroride. Indian Drugs, Mumbai, v.34, p.107-108,
1997.
CORDOBA-BORREGO, M.; CORDOBA-DIAZ, M.; CORDOBA-DIAZ, D. Validation of high-performance liquid chromatographic method for the determination of norfloxacin and its application to stability studies (photo-stability study of norfloxacin). J. Pharm. Biomed. Anal., Amsterdam, v.18, p.919-926, 1999.
FIERENS C.; HILLAERT. S.; VAN DEN BOSSCHE W. The qualitative and quantitative determination of quinolones of first and second generation by capillary
electrophoresis. J. Pharm. Biomed. Anal., Amsterdam,
v.22, p.763-772, 2000.
FLURER, C.L. Analysis of antibiotics by capillary
electrophoresis. Electrophoresis, Weinheim, v.18,
p.2427-2437, 1997.
FRATINI, L.; SCHAPOVAL, E.E.S. Ciprofloxacin determination by visible light spectrophotometry using iron(III) nitrate. Int. J. Pharm., Amsterdam, v.127, p.279-282, 1996.
HARRIS, D.C. Métodos de calibração. In: _____. Análise
química quantitativa. 5.ed. Rio de Janeiro: Livros Técnicos e Científicos, 2001. p.81-95.
HUSAIN, S.; KHALID, S.; NAGARAJU, V.; RAO, R.N. High-performance liquid chromatographic separation and determination of small amounts of process impurities of ciprofloxacin in bulk drugs formulations. J. Chromatogr.,
A, Amsterdam, v.705, p.380-384, 1995.
JOSHI, S. HPLC separation of antibiotics present in
formulated and unformulated samples. J. Pharm.
Biomed. Anal., Amsterdam, v.28, p.795-809, 2002.
KIRKLAND, K.M.; MCCOMBS, D.A.; KIRKLAND, J.J. Rapid, high-resolution high-performance liquid
chromatography of antibiotics. J. Chromatogr., A,
Amsterdam, v.660, p.327-337, 1994.
LACROIX, P.M.; CURRAN, N.M.; SEARS, R.W. High-pressure liquid chromatographic methods for ciprofloxacin
hydrochloride and related compounds in raw materials. J.
Pharm. Biomed. Anal., Amsterdam, v.14, p.641-654, 1996.
LEITE, F. Validação em análise química. 4.ed. São Paulo:
Átomo, 2002. p.69-72.
LORIAN, V. Antibiotics in Laboratory Medicine. 4.ed.
Baltimore: Williams & Wilkins, 1996. p. 591-592.
MARZO, A.; DAL BO, L. Chromatography as an analytical tool for selected antibiotic classes: a reappraisal addressed
to pharmacokinetic applications. J. Chromatogr. A,
Amsterdam, v.812, p.17-34, 2002.
MAZUEL, C. Norfloxacin. Anal. Profiles Drug Subst.
Excipients, San Diego, v.20, p.557-600, 1991.
MORLEY, J.A.; EROLD Jr., L. Determination of fluorquinolne antibacterial as N-Acyl derivatives.
Chromatographia, Wiesbaden, v.37, p.295-299, 1993.
SAMANIDOU, V.F.; CHRISTODOULOU, E.A.;
PAPADOYANNIS, I.N. Determination of
fluoroquinolones in edible animal tissue samples by high performance liquid chromatography after solid phase
extraction. J. Sep. Sci., Weinheim, v. 28, p. 555-565,
2005.
SAMANIDOU, V.F.; DEMETRIOU, C.E.; PAPADOYANNIS, I.N. Direct determination of four fluoroquinolones, enoxacin, norfloxacin, ofloxacin, and ciprofloxacin, in pharmaceuticals and blood serum by
HPLC. Anal. Bioanal. Chem., Heidelberg, v.375,
p.623-629, 2003.
SOWINSKI, K.M.; KAYS, M.B. Determination of ciprofloxacin concentrations in human serum and urine by HPLC with ultraviolet and fluorescence detection. J. Clin. Pharm. Ther., Oxon, v. 29, p. 381-387, 2004.
SUN, S.-W.; CHEN, L.-Y. Optimization of capillary electrophoretic separation of quinolones antibacterials
using the overlapping resolution mapping scheme. J.
Chromatogr., A, Amsterdam, v.766, p.215-224, 1997.
THOPPIL, S.O.; AMIN, P.D. Stability indicating reversed-phase liquid chromatographic determination of ciprofloxacin as bulk drug and in pharmacetical
formulations. J. Pharm. Biomed. Anal., Amsterdam,
v.22, p.699-703, 2000.
TIEFENBACHER, E.M.; HAEN, E.; PRZYBILLA, B.; KURZ, H. Photodegradation of some quinolones used as
antimicrobial therapeutics. J. Pharm. Biomed. Anal.,
Amsterdam, v.83, p.463-467, 1994.
TORNIAINEN, K.; TAMMILEHTO, S.; ULVI, V. The effect of pH, buffer type and drug concentration on the
photodegradation of ciprofloxacin. Int. J. Pharm.,
Amsterdam, v.132, p.53-61, 1996.
UNITED States Pharmacopeia. 27.ed. Rockville: United States Pharmacopeial Convention, 2004. p.454-457, 1342-1343.
VYBIRALOVA, Z.; NOBILIS, M.; ZOULOVA, J.; KVETINA, J.; PETR, P. High-performance liquid chromatographic determination of ciprofloxacin in plasma samples. J. Pharm. Biomed. Anal., Oxford, v. 37, p. 851-858, 2005.