Quim. Nova, Vol. 33, No. 4, 968-971, 2010
Nota Técnica
*e-mail: [email protected]
DEVELOPMENT AND VALIDATION OF UV SPECTROPHOTOMETRIC METHOD FOR DETERMINATION OF LEVOFLOXACIN IN PHARMACEUTICAL DOSAGE FORMS
Nájla Mohamad Kassab*
Departamento de Farmácia Bioquímica, Centro de Ciências Biológicas e da Saúde, Universidade Federal de Mato Grosso do Sul, CP 549, 79070-900 Campo Grande - MS, Brasil
Marcos Serrou do Amaral
Departamento de Física, Centro de Ciências Exatas e Tecnologia, Universidade Federal de Mato Grosso do Sul, CP 549, 79070-900 Campo Grande - MS, Brasil
Anil Kumar Singh e Maria Inês Rocha Miritello Santoro
Departamento de Farmácia, Faculdade de Ciências Farmacêuticas, Universidade de São Paulo, CP 66083, 05315-970 São Paulo – SP, Brasil
Recebido em 7/7/09; aceito em 25/11/09; publicado na web em 23/3/10
The objective of this research was to develop and validate an alternative analytical method for quantitative determination of levoloxacin in tablets and injection preparations. The calibration curves were linear over a concentration range from 3.0 to 8.0 μg mL-1. The relative
standard deviation was below 1.0% for both formulations and average recovery was 101.42 ± 0.45% and 100.34 ± 0.85% for tablets and injection formulations, respectively. The limit of detection and limit of quantitation were 0.08 and 0.25 μg mL-1, respectively. It was
concluded that the developed method is suitable for the quality control of levoloxacin in pharmaceuticals formulations. Keywords:luoroquinolone; UV spectrophotometry; quality control.
INTRODUCTION
Quinolones are antimicrobials, structurally related to nalidixic acid, which were made available for clinical use in urinary infections, since 1960s.1,2 They are used in human and veterinary medicine,
especially in animal breeding area.1,2 Considerable amounts of
qui-nolones are widely used under ield conditions (in poultry, swine, and cattle production), both in the treatment of infections and as growth promoters.1 The bactericidal activity of levoloxacin is mediated by
the inhibition of DNA gyrase (topoisomerase II) and topoisomerase IV, essential enzymes involved in bacterial DNA replication, trans-cription, repair and recombination.3
Levoloxacin (Figure 1, CAS number 100986-85-4) is pure (–)-(S )-enantiomer of the racemic drug substance oloxacin, which was introdu-ced in 1997. A third-generation luoroquinolone with a wide spectrum of action against gram-positive and gram-negative bacteria, anaerobic microorganisms, and atypical pathogens.4 Levoloxacin prepared as
hemihydrate, whose molecular mass is 369.93 g mol-1, is presented as
white to light yellow needlelike crystals, that melt at approximately 226 ºC. Its solubility is nearly constant from pH 0.6 to 5.8 (100.0 mg mL-1). Above pH 5.8, solubility increases sharply, reaching a maximum
of 272 mg mL-1 at pH 6.7, beyond which it decreases to a minimum
of 50.0 mg mL-1.5 Levoloxacin is the quinolone of choice for airway
infections, being active against several types of pathogens.1,2,4,6
Various analytical methods have been reported in scientiic literature for the analysis of levoloxacin in pharmaceutical formulation and/or biological luids including high-performance liquid-chromatography with UV detection (HPLC-UV),7 vibrational spectroscopy,8 spectroluorimetry
(SF),9 colorimetric spectrophotometry (CS),9,10 spectrophotometry by
ion-pair complex (CIPS),10-12 and UV spectrophotometry (UVS).13
Most spectrophotometric methods in the literature for analysis of levoloxacin is based on the formation of ion-complexes,10-12 which use
dye as Eriochrome black,12 bromophenol blue, bromocresol green,10,12
eosin, merbromin11 and chromogenic reagent such as Folin-Ciocalteau.12
The addition of these substances usually increases the cost of analysis and sample preparation is time consuming. Besides cost, toxicity of reagents and solvents used in the analysis should also be considered. Exposure to merbromin even at low concentrations and short exposure time can cause poisoning. The complexes formed normally need extraction with organic solvents, for example, chloroform,10,12 which in addition to further
increase the cost of analysis and require safe handling and proper disposal. Recently an UVS method was proposed with acetonitrile as solvent for the quantitative determination of levoloxacin in tablets and solution.13 This solvent is more toxic and more expensive than
methanol. Therefore, the proposed method is less toxic to the analyst when compared with the solvent acetonitrile and is more economical.
In addition, there are no oficial methods for determination of this active substance.14,15
Thus, the aim of this study was to develop and validate a fast, simple and cost-effective UV-spectrophotometric alternative method for analysis of two commercial formulations of levoloxacin. EXPERIMENTAL
Material
Development and validation of UV spectrophotometric method 969 Vol. 33, No. 4
dards without further puriication. The commercial levoloxacin (free base) dosage forms used were tablets containing 250 mg of the active substance (declared content), and injection vial of 100 mL, with 5 mg mL-1 (declared concentration). The levoloxacin reference substance,
as well as the tablets and injection vial, were kept protected from light throughout the whole procedure. Methanol was HPLC grade. Instrumentation and conditions
A HP 8453 UV-Visible Spectrophotometer with data processing system was used. UV spectra absorbance of reference and sample solutions were recorded in 10 mm quartz cells at 298 nm. The solu-tions were prepared in methanol.
Methods
Preparation of standard solutions
The levoloxacin reference standard solution (200.0 μg mL-1) was
prepared by accurately weighing 20.0 mg of levoloxacin reference in a 100.0 mL volumetric lask. The volume was completed with methanol. This lask was sonicated for 25 min. The above solution was diluted in a 100 mL volumetric lask with methnol to obtain a inal solution containing 10.0 μg mL-1 of levoloxacin.
Determination of maximum absorption λ
max.
From the standard solution (200.0 μg mL) approximately 3.0 mL was taken and scanned from 200 to 400 nm with HP 8453 UV-Visible spectrophotometer. The methanol was used as blank. Levoloxacin presented maximum absorption at 298 nm.
Calibration curve
The calibration curve was constructed by analyzing 6 different concentrations of standard solution, prepared on the same day. The range of solutions varied from 3.0 to 8.0 μg mL-1.All determinations
were conducted in triplicate. Sample preparation
Levoloxacin tablets
To analyze the concentration of levoloxacin tablets, 20 tablets of each sample were individually weighed and triturated to obtain homo-geneous mixture. An amount of powder equivalent to 100.0 mg of free base was transferred to 100.0 mL volumetric lask. The volume was completed with methanol. The resulting solution was sonicated during 25 min to facilitate proper solubilization. Aliquots of this solution were accordingly diluted with methanol, in order to obtain a solution with inal concentration of 5.0 μg mL-1. All sample and standard solution were
iltered through hydrophilic membrane of 0.45 μm pore size - Millipore®
Millex-HV ilter units. All determinations were conducted in triplicate. Levoloxacin injection
To analyze the concentration of levoloxacin injection, 5.0 mL of injection formulation (theoretical content 5 mg mL-1) was used for
sam-ple solution preparation. The procedure adopted for the preparation of injectable sample was similar to that described for tablets. Appropriate dilutions were made with methanol to inal solution containing 5.0 μg mL-1 of drug as free base. All determinations were conducted in triplicate.
Method validation
Linearity
The linearity was determined by plotting concentration against corresponding absorbance. The calibration curve was deined in the
concentration interval in which the intensity of the spectrophotome-ter response was linearly proportional to the concentration of the analyzed substance:
A = a.C + b (1)
where A is the absorbance; C, concentration of sample; a, slope of the curve; and, b, y intercept of the curve.
The linearity was evaluated by linear regression analysis, which was calculated by the least square regression method and the corre-lation coeficient (r) indicated the linearity of the method.
Precision
The intra-day precision was determined by analyzing the samples of levoloxacin at concentrations of 5.0 μg mL-1. Determinations
were performed with ten replicates on the same day. The precision is expressed as relative standard deviation (RSD) amongst responses. In order to be considered precise, the RSD of the method should be less than 2.0%.
Accuracy
The accuracy of the method was evaluated through the recovery test. Recovery tests were performed by adding known amounts of standard solutions to samples followed by analyses using the proposed method. Aliquots of standard and samples solutions were transferred to 10 mL volumetric lasks and inal volumes were completed with methanol. The percentage of recovery (R) was calculated as indicated by Association of Oficial Analytical Chemists International:16
R = [ ( CF – CU ) / CA ] x 100 (2)
where CF represents the concentration of analyte measure in fortiied test sample; CU , the concentration of analyte measure in unfortiied test sample; and, CA , the concentration of analyte added to fortiied test sample.
Speciicity
Speciicity is the ability of the method to accurately measure a compound in the presence of other components such as impuri-ties, degradation products and matrix components. The speciicity of the proposed method was evaluated through the analysis of a placebo solution, which it was prepared with the excipients of the pharmaceutical formulation. Thus, the mixture of component inert was prepared in their usual concentration employed in tablets than the method was applied in order to check if any component of the formulation could generate a response or a read with absorption band similar to the drug.
Limit of detection and limit of quantitation
The limit of detection (LOD) and limit of quantitation (LOQ) were calculated according to International Conference on Harmo-nization guidelines:17
LOD = 3.3 · SDb / a (3)
LOQ = 10.0 · SDb / a (4)
where SDb represents the standard deviation of y-intercept and a is the slope of calibration curve.
Statistical analysis
Kassab et al.
970 Quim. Nova
RESULTS AND DISCUSSION
Levoloxacin was analyzed by proposed UV spectrophotometric method in tablets and injections. The calibration curve showed linea-rity over a concentration range from 3.0 to 8.0 μg mL-1. The linearity
can be deined by following equation A = 0.0981C + 0.0019 (Figure 2), where A and C are levoloxacin absorbance and concentration, respectively. The correlation coeficients of the curve obtained with linear regression method were 0.9999.
The RSD amongst ten measurements for each sample found to be 0.45 and 0.34% for tablets and injection forms, respectively (Table 1). The percentages content were 98.32 ± 0.01% and 99.20 ± 0.01% for tablets and injection forms, respectively (Table 1).
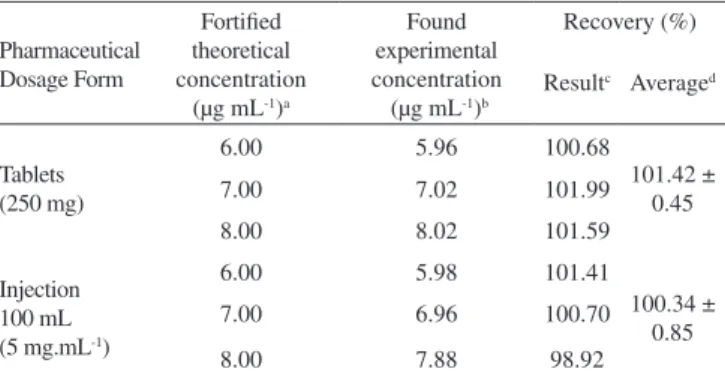
The recovery values obtained were 101.42 ± 0.45% and 100.34 ± 0.85% for tablets and injections forms, respectively, by using Equa-tion 2. These results conirm accuracy of the proposed method. The percentage of recovery results are presented in Table 2.
The assays were validated by means of the analysis of variance, as described in oficial literature.This developed method presented no parallelism deviation and no linearity deviation (P < 0.05). The precision and accuracy of the assay were demonstrated.
The excipients present in pharmaceutical dosage form (tablets) do not interfere in the analysis. The results prove speciicity of the proposed methods for inequivocal identiication of analyte in the presence of matrix compounds (excipients).
The LOD and LOQ were 0.08 and 0.25 μg mL-1, by using
Equa-tions 3 and 4, respectively.
While comparing proposed analytical method for determination of levoloxacin in pharmaceutical formulations with those reported in literature, it can be observed that:
Linearity range: reported HPLC-UV,7 CS,9 CIPS,10,11 and UVS,13
methods presented signiicantly higher linearity range, 20.0, 25.0, 29.65, and 10.00 μg mL-1, respectively;
Accuracy: all reported methods are equally accurate;
Precision: CIPS method using bromophenol blue or bromocresol green,10,12 presented RSD values near 0.06%. While SF,9 UVS,13 and
HPLC-UV7 method had RSD values near 0.56, 0.65, and 0.56%,
respectively;
LOD and LOQ: the reported LOD and LOQ values in the literature are high, that makes our method more sensitive.
It is important to observe that only two methods7,9 were fully
validated and applied in the analysis of Levoloxacin in tablets and injection formulations.
CONCLUSION
In this study, the developed and validated UV-spectrophoto-metric alternative method for the determination of levoloxacin in pharmaceutical formulations has the advantage of being fast, simple, cost-effective with high precision, and accuracy. These advantages encourage the application of this method in routine analysis of levoloxacin.
ACKNOWLEDGMENT
The authors gratefully thank “Fundação de Apoio ao Desenvolvi-mento de Ensino, Ciência e Tecnologia do Estado de Mato Grosso do Sul (FUNDECT – Processo 41/100.140/2006)”, and “Coordenação de Aperfeiçoamento de Pessoal de Nível Superior (CAPES)” for inancial support.
REFERENCES
1. Burhenne, J.; Ludwig, M.; Spiteller, M.; Chemosphere1999,38, 1279. 2. Hernández-Arteseros, J. A.; Barbosa, J.; Compañó, R.; Prat, M. D.; J.
Chromatogr., A2002, 945, 1.
3. Kothekar, K. M.; Jayakar, B.; Khandhar, A. P.; Mishra, R. K.; Eurasian J. Anal. Chem.2007, 2,21.
4. Belal, F.; Al-Majed, A. A.; Al-Obaid, A. M.; Talanta1999, 50, 765. 5. Ball, P.; Curr. Ther. Res. Clin. E2003, 64, 646.
6. Nakayama, I.; Yamaji, E.; Anaerobe2003, 9, 71.
7. Santoro, M. I. R. M.; Kassab, N. M.; Singh, A. K.; Kedor-Hackmam, E. R. M.; J. Pharm. Biomed. Anal.2006, 40, 179.
8. Wang, Y.; Yu, K.; Wang, S.; Spectrochim. Acta, Part A2006, 65, 159. 9. Salem, H.; Am. J. Appl. Sci. 2005, 2, 719.
10. Ashour, S.; Al-Khalil, R.; Il Farmaco2005, 60, 771. Figure 2. Calibration curve for Levoloxacin from standard solutions in the
range 3.0 to 8.0 μg mL-1
Table 1. Statistical data obtained in the analysis of samples by using the proposed spectrophotometer method
Pharmaceutical Dosage Form
Declared theoretical concentration
(μg mL-1)
Found experimental concentration
(μg mL-1)a,b
RSD (%)
Content (%)b
Tablets (250 mg) 5.00 4.92 ± 0.02 0.45 98.32 ± 0.01 Injection 100 mL
(5 mg mL-1 ) 5.00 4.96 ± 0.01 0.34 99.20 ± 0.01 aAverage of 10 determinations; b95% of conidence interval level
(t-Distribution)
Table 2. Recovery data of standard solutions added to the samples analyzed
by using the proposed spectrophotometer method
Pharmaceutical Dosage Form
Fortiied theoretical concentration
(μg mL-1)a
Found experimental concentration (μg mL-1)b
Recovery (%) Resultc Averaged
Tablets (250 mg)
6.00 5.96 100.68
101.42 ± 0.45
7.00 7.02 101.99
8.00 8.02 101.59
Injection 100 mL (5 mg.mL-1)
6.00 5.98 101.41
100.34 ± 0.85
7.00 6.96 100.70
8.00 7.88 98.92
aTheoretical Sample Concentration: 3.00 μg mL-1; bAverage of 3
determina-tions; cConcentration of analyte measured in unfortiied test sample (C U) was
Development and validation of UV spectrophotometric method 971 Vol. 33, No. 4
11. El-Brashy, A. M.; El-Sayed Metwally, M.; El-Sepai, F. A.; Il Farmaco
2004, 59, 809.
12. Sivasubramanian, L.; Kasi, S.; Sivaraman, V.; Senthil, K. K.; Muthuku-maran, A.; Raja, T. K.; Indian J. Pharm. Sci.2004, 66, 799.
13. Shirkhedkar, A. A.; Surana, S. J.; Pak. J. Pharm. Sci.2009, 22, 301. 14. United States Pharmacopoeia, 30th ed., United States Pharmacopeial
Convention: RockVille, 2007.
15. British Pharmacopoeia, Health Ministers: London, 2008.
16. Association of Official Analytical Chemists: Official Methods of Analysis of AOAC International, 17th ed., AOAC International:
Gaithersburg, 2002, vol. 1, P. XX.
17. International Conference on Harmonization (ICH): Validation of Analytical Procedures: Text and Methodology, Geneva, IFPMA, 1996; http://www.ich.org/LOB/media/MEDIA417.pdf , accessed September 2009.