Article
Printed in Brazil - ©2014 Sociedade Brasileira de Química0103 - 5053 $6.00+0.00A
*e-mail: [email protected]
Ultra-Fast Determination of Scopolamine, Orphenadrine, Mepyramine, Caffeine,
Dipyrone, and Ascorbic Acid by Capillary Electrophoresis with
Capacitively
Coupled Contactless Conductivity Detection
Mariana C. Marra, Polyana L. Silva, Rodrigo A. A. Muñoz and Eduardo M. Richter*
Instituto de Química, Universidade Federal de Uberlândia, Av. João Naves de Ávila, 2121, bloco 1D, 38400-902 Uberlândia-MG, Brazil
Neste trabalho apresentamos um método de eletroforese capilar simples e de baixo custo para determinação ultra-rápida de princípios ativos presentes em três formulações farmacêuticas diferentes: (i) escopolamina (SCO) e dipirona (DIP); (ii) orfenadrina (ORP), cafeína (CAF) e DIP; (iii) mepiramina (MEP), CAF, DIP e ácido ascórbico (AA). O método proposto é baseado em eletroforese capilar com detecção condutométrica sem contato (CE-C4D). As amostras podem
ser analisadas em uma única corrida (≤ 1 minuto) usando 10 mmol L-1 de 3,4-dimetoxicinamato e
12 mmol L-1 de trietanolamina como eletrólito de corrida (pH = 8,5). Uma resposta linear (r ≥ 0,993)
foi obtida entre 0,10 e 0,50 mmol L-1 para SCO, entre 0,25 e 1,25 mmol L-1 para ORP e MEP,
entre 0,50 e 2,50 mmol L-1 para DIP e CAF e entre 1,00 e 3,00 mmol L-1 para AA. Os limites de
detecção foram 0,02, 0,05, 0,03, 0,04, 0,02 e 0,06 mmol L-1 para SCO, DIP, ORP, CAF, MEP e
AA, respectivamente. Além disto, o método proposto também forneceu resultados adequados nos estudos de precisão intra (≤ 4%) e inter (≤ 14%) dias, assim como resultados satisfatórios nos estudo de adição e recuperação (entre 92% e 103%).
In this paper, we present a simple and low-cost capillary electrophoresis method for ultra-fast determination of active ingredients present in three different pharmaceutical formulations: (i) scopolamine (SCO) and dipyrone (DIP); (ii) orphenadrine (ORP), caffeine (CAF) and DIP; (iii) mepyramine (MEP), CAF, DIP, and ascorbic acid (AA). The proposed method is based on capillary electrophoresis with capacitively coupled contactless conductivity detection (CE-C4D).
The samples can be analyzed in a single run (≤ 1 minute) using 10 mmol L-1 3,4-dimethoxycinnamate
(DMX) and 12 mmol L-1 triethanolamine (TEA) as a background electrolyte (pH = 8.5). A linear
working range (r ≥ 0.993) was obtained from 0.10 to 0.50 mmol L-1 for SCO, from 0.25 to
1.25 mmol L-1 for ORP and MEP, from 0.50 to 2.50 mmol L-1 for DIP and CAF, and from 1.00 to
3.00 mmol L-1 for AA. The limits of detection were 0.02, 0.05, 0.03, 0.04, 0.02, and 0.06 mmol L-1
for SCO, DIP, ORP, CAF, MEP, and AA, respectively. In addition, the proposed method also provided adequate intra (≤ 4%) and inter-day (≤ 14%) precision values, as well as satisfactory recovery values for spiked pharmaceutical samples (from 92% to 103%).
Keywords: capillary electrophoresis, ultra-fast analysis, metamizole, C4D, multicomponent
analysis
Introduction
Dipyrone (DIP), also known as metamizole, is one of the most popular analgesic and antipyretic drug with proven efficiency in pharmaceutical formulations.1 After oral intake, it is rapidly and spontaneously hydrolyzed in the gastric fluid to its active metabolite, 4-methylaminoantipyrine
(4-MAA), which is absorbed in this form (prodrug).2,3
Despite its potential side effects, DIP is widely used in both pediatric and adult patients due to its strong analgesic effect, low-cost, and unrequired prescription in Brazil.2
Caffeine (CAF) in combination with DIP is used as an analgesic adjunct to enhance pain relief, although
CAF has no analgesic effect.4,5 In some pharmaceutical
(MEP). ORP is an analgesic with weak antihistaminic property, useful for relieving pain associated with
traumatic or inflammatory muscle contractions.6 SCO is
an antimuscarinic agent commonly used as an analgesic and a smooth muscle relaxant. It is also used as an antispasmodic agent with antinauseant effects, and is recommended for use in the treatment of motion sickness
and in pre-surgery medication.7 MEP is a drug which
neutralizes the excess of histamine exerting inhibitory action on spasms.8 Some cold and flu drugs are formulated in two tablets, one containing the main active ingredients (DIP, CAF and MEP) and another with ascorbic acid
(vitamin C, AA).9 It is recommended to the patient that
both tablets should be consumed simultaneously for satisfactory treatment.
A common problem all over the world is the counterfeit of pharmaceuticals used by humans and animals. The use of these drugs without suitable quality control represents a risk for the health of people. Consequently, the analysis of pharmaceutical formulations aims not only for the industrial quality control, but also to verify the suitability
of the products.10 Several analytical methods have been
developed for the simultaneous determination of some of these compounds (targets of this study), such as DIP and AA,11,12 DIP and CAF,13-15 CAF and AA,16-18 and CAF and
MEP.19 A single work using near infrared spectroscopy
and chemometric tools was described to classify tablets containing simultaneously DIP, CAF, and ORP, but no
quantifications were performed by this method.6 To our
knowledge, there are no analytical methods reported in the literature for the quality control of these commercially available pharmaceutical formulations with the following compositions: (i) SCO + DIP; (ii) ORP + CAF + DIP, and
(iii) MEP + CAF + DIP + AA.
Capillary electrophoresis with capacitively coupled
contactless conductivity detection (CE-C4D)20, 21 is a
powerful separation technique which has been widely used for the separation and detection a large number of
compounds.22 C4D is a conductivity detector (universal
characteristics) where the electrodes are not in direct
contact with the measured solution.23,24 Therefore, the
CE-C4D system can be considered a versatile set because
all charged species can be detected.23,25 In addition, the use of the CE-C4D system allows the development of analytical methods with several desirable characteristics, such as short analysis time,26-29 low cost, high separation efficiency, and
low consumption of reagents and samples.22
In this paper, we report a new, simple, low-cost and fast CE method for the analysis of three different pharmaceutical formulations containing two or more of active ingredients including SCO, ORP, MEP, CAF, DIP, and AA.
Experimental
Reagents and samples
Highly-pure deionized water (R ≥ 18 MΩ cm)
obtained from a Millipore Direct-Q3 water purification system (Bedford, MA, USA) was used to prepare all aqueous solutions. Sodium dipyrone (DIP), mepyramine maleate (MEP), triethanolamine (TEA), histidine, 2-amino-2-hydroxymethyl-propane-1,3-diol (Tris), and 3,4-dimethoxycinnamate (DMX) were purchased from Sigma-Aldrich (Milwaukee, WI, USA), caffeine (CAF) from Synth (Diadema, SP, Brazil), ascorbic acid (AA) from Vetec (Duque de Caxias, RJ, Brazil), scopolamine butylbromide (SCO) and orphenadrine citrate (ORP) from Henrifarma (São Paulo, SP, Brazil), and codeine phosphate (COD) from Galena (Campinas, SP, Brazil). All chemicals were of analytical grade and used without further purification. Three different pharmaceutical samples (tablets) were acquired at local drugstores. Eight tablets from each sample were accurately weighed and powdered in a mortar. An adequate amount of the powder was dissolved in water, after stirring and sonication for 10 min
in an ultrasonic bath. Before injection in the CE-C4D
system, the samples and standard solutions were suitably diluted in water and filtered through a membrane filter (pore size of 0.45 µm). The background electrolyte (BGE) was
10 mmol L-1 DMX and 12 mmol L-1 TEA buffer (pH 8.5).
Instrumentation
The experiments were performed using a homemade CE instrument with two compact and high-resolution capacitively coupled contactless conductivity detectors (CE-C4D).23,25,30 In this version of detector, the potential (4-Vpp) and frequency (1.1 MHz) are constant (no optimization is required). The detectors were positioned along the capillary at 10 cm from each end. The polyimide-coated fused silica capillary used in all experiments was 40 cm long (effective lengths of 10 and 30 cm from the injection side) and 50 µm i.d. × 375 µm o.d. (Agilent, Folsom, CA, USA). All experiments were carried out using the first detector (effective length of 10 cm). Prior to use, at the beginning of each day, the capillary
was flushed with deionized water for 10 min, 0.1 mol L-1
Results and discussion
In this study, the target group of analytes were AA (pKa = 4.4 and 11.2), CAF (pKa = 0.6 and 14), DIP (pKa = −1.2), MEP (pKa = 8.8), ORP (pKa = 8.9), and SCO (pKa = 7.8). Due to the existence of synergistic effects, pharmaceutical products containing either DIP or a mixture containing one (DIP + SCO), two (DIP + CAF + ORP) or three (DIP + MEP + CAF + AA) active pharmaceutical ingredients can be found commercially available. According to their pKa values, almost all compounds (except to CAF) can exist in their ionic form in aqueous solutions in
the pH range (3 to 12) commonly used in capillary zone electrophoresis (CZE). AA and DIP exist in their anionic forms and MEP, ORP, and SCO in their cationic forms. In order to carry out the complete analysis in a single run, a condition that allows simultaneous separation of cations and anions needed to be used. The strategy adopted in the present work for fast determination of these compounds using a regular CE system was the use of high-magnitude
normal electroosmotic flow – EOF (pH ≥ 7.5; fused silica
capillary column). In this condition, cations are carried to the detector in co-EOF-mode (EOF + electrophoretic mobility) and anions with low mobility in counter-EOF-mode (EOF mobility >> analyte electrophoretic mobility) and
can be detected immediately after the EOF marker (C4D).
However, CAF is a neutral species in the pH range commonly used in CE and, to our knowledge, its analysis is only possible by capillary zone electrophoresis if DMX is used in the BGE composition in order to generate an anionic
complex.31 Briefly, CAF–DMX forms an anionic complex
(association constant = 15.7 kg mol-1) and can be described as a 1:1 hydrophobically bound π-molecular complex, similar
to CAF–chlorogenate.32
Different BGEs containing DMX and with buffering capacity around pH 8.0 were tested for this purpose (DMX/Tris, DMX/histidine and DMX/TEA). Among these,
the BGE composed of 12 mmol L-1 of TEA and 10 mmol L-1
of DMX (pH = 8.5) presented a better performance. Figure 2 presents electropherograms of standard solutions Figure 1. Scheme of the configuration of the CE-C4D instrument. µ
eo:
electroosmotic mobility; µep: electrophoretic mobility; µef: effective
mobility; E: separation voltage.
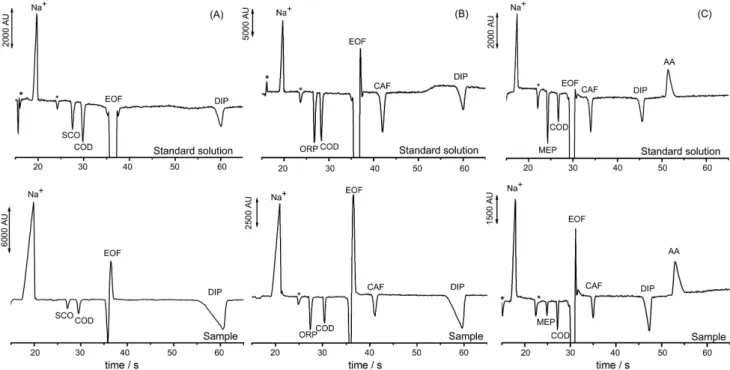
Figure 2. Electropherograms obtained for standard solutions containing (A) SCO (0.50 mmol L-1) and DIP (1.5 mmol L-1); (B) ORP (0.75 mmol L-1), CAF,
and DIP (1.5 mmol L-1 each); (C) MEP (0.75 mmol L-1), CAF, DIP (1.5 mmol L-1 each), and AA (2.0 mmol L-1). Eletropherograms for sample solutions
with similar compositions are also presented. COD(IS) at 0.7 mmol L-1 was added in each solution; BGE: 12 mmol L-1 TEA/ 10 mmol L-1 DMX (pH = 8.5);
containing (A) SCO and DIP (0.50 and 1.5 mmol L-1, respectively), (B) ORP, CAF, and DIP (0.75, 1.5, and
1.5 mmol L-1, respectively), and (C) MEP, CAF, DIP,
and AA (0.75, 1.5, 1.5, and 2.0 mmol L-1, respectively).
This study was carried out with solutions with three different compositions, in accordance with the presence of their active ingredients in three different commercial pharmaceutical formulations. Typical electropherograms for the analysis of three different pharmaceutical samples (diluted appropriately in water) with similar composition to the respective standard solutions are also presented in Figure 2. In all the electropherograms, COD (0.70 mmol L-1) was used as internal standard (IS).
As can be observed in Figure 2, the electropherograms of the analysis of the three sample solutions are very similar to the electropherograms acquired for its respective standard solutions. Furthermore, it can also be seen that the migration times of MEP, ORP, and SCO are very close, and therefore, if these compounds are present in the same solution, no adequate resolution will be obtained. However, to our knowledge, these compounds are not commercially available in the same drug formulation. Therefore, the
CE-C4D methods here proposed can be used for quality
control of these specific samples.
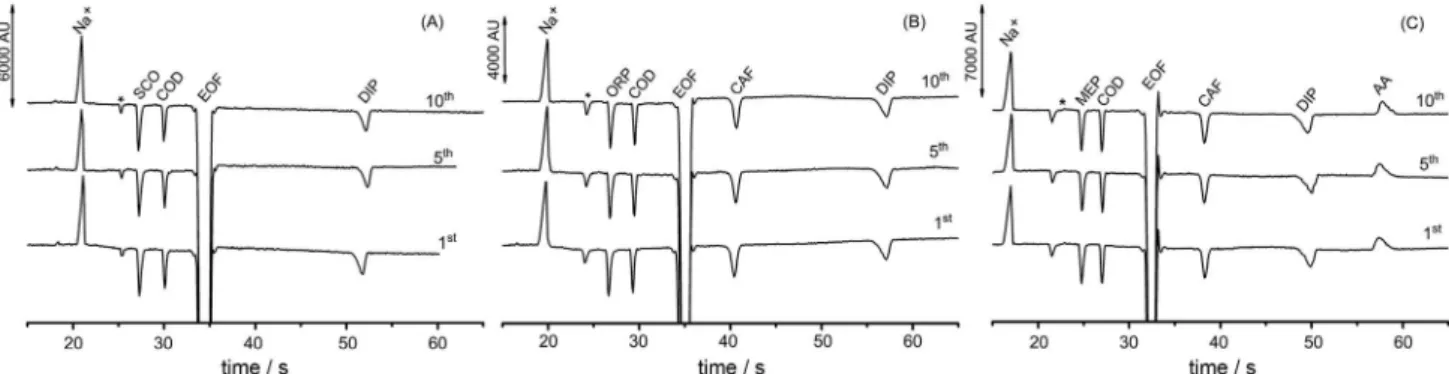
The effect of the applied separation voltage (+15 to +25 kV) and the hydrodynamic injection time (from 0.3 to 1.5 s) were also studied in order to obtain the best instrumental conditions in the CE experiments. The applied potential of +25 kV and the injection time of 0.5 s (25 kPa) yielded the best compromise in terms of efficiency separation, resolution, signal-to-noise ratio (SNR), and analysis time. In the next step, the precision of the proposed methods were evaluated by ten consecutive runs of standard solutions containing similar composition of the three commercially available samples (Figure 3). The results obtained for each standard solution in the same day and with the same capillary column length were considered as intra-day precision and the results obtained for each standard solution in different days and with different column lengths (40 ± 5 cm) were considered as inter-day precision. Table 1 shows the obtained results.
As can be observed, low SD values were obtained in all studies. In intra-day precision, the RSD values were lower than 2, 4, and 5% for migration time, peak area,
Table 1. Intra-day (mean ± SD; n = 10) and inter-day (mean ± SD; n = 3) precision of the proposed methods
Sample Analyte Migration time / s Peak area Resolution
a
Intra-day Inter-day Intra-day Inter-day Intra-day Inter-day
i SCO 27 ± 1 28 ± 1 1.57 ± 0.03 1.49 ± 0.12 1.5 ± 0.1 1.5 ± 0.1
DIP 52 ± 1 57 ± 3 1.28 ± 0.02 1.41 ± 0.16 6.1 ± 0.2 6.7 ± 0.4
ii
ORP 27 ± 1 27 ± 1 1.42 ± 0.05 1.38 ± 0.15 1.7 ± 0.1 1.7 ± 0.2
CAF 41 ± 1 42 ± 1 1.58 ± 0.03 1.70 ± 0.10 2.1 ± 0.1 2.1 ± 0.1
DIP 57 ± 1 60 ± 1 1.50 ± 0.05 1.34 ± 0.08 6.8 ± 0.2 7.0 ± 0.3
iii
MEP 25 ± 1 25 ± 1 1.17 ± 0.02 1.59 ± 0.06 2.0 ± 0.1 1.9 ± 0.3
CAF 38 ± 1 36 ± 2 1.38 ± 0.03 1.52 ± 0.12 2.5 ± 0.2 2.2 ± 0.3
DIP 50 ± 1 44 ± 4 1.42 ± 0.04 1.59 ± 0.22 5.4 ± 0.3 5.0 ± 0.5
AA 58 ± 1 53 ± 2 1.16 ± 0.05 1.10 ± 0.06 2.8 ± 0.2 2.4 ± 0.2
aResolution between the corresponding and previous peak.
Figure 3. Electropherograms obtained for successive injections (n = 10) of a standard solution containing of (A) SCO + DIP (0.75 and 1.50 mmol L-1,
respectively), (B) ORP + CAF + DIP (0.75, 1.50, and 1.50 mmol L-1, respectively), and (C) MEP, CAF, DIP + AA (0.75, 1.50, 1.50, and 2.00 mmol L-1,
Table 2. Analytical parameters of the proposed method
Analyte Work range / (mmol L-1) r
LODa /
(mmol L-1) LOQb
SCO 0.10-0.50 0.997 0.02 0.10
DIP 0.50-2.50 0.998 0.05 0.16
ORP 0.25-1.25 0.995 0.03 0.10
CAF 0.50-2.50 0.998 0.06 0.19
MEP 0.25-1.25 0.998 0.03 0.10
AA 1.00-3.00 0.993 0.07 0.21
aLimit of detection (S/N = 3); blimit of quantification (S/N = 10).
Figure 4. Electropherograms obtained from injection of standard solutions containing increasing concentrations of (A) SCO (from 0.10 to 0.50 mmol L-1)
and DIP (from 0.5 to 2.5 mmol L-1), (B) ORP (from 0.25 to 1.25 mmol L-1), CAF (from 0.5 to 2.5 mmol L-1) and DIP (from 0.5 to 2.5 mmol L-1), (C) MEP
(from 0.25 to 1.25 mmol L-1), CAF (from 0.5 to 2.5 mmol L-1), DIP (from 0.5 to 2.5 mmol L-1) and AA (from 1.0 to 3.0 mmol L-1). For other conditions,
see Figure 2.
and resolution, respectively. In inter-day studies, the RSD values were lower than 9, 14, and 15% for migration time, peak area, and resolution, respectively.
In order to evaluate the limits of the linear range of the proposed method, solutions containing increasing concentrations of the target analytes were analyzed. In this study, a linear response (r > 0.988) was obtained for all analytes in the following concentration ranges:
ESC (0.05-2.0 mmol L-1), DIP (0.1-4.0 mmol L-1), ORF
(0.05-2.0 mmol L-1), CAF (0.1-4.0 mmol L-1), MEP
(0.05-2.0 mmol L-1), and AA (0.25-4.5 mmol L-1). However, in the analysis of commercial samples, calibration curves were constructed in a lower concentration range (work range). In this condition, better correlation coefficients were obtained for all analytes (r > 0.993). Figure 4 presents electropherograms corresponding to the injection of standard solutions containing increasing concentrations of (A) SCO and DIP, (B) ORP, CAF and DIP, and (C) MEP, CAF, DIP and AA.
The analytical parameters obtained from the results presented in Figure 4 are shown in Table 2.
It was observed a good linearity for all analytes in their respective concentration ranges (r > 0.993). In addition, the obtained limits of detection can be considered adequate for pharmaceutical samples analysis, since low detection
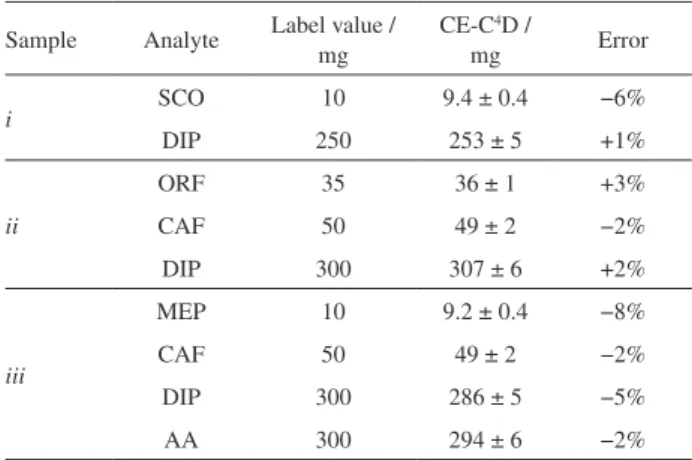
Table 3. Concentration of the target analytes in three pharmaceutical samples obtained by CE-C4D (n = 3)
Sample Analyte Label value / mg
CE-C4D /
mg Error
i SCO 10 9.4 ± 0.4 −6%
DIP 250 253 ± 5 +1%
ii
ORF 35 36 ± 1 +3%
CAF 50 49 ± 2 −2%
DIP 300 307 ± 6 +2%
iii
MEP 10 9.2 ± 0.4 −8%
CAF 50 49 ± 2 −2%
DIP 300 286 ± 5 −5%
AA 300 294 ± 6 −2%
Error: 100 × (CE-C4D – label value) / label value.
limits are not required. Table 3 shows the results obtained for the analysis of three pharmaceutical samples with their respective standard deviations (n = 3).
As can be observed, the obtained results were similar to those reported in the package insert (label values) and suggest that the composition of the pharmaceutical samples was correct.
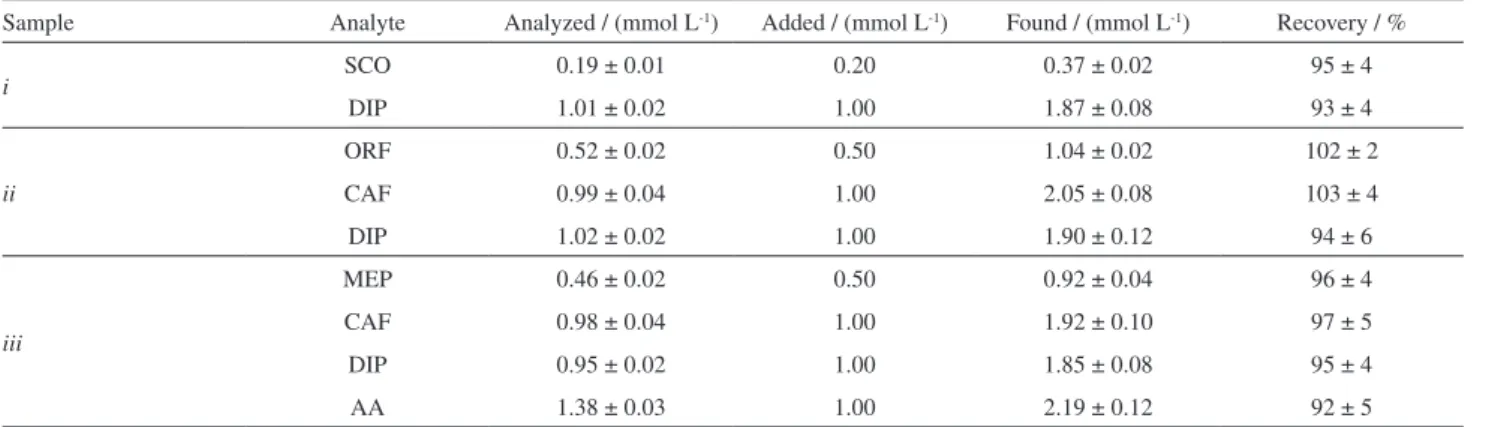
In addition, in order to evaluate the accuracy of the proposed methods, recovery tests using pharmaceutical samples individually spiked with each analyte were also performed. In this study, samples were diluted appropriately and analyzed without and with the addition of 0.20, 0.50 or 1.00 mmol L-1 of each analyte. The recovery values for the spiked samples are shown in Table 4.
Additionally, the results obtained with the proposed
CE-C4D method were compared with previous studies
also conducted with separation techniques, as liquid 13
and gas chromatography,19 and micellar electrokinetic
capillary chromatography (MEKC).18 Firstly, it is
important to emphasize that these methods only allow simultaneous determination of some of these compounds,
as DIP and CAF,13 CAF and AA,18 and CAF and MEP.19
Only the CE method here proposed enables the quality control of the three pharmaceutical samples with the
corresponding composition: (i) SCO + DIP, (ii) ORP +
CAF + DIP, (iii) MEP + CAF + DIP + AA. The linear
ranges and detection limits obtained with the proposed CE method are higher to those reported in previous studies
using chromatography,13,19 and similar to that obtained
by MEKC.18 For this reason, the proposed CE method,
if compared with chromatography, has disadvantages for analysis of samples with low concentrations of the target molecules (ca. in biological samples). However, in pharmaceutical analysis, low detection limits are often not
required. In addition, the new CE-C4D method proposed
here is faster (60 h-1) than chromatography (7 h-1)13 and
MEKC (6 h-1)18, less expensive (use of homemade CE
equipment), and has significantly lower consumption of samples and reagents than chromatography.
Conclusions
A simple and low-cost CE-C4D method for fast
determination of DIP in the presence of other five active ingredients (SCO, ORP, MEP, CAF, and AA) was developed. To our knowledge, it is the first time that an analytical method is proposed to separate and quantify all these compounds.
The new CE-C4D method have several desirable features,
such as short analysis time (less than 1 minute per analysis), low reagents and samples consumption, good precision, and
simple sample preparation steps (dilution + filtration). In the proposed work, a homemade CE instrument with a low cost detector was used, therefore, it can be regarded as a low-cost analysis system.
Acknowledgments
The authors are grateful to CNPQ (process number 472465/2012-0), CAPES and FAPEMIG (process numbers APQ-01430-11 and PPM-00503-13) for financial support.
References
1. dos Santos, W. T. P.; Gimenes, D. T.; de Almeida, E. G. N.; Eiras, S. P.; Albuquerque, Y. D. T.; Richter, E. M; J. Braz. Chem. Soc. 2009, 20, 1249.
2. Ergun, H.; Frattarelli, D. A.; Aranda, J. V.; J. Pharm. Biomed. Anal. 2004, 35, 479.
3. Perez-Estrada, L. A.; Malato, S.; Aguera, A.; Fernández-Alba, A. R.; Catal. Today 2007, 129, 207.
4. Sawynok, J.; Pain 2011, 152, 726.
5. Lal, A.; Pandey, K.; Chandra, P.; Pande, S. B.; Anaesthesia
1973, 28, 43.
6. Melo, C. A. D.; Silva, P.; Gomes, A. A.; Fernandes, D. D. S.; Véras, G.; Medeiros, A. C. D.; J. Braz. Chem. Soc. 2013, 24, 991.
7. Boros, B.; Farkas, A.; Jakabová, S.; Bacskay, I.; Kilár, F.; Felinger, A.; Chromatographia 2010, 71, 43.
8. Fitzsimons, C. P.; Monczor, F.; Fernández, N.; Shayo, C.; Davio, C.; J. Biol. Chem. 2004, 279, 34431.
9. Dalmasso, P. R.; Pedano, M. L.; Rivas, G. A.; Sensor. Actuat. B-Chem. 2012, 173, 732.
10. Matias, F. A. A.; Vila, M.; Tubino, M.; J. Braz. Chem. Soc. 2004,
15, 327.
11. Matos, R. C.; Angnes, L.; Araújo, M. C. U.; Saldanha, T. C. B.;
Analyst 2000, 125, 2011. Table 4. Recovery values for the analysis of spiked pharmaceutical samples suitably diluted (n = 3)
Sample Analyte Analyzed / (mmol L-1) Added / (mmol L-1) Found / (mmol L-1) Recovery / %
i SCO 0.19 ± 0.01 0.20 0.37 ± 0.02 95 ± 4
DIP 1.01 ± 0.02 1.00 1.87 ± 0.08 93 ± 4
ii
ORF 0.52 ± 0.02 0.50 1.04 ± 0.02 102 ± 2
CAF 0.99 ± 0.04 1.00 2.05 ± 0.08 103 ± 4
DIP 1.02 ± 0.02 1.00 1.90 ± 0.12 94 ± 6
iii
MEP 0.46 ± 0.02 0.50 0.92 ± 0.04 96 ± 4
CAF 0.98 ± 0.04 1.00 1.92 ± 0.10 97 ± 5
DIP 0.95 ± 0.02 1.00 1.85 ± 0.08 95 ± 4
AA 1.38 ± 0.03 1.00 2.19 ± 0.12 92 ± 5
12. Aburjai, T.; Amro, B. I.; Aiedeh, K.; Abuirjeie, M.; Al-Khalil, S.;
Pharmazie 2000, 55, 751.
13. Altun, M. L.; Turk. J. Chem. 2002, 26, 521.
14. de Souza, C. D.; Barea, L. M.; Kowacs, P. A.; Fragoso, Y. D.;
Expert Rev. Neurother. 2012, 12, 159.
15. Di Nezio, M. S.; Pistonesi, M. F.; Centurión, M. E.; Palomeque, M. E.; Lista, A. G.; Band, B. S. F.; J. Braz. Chem. Soc. 2007,
18, 1439.
16. Lau, O. W.; Luk, S. F.; Cheung, Y. M.; Analyst, 1989, 114, 1047. 17. Lourenção, B. C.; Medeiros, R. A.; Rocha-Filho, R. C.;
Fatibello-Filho, O.; Electroanalysis, 2010, 22, 1717.
18. Aucamp, J. P.; Hara, Y.; Apostolides, Z.; J. Chromatogr.A 2000,
876, 235.
19. Defabrizio, F.; J. Pharm. Sci. 1980, 69, 854.
20. Zemann, A. J.; Schnell, E.; Volgger, D.; Bonn, G. K.; Anal. Chem. 1998, 70, 563.
21. da Silva, J. A. F.; do Lago, C. L.; Anal. Chem. 1998, 70, 4339. 22. Elbashir, A. A.; Aboul-Enein, H. Y.; Biomed. Chromatogr. 2012,
26, 990.
23. Brito-Neto, J. G. A.; da Silva, J. A. S.; Blanes, L.; do Lago, C. L.; Electroanalysis 2005, 17, 1198.
24. Brito-Neto, J. G. A.; da Silva, J. A. S.; Blanes, L.; do Lago, C. L.; Electroanalysis 2005, 17, 1207.
25. Francisco, K. J. M.; do Lago, C. L.; Electrophoresis 2009, 30, 3458.
26. Gimenes, D. T.; Cunha, R. R.; Ribeiro, M. M. A. C.; Pereira, P. F.; Munoz, R. A. A.; Richter, E. M.; Talanta 2013, 116, 1026. 27. Cunha, R. R.; Gimenes, D. T.; Munoz, R. A. A.; do Lago, C. L.;
Richter, E. M.; Electrophoresis 2013, 34, 1423.
28. Piovezan, M.; Costa, A. C. O.; Jager, A. V.; de Oliveira, M. A. L.; Micke, G. A.; Anal. Chim. Acta 2010, 673, 200.
29. Vitali, L.; Horst, B. L.; Heller, M.; Fávere, V. T.; Micke, G. A.;
J. Chromatogr. A 2011, 1218, 4586.
30. Saito, R. M.; Brito-Neto, J. G. A.; Lopes, F. S.; Blanes, L.; Costa, E. T.; Vidal, D. T. R.; Hotta, G. M.; do Lago, C. L.; Anal. Method. 2010, 2, 164.
31. Nogueira, T.; do Lago, C. L.; Electrophoresis 2007, 28, 3570. 32. Horman, I.; Viani, R.; J. Food Sci. 1972, 37, 925.
33. Marra, M. C.; Cunha, R. R.; Vidal, D. T. R.; Munoz, R. A. A.; do Lago, C. L.; Richter, E. M.; J. Chromatogr. A 2014, 1327, 149.
34. Spinola, V.; Mendes, B.; Camara, J. S.; Castilho, P. C.; Anal. Bio. Chem. 2012, 403, 1049.