Article
*e-mail: [email protected]
Potentiometric Sensor for Furosemide Determination in Pharmaceuticals,
Urine, Blood Serum and Bovine Milk
Alberto O. Santini, Helena R. Pezza, Rodrigo Sequinel, José L. Rufino and Leonardo Pezza*
Instituto de Química, Universidade Estadual Paulista, CP 355, 14801-970 Araraquara-SP, Brazil
A construção, avaliação e aplicação analítica de um sensor potenciométrico do tipo PtHgHg2(Fur)2Grafite, onde Fur significa íon 4-cloro-N-furfuril-5-sulfamoil-antranilato, são
descritas. O eletrodo responde a Fur com sensibilidade de (−58,4 ± 0,9) mV década-1 no intervalo
de 5,0 × 10⁻⁷-1,0 × 10⁻² mol L-1, a pH 7,0-9,0 e com um limite de detecção de 3,8 × 10⁻⁷ mol L-1.
O eletrodo é facilmente construído e de baixo custo, apresenta um rápido tempo de resposta (10-20 s) e pode ser usado por um período de 6 meses sem qualquer variação considerável nas suas características de desempenho. O eletrodo proposto mostrou boa seletividade na presença de várias substâncias, bem como na presença de alguns carboxilatos e ânions inorgânicos. O eletrodo foi aplicado com sucesso na determinação de furosemida em medicamentos, urina, soro sanguíneo e amostras comerciais de leite bovino.
The construction, evaluation and analytical application of a potentiometric sensor, namely, PtHgHg2(Fur)2Graphite, where Fur stands for 4-chloro-N-furfuryl-5-sulphamoyl-anthranilate
ion, are described. This electrode has a linear dynamic range between 5.0 × 10⁻⁷-1.0 × 10⁻² mol L-1
with a near-Nernstian slope of (–58.4± 0.9) mV decade-1 and a detection limit of 3.8 × 10⁻⁷ mol L-1.
The potentiometric response is independent of the pH of the solution in the pH range 7.0-9.0. The electrode shows easy construction, low-cost, fast response time (within 10-20 s) and can be used for a period of 6 months without significant change in its performance characteristics. The proposed sensor displayed good selectivities over a variety of other anions (carboxylates and inorganic anions). Application of this potentiometric sensor for the furosemide determination in pharmaceuticals, urine, blood serum and commercial milk samples is reported.
Keywords: 4-cloro-N-furfuryl-5-sulphamoylanthranilate-sensitive electrode, potentiometry,
pharmaceuticals, urine, human blood serum, bovine milk
Introduction
Furosemide or frusemide (HFur, 4-chloro-N-
furfuryl-5-sulphamoyl-anthranilic acid) is formally a sulfonamide, an antibacterial agent (Figure 1). However, the intense and fast dieresis produced by this drug has extended its application as a powerful acidic diuretic for diverse treatments in humans and veterinary medicine. Furosemide is often classified as a loop diuretic due to its predominant action in the nephron, where the drug interferes with the tubular re-absorption of
sodium on Henle’s loop.1 The renal excretion of ions is not
limited to sodium and chloride, but it may also influence potassium, magnesium, calcium and, to a lesser extent,
hydrogen carbonate ions.2 In the clinical practice, the effects
of furosemide are applied in the treatment of edema associated
with pulmonary, cardiac, hepatic and renal disease, and of hypertension accompanied by fluid retention or impaired
renal failure.3-7 A marked diuresis is also associated to loss
of weight, a side effect that has been incorrectly abused in the sport practice to achieve acute weight losses before competition, usually where weight categories are involved. Intense and fast diuresis may also mask the ingestion of other
doping agents by reducing their concentration in urine.8 For
this reason, the Medical Commission of the International Olympic Committee banned the use of furosemide among
other diuretics in 1986.9 Furosemide is approved for use
in cattle for the treatment of physiological parturient
edema of the mammary gland and associated structures.10
Consequently, harmful residue concentrations can be found in milk for human consumption.
that permit the determination of this diuretic drug in pharmaceuticals and biological samples (milk, urine,
plasma and serum).11,12
These methods include spectrophotometry,13-18
variable-angle scanning fluorescence spectrometry,19
spectrofluorimetry,20,21 diffuse reflectance spectroscopy,22
potentiometry,23 voltammetry,24 chromatography,25-35
capillary electrophoresis,36-39 and flow-injection analysis.40,41
However, many of these methods are often time-consuming, technically demanding and require the use of costly, highly specialized instruments. Thus, there is an important demand for simple, low-cost, sensitive and rapid alternative methods for the determination of HFur in pharmaceuticals and biological samples.
Potentiometric methods with ion-selective electrodes (ISE’s) have proved to be effective for the analysis of pharmaceuticals and biological samples, because these sensors offer the advantages of simple design, construction, and manipulation, reasonable selectivity, fast response time, applicability to colored and turbid solutions and possible
interfacing with automated and computerized systems.42,43
To the best of our knowledge, there is a single report on the use of ion-selective potentiometric sensor for the determination of HFur whose application was focused
in the analysis of pharmaceutical preparations.44 This
electrode was constructed by incorporating the furosemide-aliquat ion pair complex into a poly(vinylchloride) (PVC) membrane. The electrode responded to HFur with
sensitivity of −58.9 mV decade-1 over the range 1.00 × 10⁻²
to 1.50 × 10⁻⁴ mol L-1 at pH 9.6 (borate buffer). The proposed
sensor exhibited a detection limit of 1.19 × 10⁻⁴ mol L-1 and
had an operative life of 3 months.
The present work describes the development and application of a simple, and low-cost potentiometric
4-cloro-N-furfuryl-5-sulphamoyl-anthranilate ion sensor
immobilized in a graphite matrix (PtHgHg2(Fur)2Graphite,
where Fur stands for 4-cloro-N-
furfuryl-5-sulphamoyl-anthranilate ion) for the determination of the loop diuretic furosemide in pharmaceuticals, urine, blood serum and commercial milk samples. The proposed sensor has the advantages of simplicity, versatility, fast response, fair stability and repeatability and low detection limit.
Experimental
Reagents
High purity deionized water (resistivity 18.2 MΩ cm)
obtained by using a Milli-Q Plus system (Millipore Corp., Bedford, MA, USA) was used throughout. All reagents employed were of analytical grade and obtained from E. Merck (Darmstadt, Germany) except furosemide, which was supplied by Sigma (St. Louis, MO, USA).
Stock solution of the sodium salt of furosemide (NaFur) was prepared in a manner similar to a previously reported
procedure for preparation of sodium naproxenate.45 This
NaFur stock solution was analyzed by evaporating and
drying to constant weight at 120 oC.
Standardizations of carbonate-free sodium hydroxide, nitric acid and sodium nitrate solutions were performed
as described elsewhere.46,47 Metallic mercury was
purified according to a previously reported procedure.46
Hg2(Fur)2 was prepared by mixing, in aqueous solution,
the corresponding nitrate with an excess of NaFur. The resulting precipitate was filtered through a sintered glass funnel, washed with deionized water until nitrate free, and then dried in a desiccator, over calcium chloride under reduced pressure, at room temperature, to constant mass. An orange powder was obtained as the final product.
Electrodes preparation and conditioning
The Hg2(Fur)2 indicator electrodes were prepared as
follows: Hg2(Fur)2 (1.8 g) and metallic mercury (ca. 0.3 g)
were mixed in an agate mortar and the material was crushed until a homogeneous solid was obtained. Pure powdered graphite (1 to 2 µm particle size, Aldrich, USA) was then added in different proportions (20-60% graphite, m/m) and the crushing process was continued until perfect homogenization was attained. Part of the resulting solids was transferred to a press mold, being compressed at 9 tons for about 6 min. The black pellets (external diameter 12 mm) obtained were fixed in the tip of a glass tube (external diameter 12 mm and length 8 cm) with a silicone-rubber glue (“Rhodiastic”, Rhône-Poulenc, France) and allowed
to dry for 48 h. Sufficient metallic mercury (ca. 0.6 g) was
then introduced into each glass tube to produce a small pool on the inner pellet surface; electric contact was established through a platinum wire plunged into the mercury pool and a subsequent conductor cable. These electrodes are sealed,
using the procedure previously reported by the authors.48-50
The electrodes had a geometric area of ca. 0.79 cm2.
Previous studies of the authors involving the construction and caracterization of similar mercury (I)-carboxylate
electrodes have demonstrated that the sensitivity and the linear concentration range for each sensor tested were practically independent of the electrode area. Similar behavior involving solid contact potassium-selective
electrodes has been reported by Gyurcsányi et al.51
Elemental mercury and its compounds are potentially toxic (all forms of mercury can enter the body) and as such are considered to be hazardous wastes. For this reason, safety precautions were adopted in the manipulation and disposal of metallic mercury and mercury(I) compounds. All operations involving the use and manipulation of metallic mercury and mercury(I) compounds were conducted in a laboratory hood that has been evaluated for adequate face velocity and proper operation. During the handling of metallic mercury and mercury(I) compounds the operator has used safety glasses, appropriate protective clothing and latex or nitrile gloves. The metallic mercury and mercury(I) compounds were disposed in appropriate containers (marked appropriately) and removed periodically by a specialized disposal company. The safety precautions previously mentioned prevent or at least reduce considerably the operator’s exposition to metallic mercury and mercury(I) compounds. Therefore, the proposed sensors do not offer significant risk to the operator’s health and thus are recognized as safe.
When not in use, the electrode’s pellets were kept
immersed in a small volume of 0.010 mol L-1 NaFur
solution (pH = 8.5) whose ionic strength (µ) was adjusted
to 0.500 mol L-1 with a sodium nitrate solution. Before
carrying out each experiment, the external surface of the aforementioned pellets were washed with deionized water and dried with absorbent paper.
Instruments
The electromotive force (emf) values were read to the
nearest 0.1 mV with a Metrohm model 692 pHion meter
(Metrohm Ltd., Herisau, Switzerland).
The reference electrode was a Metrohm AgAgCl
double junction, model 6.0726.100. The pH of aqueous solutions was adjusted and monitored with the aid of a Metrohm pH electrode, model 6.0234.100. A thermostated
titration cell (25.0 ± 0.1 oC) was employed.
The standard procedure of the United States Pharmacopeia (USP) employed for the assay of furosemide
in dosage forms utilizes a HPLC method.25
Chromatographic analysis were carried out on a Shimadzu model SPD-10A liquid chromatograph (Shimadzu Seisakusho, Kyoto, Japan), equipped with a LC-10 AS pump (Shimadzu), variable UV-Visible detector (model SR-10A, Shimadzu) set at 254 nm, gradient control (Waters, model
680; Waters Chromatography Div., Milford, MA, USA) and a “Rheodyne” 20 µL injector (Rheodyne, Inc., Berkeley, CA, USA). A stainless steel “Microsorb LC-18” analytical column (250 mm × 4.6 mm i.d., Varian, Walnut Creek, CA, USA) with 5 µm particle size packing material was used. Before injection the samples were filtered through a Millex unit (Millex-HV, 0.45 µm, Millipore). Chromatograms were recorded and the areas were measured with an integrator (Shimadzu, model C-R6A Chromatopac).
Volume measurements (± 0.001 mL) were performed using a Metrohm model 665 automatic burette.
All experiments were performed in a thermostated
room, maintained at 25 ± 1 oC.
Potentiometric cell
The following cell was used,
where Fur stands for 4-cloro-N-
furfuryl-5-sulphamoyl-anthranilate ion and × was in the range 1.00 × 10⁻²-1.00 ×
10-7 mol L-1. The ionic strength (µ) of the cell compartments
was kept constant at 0.500 mol L-1. The outer compartment
of the reference electrode was refilled periodically with
fresh NaNO3 solution.
The performance of the Hg2(Fur)2 electrodes were
assessed by measuring the emf of the aforementioned
cell for 1.00 × 10⁻² to 1.00 × 10⁻⁷ mol L-1 NaFur solutions.
These solutions were freshly prepared by serial dilution
of a 2.00 × 10⁻² mol L-1 stock standard solution with
deionized water, at constant pH (8.5 ± 0.1) and µ adjusted
to 0.500 mol L-1 with NaNO
3. The emf readings were
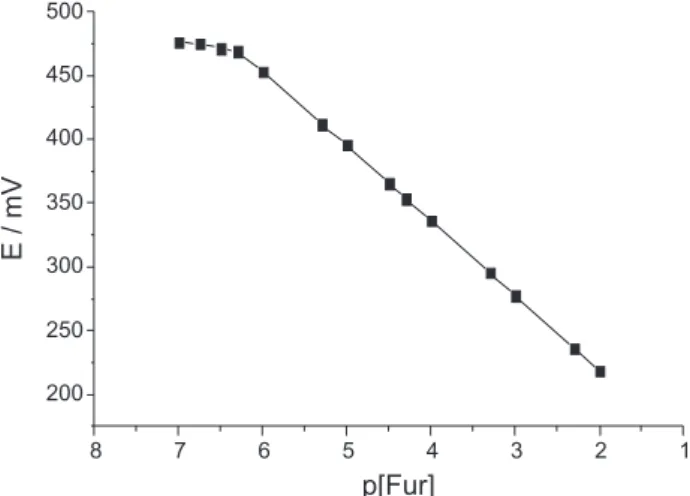
obtained for solutions under stirring and recorded when they became stable. A typical calibration plot of an electrode with composition of 50% (graphite, m/m) is shown in Figure 2.
Determination of furosemide in pharmaceuticals
The analyzed products were purchased locally or directly from the manufacturers and all were tested prior to the listed expiration date. Six pharmaceutical formulations (tablets) containing furosemide (HFur) and other components were analyzed with the Fur-sensitive electrode.
Representative samples of finely ground tablets containing a quantity equivalent to about 25 mg of HFur was accurately weighed and placed in a glass vessel; 50 mL
of 10-2 mol L-1 NaOH was added and magnetically stirred
(-) AgAgCl [NaCl](aq) = 0.010 mol L-1
[NaNO3](aq) = 0.500 mol L-1
[NaFur](aq) = x mol L-1
GraphiteHg2(Fur)2 HgPt (+) [NaNO3](aq) =
0.490 mol L-1
for 10 min. The resulting mixture was filtered and its ionic
strength was adjusted to 0.500 mol L-1 with NaNO
3 and
the pH to 8.5 ± 0.1 with 10-2 mol L-1 HNO
3 or 10-2 mol L-1 NaOH before volume completion. The resulting solution was quantitatively transferred to a 100 mL volumetric flask using deionized water (pH = 8.5 ± 0.1) for rinsing and volume completion. An aliquot of 20 mL is employed for analysis with the Fur-sensitive electrode.
Determination of furosemide in human urine samples
Drug-free human urine used in this study was obtained from healthy volunteers. The urine was centrifugated at 4000 × g, filtered through filter paper and kept frozen
(−20 oC) pending analysis.
The extraction procedure of HFur used here was a
modification of the technique reported by Barroso et al.24
To a 5 mL of spiked human urine with different quantities
of HFur, 5 mL of 1.0 mol L-1 H
3PO4 was added and mixed
for 60 s. The samples were then extracted with 10 mL of ethyl acetate, vortex mixed for 10 min and centrifuged at 10.000 rpm ( 8500 × g ) for 3 min. The organic phase was then transferred to an appropriate flask and evaporated in a rotary evaporator under reduced pressure to dryness. The
residue was dissolved in 10 mL of 0.500 mol L-1 NaNO
3 (pH = 8.5 ± 0.1) and an aliquot of 8 mL of the solution was employed for analysis with the Fur-sensitive electrode using the standard additions method (multiple addition method).
Determination of furosemide in human blood serum samples
Drug-free human serum used in this study was obtained from healthy volunteers. The serum was kept in a freezer
at −20 oC until analysis.
The extraction procedure of HFur used here was a modification of the technique reported by Abou-Auda
et al.52 To a 5 mL of spiked human serum with different
quantities of HFur, 5 mL of 2.0 mol L-1 phosphoric acid
was added and mixed for 75 s. The samples were then extracted with 15 mL of ethyl acetate, vortex mixed for 5 min and centrifuged at 10.000 rpm (8500 × g) for 3 min. The organic phase was then transferred to an appropriate flask and evaporated in a rotary evaporator under reduced pressure to dryness. The residue was dissolved in 10 mL
of 0.500 mol L-1 NaNO
3 (pH = 8.5 ± 0.1) and an aliquot of
8 mL of the solution was employed for analysis with the Fur-sensitive electrode using the standard additions method (multiple addition method).
Determination of furosemide in commercial milk samples
Commercial milk samples were purchased in a local
supermarket. The milk samples were refrigerated at 4 oC
if not analyzed immediately.
The extraction procedure of HFur adopted was a
modification of the procedure reported by Guzmán et al.41 To
25.0 mL of skimmed milk samples spiked with 150 ng mL-1
of HFur, 5 mL of 2.0 mol L-1 phosphoric acid was added and
mixed for 90 s. The samples were then extracted with 50 mL of ethyl acetate, vortex mixed for 3 min and centrifuged at 10.000 rpm (8500 × g) for 3 min. The organic phase was then transferred to an appropriate flask and evaporated in a rotary evaporator under reduced pressure to dryness. The
residue was dissolved in 10 mL of 0.500 mol L-1 NaNO
3 (pH = 8.5 ± 0.1) and an aliquot of 8 mL of the solution was employed for analysis with the Fur-sensitive electrode using the standard additions method (multiple addition method).
Results and Discussion
Effect of the graphite content in the composite on the electrode response
Different pellet compositions (20-60% graphite, m/m) were tried for use as sensors in the composed electrodes (Table 1). Experiments carried out as described under “Potentiometric Cell” led to the following linear relationship between the measured emf (E, in mV) and Fur ion concentration:
E = E0 - S log [Fur]
where E0 is the formal cell potential and S represents
the Nernst coefficient (59.16 mV decade-1, at 25 oC, for
monovalent ions).
Figure 2. Calibration graph for the Fur-sensitive electrode with composition of 50% (Graphite, m/m). Experimental conditions: pH = 8.5, µ = 0.500 mol L-1 adjusted with NaNO
It was found that the Fur-sensitive electrode with composition of 50% (graphite, m/m) responds perfectly to
the Fur with a S value of 58.4 mV decade-1 and the widest
linear concentration range (5.0 × 10⁻⁷-1.0 × 10⁻² mol L-1).
For electrodes with compositions of 40 and 60% (graphite,
m/m) Nernst coefficients of 55.1 and 56.8 mV decade-1
were observed but for a shorter linear concentration range
(2.5 × 10⁻⁶-1.0 × 10⁻² mol L-1). The electrode with
composition of 20% (graphite, m/m) presents the lowest
slope (45.2 mV decade-1) for a linear concentration range
(1.0 × 10⁻⁵-1.0 × 10⁻² mol L-1).
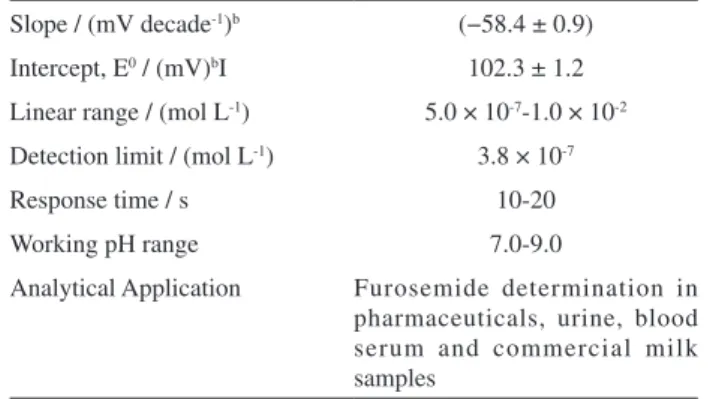
Potentiometric parameters and other features associated
with the Hg2(Fur)2 electrode with 50% graphite (m/m) are
given in Table 2. The calibration equation and the slope value (Table 2) show that the mentioned electrode provides a
near-Nernstian response to the Fur ion in the range of 1.0 × 10⁻² to
5.0 × 10⁻⁷ mol L-1. The detection limit, as determined from
the intersection of the two extrapolated segments of the
calibration graph (Figure 1), was 3.8 × 10⁻⁷ mol L-1.53 The
sensor response displayed good stability and repeatability over the tests; the last mentioned feature is illustrated by the standard deviation values shown in Table 2.
For the reasons previously mentioned the Fur-sensitive electrode with composition of 50% (graphite, m/m) was chosen to perform all of the following studies.
Response time and lifetime of the electrode
For analytical applications, the response time and the lifetime of a sensor are of critical importance. According to IUPAC recommendations, the response time may be defined as the time between the addition of analyte to the sample solution and the time when a limiting potential has
been reached.53
The response time of the electrode was tested by measuring the time required to achieve a steady state
potential (within ± 0.2 mV min-1), for 1.0 × 10⁻² to
1.0 × 10⁻⁶ mol L-1 NaFur solutions at pH 8.5.53 The
electrode yielded steady potentials within 10 to 15 s
at high concentrations (≥ 1.0 × 10⁻³ mol L-1) and about
20 s at concentrations near the detection limit. The experimental results show that the lifetime of the electrode was about 6 months, with a total of 620 determinations. During this period, the sensor was in daily use and was
stored in 0.010 mol L-1 NaFur solution (pH = 8.5 and
µ = 0.500 mol L-1 adjusted with NaNO
3) when not in use.
No significant change in working concentration range, slope and response time was observed during this period.
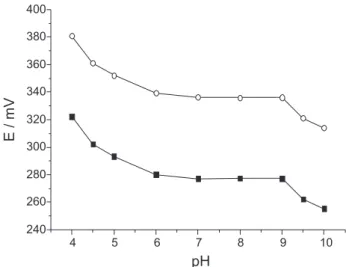
pH effect
The pH dependence of the potentials of the proposed electrode was tested over the pH range 4.0-10.0 for
1.0 × 10⁻³ and 1.0 × 10⁻⁴ mol L-1 Fur ion concentrations.
The resulting solutions’ pH(s) were adjusted with diluted
HNO3 or NaOH solutions. As it can be seen in Figure 3,
the potential response remains almost constant over the pH range 7.0-9.0 which can be taken as the working pH range of the electrode.
However, for pH values below 7.0, we observed the progressive precipitation of the free furosemide acid
(pKa=3.9),54 and protonation of the secondary amino groups
of the drug to form other species which are not detected by the electrode. For pH > 9.0, the hydroxide ion interferes with the electrode’s response. In high pH media, probably
OH− competes with Fur ion in the electrode process and
alters the potentiometric response of the proposed sensor.
Electrode selectivity
The potentiometric selectivity coefficient, which reflects the relative response of a sensor for the primary ion over
Table 1. Influence of the graphite content in the sensor pellet on the electrode responsea
Graphite content (%, m/m)
Slope / (mV decade-1)b
Linear range / (mol L-1)
20 (−45.2 ± 0.4) 1.0 × 10⁻⁵-1.0 × 10⁻²
40 (−55.1 ± 0.3) 2.5 × 10⁻⁶-1.0 × 10⁻²
50 (−58.4 ± 0.2) 5.0 × 10⁻⁷-1.0 × 10⁻²
60 (−56.8 ± 0.2) 2.5. × 10-6-1.0 × 10⁻²
aT = 25.0 ± 0.1 oC; pH = 8.5 ± 0.1; µ = 0.500 mol L-1 (NaNO
3). bAverage ±
standard deviation (SD) of six determinations.
Table 2. Potentiometric response characteristics of the Fur-sensitive sensor with composition of 50% (graphite, m/m)a
Slope / (mV decade-1)b (−58.4 ± 0.9)
Intercept, E0 / (mV)bI 102.3 ± 1.2
Linear range / (mol L-1) 5.0 × 10⁻⁷-1.0 × 10⁻²
Detection limit / (mol L-1) 3.8 × 10⁻⁷
Response time / s 10-20
Working pH range 7.0-9.0
Analytical Application Furosemide determination in pharmaceuticals, urine, blood serum and commercial milk samples
aT = 25.0 ± 0.1 oC; pH = 8.5 ± 0.1; µ = 0.500 mol L-1 (NaNO 3). bAverage value ± standard deviation (SD) of 58 determinations over
other ions, present in solution, is perhaps the most important characteristic of any ion sensitive sensor. The potentiometric
selectivity coefficients for the Fur-sensitive electrode (KFur,M)
were determined, for a number of anions (M), by the
matched potential method (MPM).55-57 In this method, the
selectivity coefficient is defined by the ratio of the activity of the primary ion relative to an interfering ion, when they generate identical potentials in the same reference solution. In the MPM method, both monovalent and divalent ions are treated in the same manner and the valence of the ions does not influence the selectivity coefficient. Furthermore, the MPM can be used with no regard to the electrode slopes
being Nernstian or even linear.58
The MPM-selectivity coefficients (KFur,M) were
determined under the following conditions: Initial reference
solution (pH = 8.5) contains 0.500 mol L-1 NaNO
3 as a
supporting electrolyte and 1.0 × 10⁻⁵ mol L-1 of the primary
ion (4-cloro-N-furfuryl-5-sulphamoyl-anthranilate).
The selectivity coefficients were calculated from the concentration of the interfering ion (M), which induced the
same amount of the potential change (∆emf = 15.0 mV) as
that induced by increasing the concentration of primary ion.
The resulting values of KFur,M are presented in Table 3.
The results comprised in the aforementioned Table 3
show that the selectivity of the Hg2(Fur)2 electrode towards
all tested organic acid anions is good. No interference was noted for most of the common excipients used in commercial formulations (tablets) such as glucose, lactose, starch, talc, magnesium stearate, ethylcellulose, microcrystalline cellulose, croscarmellose sodium and silicon dioxide. Drugs commonly used in veterinary such as oxytetracycline (antibiotic) and methylthiouracil (thyreostat drug) do not interfere in the determination of furosemide in commercial milk samples.
Sulfate and borate has a very low selectivity coefficient (Table 3); no interference at all is caused by nitrate or perchlorate and they can therefore be used as background
electrolytes or ionic strength adjusters for 4-cloro
-N-furfuryl-5-sulphamoyl-anthranilate solutions before performing potentiometric measurements.
Some interference by chloride ion might be expected as shown in Table 3. In the dosage forms analyzed in this work (tablets), chloride ion is seldom found and hence the proposed sensor can be used for direct determination of HFur in these samples without previous extraction procedures. Concerning the biological samples(milk, urine and human serum) analyzed by the potentiometric sensor, it should be noted that analytical procedure adopted in this work is based on ethyl acetate extraction of HFur from acidified biological matrices followed by its reversion to
the aqueous phase (0.500 mol L-1 NaNO
3(aq); pH = 8.5 ± 0.1)
as 4-cloro-N-furfuryl-5-sulphamoyl-anthranilate ion. The
chloride content found in the last mentioned aqueous phase (which originates from the analyses of milk, urine or human
blood serum) was always < 1 µg L-1, as analyzed by the
mercury thiocyanate method.59 Therefore, the working
procedure removes chloride interference.
Analytical application
In order to check the usefulness of the proposed sensor for resolving real samples, we addressed the determination of furosemide in pharmaceuticals and in complex samples as urine, blood serum and bovine milk using a standard
additions method (multiple addition method).60
Figure 3. Effect of pH on the electrode’s response at: () 1.0 × 10⁻³
mol L-1 Fur, () 1.0 × 10⁻⁴ mol L-1 Fur ; µ = 0.500 mol L-1 adjusted with
NaNO3 , T = 25 oC.
Table 3. Selectivity coefficients KFur,M for various anions
Anion KFur,M
Formate 1.8 × 10⁻⁴
Acetate 2.1 × 10⁻³
Propionate 3.2 × 10⁻³
Citrate 3.9 × 10⁻³
Lactate 2.9 × 10⁻³
Tartrate 2.3 × 10⁻³
Benzoate 3.0 × 10⁻³
Salicylate 3.3 × 10⁻³
Phtalate 2.8 × 10⁻³
Oxalate 2.6 × 10⁻³
Chloride 2.6 × 10⁻¹
Sulfate 2.8 × 10⁻⁵
Borate 1.6 × 10⁻⁵
Perchlorate no interference
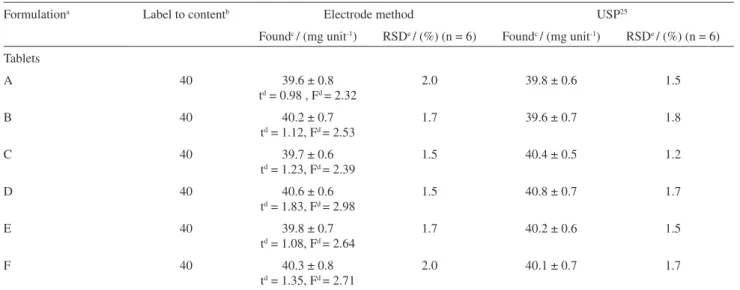
Table 4 shows statistical analysis of the results obtained by using the presently proposed Fur-sensitive electrode
and the official method of USP25 for HFur determination
in pharmaceuticals. In all cases, the calculated F and t
values did not exceed the theoretical values, indicating that there is no significant difference between either methods in
concerning accuracy (t-test) and precision (F-test).
In humans, HFur is mainly metabolized into acyl
glucuronides.21,61,62 In serum and urine, furosemide is the
predominant species.21,61 Taking into account the role of the
4-chloro-N-furfuryl-5-sulphamoyl-anthranilate ion (Fur) in the
electrode response, along with the low concentration of acyl
glucuronides in serum and urine,21,61 no interference from these
metabolites is expected in the determination of HFur in urine and human blood serum by the proposed sensor.
Experiments were performed to determine the feasibility of using the Fur- sensitive electrode for determination of HFur in urine and human serum samples. Urine and serum
samples previously spiked with HFur at four different concentrations were treated and analyzed as described under “Determination of Furosemide in Human Urine Samples” and “Determination of Furosemide in Human Blood Serum Samples”, respectively. The amounts of HFur added to each biological fluid (urine and human blood serum) were those usually found after administration of a
pharmaceutical dose.21,28,30-32,63,64 Commercial skimmed milk
samples were spiked with HFur at a concentration level of
150 ng mL-1 and treated following the procedure described
under “Determination of Furosemide in Commercial Milk Samples”. This aforementioned concentration is the mean concentration of diurethic that can be detected in the next 8 h after administration of the usual 500 mg dosage of drug.29,41
The recovery values of HFur in urine, serum and milk samples found by application of the proposed potentiometric
sensor and the comparative chromatographic methods29,52
Table 4. Determination of furosemide in commercial pharmaceutical formulations
Formulationa Label to contentb Electrode method USP25
Foundc / (mg unit-1) RSDe / (%) (n = 6) Foundc / (mg unit-1) RSDe / (%) (n = 6)
Tablets
A 40 39.6 ± 0.8
td = 0.98 , Fd = 2.32
2.0 39.8 ± 0.6 1.5
B 40 40.2 ± 0.7
td = 1.12, Fd = 2.53
1.7 39.6 ± 0.7 1.8
C 40 39.7 ± 0.6
td = 1.23, Fd = 2.39
1.5 40.4 ± 0.5 1.2
D 40 40.6 ± 0.6
td = 1.83, Fd = 2.98
1.5 40.8 ± 0.7 1.7
E 40 39.8 ± 0.7
td = 1.08, Fd = 2.64
1.7 40.2 ± 0.6 1.5
F 40 40.3 ± 0.8
td = 1.35, Fd = 2.71
2.0 40.1 ± 0.7 1.7
aThese contain many or all of the following substances: glucose, lactose, starch, talc, magnesium stearate, ethylcellulose, microcrystalline cellulose,
croscarmellose sodium and silicon dioxide. bDeclared concentration of furosemide in mg tablet -1. cValues found are the average of six independent
analyses (n = 6) ± the corresponding standard deviation (SD). Expressed as furosemide. dValues of t and F at 95% confidence level. Theoretical
values: t = 2.23 , F= 5.05. eRelative standard deviation (RSD).
Table 5. Determination of furosemide added to human urine samples
HFur added to human urinea /
(µg mL-1)
Electrode method Comparative method52
Foundb / (µg mL-1) Recovery / (%) Foundb / (µg mL-1) Recovery / (%)
0.50 0.48 ± 0.01 96.0 0.49 ± 0.01 98.0
1.00 0.98 ± 0.01 98.0 1.01 ± 0.02 101.2
2.00 2.03 ± 0.03 101.5 1.98 ± 0.02 99.0
4.00 3.97± 0.05 99.2 4.07 ± 0.04 101.7
aThe concentrations of HFur added to urine samples are those usually found after administration of the usual dose of furosemide.21,28,30-32bValues
are given in Tables 5, 6 and 7, respectively. Satisfactory recovery values for HFur in urine, blood serum and commercial milk samples were obtained indicating that the extraction procedures of the proposed method provided adequate selectivity and sensitivity to process the selected samples. Therefore, the proposed sensor can be used for the determination of HFur in pharmaceuticals, urine, blood serum and commercial milk samples.
Conclusions
The results obtained in the present work demonstrate
that the potentiometric method employing a Hg2 (Fur)2
electrode immobilized in a graphite matrix may provide an attractive alternative for the determination of furosemide.
The proposed potentiometric sensor is easy to prepare, exhibits long lifetime, shows high sensitivity and wide dynamic range. Good selectivity, very low detection limit, rapid response and low-cost of fabrication make this electrode suitable for analysis of HFur in pharmaceuticals, urine, blood serum and commercial milk samples. The electrode developed in this laboratory is superior (especially concerning lifetime, sensitivity and versatility) as compared with the furosemide selective electrode described in the literature.44
Acknowledgments
We would like to thank FAPESP, CNPq, CAPES and FUNDUNESP Foundations (Brazil), for financial support.
References
1. Delgado, J. N.; Remers, W. A.; Textbook of Organic Medicinal and Pharmaceutical Chemistry, 9th ed., J. B. Lippincot:
Philadelphia, 1991.
2. Foye, W. O.; Lemke, T. L.; Williams, D. A.; Principles of Medicinal Chemistry, 4th ed., Williams and Wilkins:
Philadelphia, 1995.
3. Shinto, R. A.; Light, R. W.; Am. J. Med.1990, 88, 230. 4. Modell, W.; Drugs of Choice, C.V. Mosby: Toronto, 1984. 5. Reynolds, E. F.; Martindale: The Extra Pharmacopoeia, 28th
ed., The Pharmaceutical Press: London, 1982.
6. Leary, W. P.; Asmal, A. C.; Curr. Ther. Res. Clin. Exp. 1980, 28, 549.
7. Kristensen, B. O.; Show, J.; Lancet1980, 2, 699. 8. Ventura, R.; Segura, J.; J. Chromatogr., B1996, 687, 127. 9. International Olympic Committee; Medical Commission,
International Olympic Charter against Doping in Sport, IOC: Lausanne, 1990.
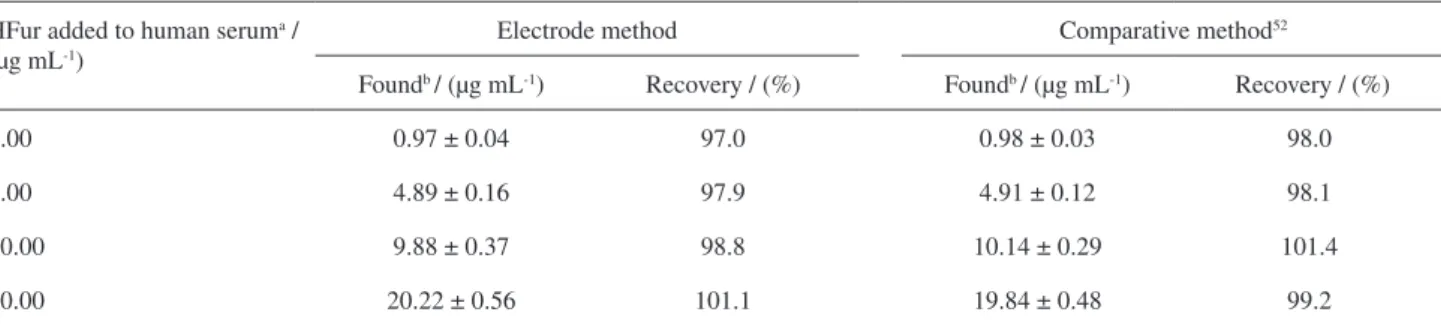
Table 6. Determination of furosemide added to human blood serum samples
HFur added to human seruma /
(µg mL-1)
Electrode method Comparative method52
Foundb / (µg mL-1) Recovery / (%) Foundb / (µg mL-1) Recovery / (%)
1.00 0.97 ± 0.04 97.0 0.98 ± 0.03 98.0
5.00 4.89 ± 0.16 97.9 4.91 ± 0.12 98.1
10.00 9.88 ± 0.37 98.8 10.14 ± 0.29 101.4
20.00 20.22 ± 0.56 101.1 19.84 ± 0.48 99.2
aThese concentrations cover the therapeutic and toxic range of HFur in human blood (serum or plasma).63,64bValues found are the average of six
determinations (n = 6) ± the corresponding standard deviation (SD).
Table 7. Determination of furosemide added to commercial milk samples
Milk samples HFur added to bovine milka / (ng mL-1)
Electrode method Comparative method29
Foundb / (ng mL-1) Recovery / (%) Foundb / (ng mL-1) Recovery / (%)
A 150 143.5 ± 2.2 95.7 144.3 ± 1.9 96.2
B 150 144.4 ± 2.4 98.4 145.6 ± 2.5 97.1
C 150 147.9 ± 1.8 98.6 150.6 ± 2.1 100.4
D 150 151.9 ± 2.6 101.3 147.9 ± 1.8 98.6
aThe concentration of HFur added to commercial milk samples is that generally detected in the next 8 h after administration of the usual 500 mg
10. Code of Federal Regulations, Food and Drugs, Parts 522.1010, c(3); U.S. GPO: Washington, 1991.
11. Ruiz-Angel, M. J.; Berthod, A.; Carda-Broch, S.; Álvarez-Coque, M. C. G.; Separation & Purification Reviews 2006, 35, 39.
12. Shaikh, B. In Veterinary Drug Residues-Diuretic Drugs Used in Food Producing Animals; Moats, W. A.; Medina, M. B., eds.; ACS Symposium Series 636, American Chemical Society: Washington, 1996.
13. British Pharmacopoeia, HM Stationary Office: London, 1998.
14. United States Pharmacopeia, USP 23: Rockville, 1995. 15. Issopoulos, P. B.; Fresenius Z. Anal. Chem. 1989, 334, 554. 16. Zivanovic, L.; Agatonovic, S.; Radulovic, D.; Mikrochim. Acta
1990, 1, 49.
17. Sastry, C. S. P.; Prasad, T. N. V.; Sastry, B. S.; Rao, E. V.; Analyst
1988, 113, 225.
18. Ferraro, M.; Castellano, P.; Kaufman, T.; J. Pharm. Biomed. Anal. 2001, 26, 443.
19. García-Sánchez, F.; Fernández-Gutiérrez, A.; Cruces-Blanco, C.; Anal. Chim. Acta 1995, 306, 313.
20. Luis, M. L.; Fraga, J. M. G.; Jiménez, A. I.; Jiménez, F.; Hernández, O.; Arias, J. J.; Talanta 2004, 62, 307.
21. Ioannou, P. C.; Rusakova, N. V.; Andrikopoulou, D. A.; Glynoy, K. M.; Tzompanaki, G. M.; Analyst1998, 123, 2839. 22. Gotardo, M. A.; Gigante, A. C.; Pezza, L.; Pezza, H. R.; Talanta
2004, 64, 361.
23. Nicolic, K. I.; Medenica, M.; Acta Pharm. Jugosl. 1990, 40, 521.
24. Barroso, M. B.; Alonso, R. M.; Jiménez, R. M.; Anal. Chim. Acta1995, 305, 332.
25. United States Pharmacopeia, USP 24: Rockville, 2000. 26. Abdel-Hamid, M.; Il Farmaco 2000, 55, 448.
27. El-Saharty, Y. S.; J. Pharm. Biomed. Anal.2003, 33, 699. 28. Baranowskaa, I.; Markowski, P.; Baranowski, J.; Anal. Chim.
Acta2006, 570, 46.
29. Shaikh, B.; J. Agric. Food Chem.1995, 43, 2117.
30. Carda-Broch, S.; Esteve-Romero, J.; Ruiz-Angel, M. J.; Alvarez-Coque, M. C. G.; Analyst 2002, 127, 29.
31. Barroso, M. B.; Alonso, R. M.; Jiménez, R. M.; Ortiz, E.; J. Chromatogr., B1996, 675, 303.
32. Nava-Ocampo, A. A.; Velázquez-Armenta, E. Y.; Reyes-Pérez, H.; Ramirez-Lopez, E.; Ponce-Monter, H.; J. Chromatogr., B
1999, 730, 49.
33. Tsai, F. Y.; Lui, L. F.; Chang, B.; J. Pharm. Biomed. Anal.1991, 9, 1069.
34. Saugy, M.; Meuwly, P.; Munafo, A.; Rivier, L.; J. Chromatogr. 1991, 564, 567.
35. Hagedorn, H. W.; Schulz, R.; J. Anal. Toxicol. 1992, 16, 194. 36. Riekkola, M. L.; Jumppanen, J. H.; J. Chromatogr., A1996,
735, 151.
37. Luis, M. L.; Corujedo, S.; Blanco, D.; Fraga, J. M. G.; Jiménez, A. I.; Jiménez, F.; Arias, J. J.; Talanta2002, 57, 223. 38. Soetebeer, U. B.; Shierenberg, M. O.; Moller, J. G.; Shulz, H.;
Grunefeld, G.; Andresen, P.; Blaschke, G.; J. Chromatogr., A
2000, 895, 147.
39. Caslavska, J.; Thormann, W.; J. Chromatogr., B2002, 770, 207.
40. Rao, Y.; Zhang, X.; Luo, G.; Baeyens, W. R. G.; Anal. Chim. Acta1999, 396, 273.
41. Guzmán, A.; Aguí, L.; Pedrero, M.; Yánez-Sedeño, P.; Pingarrón, J. M.; J. Pharm. Biomed. Anal. 2003, 33, 923.
42. Stefan, R. I.; Baiulescu, G. E.; Aboul-Enein, H. Y.; Crit. Rev. Anal. Chem.1997, 27, 307.
43. Lewenstam, A.; Maj-Zurawska, M.; Hulanicki, A.; Electroanalysis1991, 3, 727.
44. Dias, I. L. T.; Neto, G. O.; Vendramini, D. C.; Sommer, C.; Martins, J. L. S.; Kubota, L. T.; Anal. Lett. 2004, 37, 35. 45. Valsami, G. N.; Macheras, P. E.; Koupparis, M. A.; Analyst
1989, 114, 387.
46. Pezza, L.; Molina, M.; Moraes, M.; Melios, C. B.; Tognolli, J. O.; Talanta1996, 43, 1689.
47. Brito, M. S. L.; Angnes, L.; Brett, C. M. A.; Gutz, I. G. R.; J. Electroanal. Chem. 1999, 468, 150.
48. Peres, A. M.; Moraes, M.; Pezza, L.; Pezza, H. R.; Melios, C. B.; Microchem. J. 1998, 60, 184.
49. Ferreira, V. J. F.; Cavalheiro, A. C. V.; Fagnani, E.; Moraes, M.; Pezza, L.; Pezza, H. R.; Melios, C. B.; Anal. Sci. 1999, 15, 249.
50. Pezza, L.; Santini, A. O.; Pezza, H. R.; Melios, C. B.; Ferreira, V. J. F.; Nasser, A. L. M.; Anal. Chim. Acta2001, 433, 281. 51. Gyurcsányi, R. E.; Nybäck, Ann-Sofi; Tóth, K.; Nagy, G.;
Ivaska, A.; Analyst1998, 123, 1339.
52. Abou-Auda, H.; Al-Yamani, M. J.; Morad, A. M.; Bawazir, S. A.; Khan, S. Z.; Al-Khamis, K. I.; J. Chromatogr., B1998, 710, 121.
53. Buck, R. P.; Lindner, E.; Pure Appl. Chem. 1994, 66, 2527. 54. Benet, L. Z.; Massound, M.; Gambetogoho J. G.; Pharmacokinetic
Basis of Drug Treatment, Raven Press: New York, 1984. 55. Gadzekpo, V. P. Y.; Christian, G. D.; Anal. Chim. Acta1984,
164, 279.
56. Christian, G. D.; Analyst1994, 119, 2309.
57. Umezawa, Y.; Umezawa, K.; Sato, H.; Pure Appl. Chem. 1995,
67, 507.
58. Bakker, E.; Bühlmann, P.; Pretsch, E.; Chem. Rev. 1997, 97, 3083.
59. Williams, W. J.; Handbook of Anion Determination, Butterworths: London, 1979.
60. Li, G.; Polk, B. J.; Meazell, L. A.; Hatchett, D. W.; J. Chem. Educ. 2000, 77, 1049.
62. McEvoy, G. K.; McQuarrie, G. M.; DiPietro, H. J.; American Hospital Formulary Service Monograph, Furosemide USP
(40:28), American Hospital Formulary Service; American Society of Hospital Pharmacists: Bethesda, 1987.
63. Moffat, A. C.; Clarke’s Isolation and Identification of Drugs in Pharmaceutics, Body Fluids, and Post-Mortem Material, 2nd
ed., The Pharmaceutical Press: London, 1986.
64. Winek, C. L.; Wahba, W. W.; Winek Jr., C.L.; Balzer, T. W.; Foren. Sci. Intern.2001, 122, 107.
Received: May 13, 2008
Web Release Date: November 12, 2008