Printed in Brazil - ©2007 Sociedade Brasileira de Química 0103 - 5053 $6.00+0.00
A
r
ti
c
le
*e-mail: [email protected]
Heavy Metal Partition in Acid Soils Contaminated by Coal Power Plant
I.M.C. Camargo,* G. Hiromoto and M. Flues
Instituto de Pesquisas Energéticas e Nucleares, Centro de Química e Meio Ambiente, Av. Prof. Lineu Prestes, 2242, Cidade Universitária, 05508-000-São Paulo-SP, Brazil
O coeficiente de partição (Kp) de metais pode variar ordens de grandeza por causa das diferentes características do solo. Portanto, para a avaliação de risco à saúde humana é importante determinar o Kp de metais de um solo específico. O Kp de um solo coletado ao redor da usina termoelétrica a carvão de Figueira(município de Figueira, norte do Paraná) foi determinado usando dois métodos diferentes para representar a solução do solo: extração com soluções de EDTA e com Ca(NO3)2.
No geral, os valores de KpCa(NO3)2 apresentaram maior variabilidade e foram maiores que os de
KpEDTA. A razão KpCa(NO3)2/KpEDTA para Cd, Ni e Zn foi próxima de um, enquanto que a razão para Co, Cr, Cu e Pb foi maior que 2. Análises subseqüentes de KpEDTA e KpCa(NO3)2 apresentaram adsorção similar para todos os metais, exceto para o Pb. No caso do solo de Figueira, por causa da razão KpCa(NO3)2/ KpEDTA relativamente baixa (exceto para Pb), ambos os valores de Kp poderiam ser
utilizados em modelos matemáticos para avaliação de risco à saúde humana.
Metal partition coefficient (Kp) may vary by several orders of magnitude because of the different soil characteristics. Therefore, for human health risk assessment it is important to determine the specific soil metal Kp. For the coal-fired Figueira (Figueira county, north of Parana State) power plant surrounding soil, two different extraction methods representing the soil liquid phase were used to determine the Kp of soil samples: an EDTA and a Ca(NO3)2 extractingsolution. In general, KpCa(NO3)2 values showed more variability and were higher than KpEDTA. KpCa(NO3)2/KpEDTA ratio for Cd, Ni and Zn was close to one, while Co, Cr, Cu and Pb ratios were higher than two. Subsequent KpEDTA and KpCa(NO3)2 analyses showed similar soil
adsorption for all metals, except Pb. Concerning the Figueira soil case, because of the relatively low KpCa(NO3)2/ KpEDTA ratio (except for Pb), both Kp values could be used for conducting human health risk assessment with mathematical models.
Keywords: partition coefficient, heavy metal soil extraction, Ca(NO3)2, EDTA, risk
assessment
Introduction
Metals can contaminate soils by atmospheric pollutants deposition, agriculture fertilizers and defensives application and disposal of urban and industrial wastes.
One common way humans can be exposed to contaminated soil is through the ingestion of groundwater and vegetables. Metal transport to groundwater and vegetables depends on the metal partitioning in the solid and liquid phases of soil. This partitioning is known as:
phase liquid metal
phase solid metal Kp
] [
] [
=
where, Kp = partition coefficient (L kg-1); [metal] solid phase
= metal concentration in soil solid phase (mg kg-1);
[metal]liquid phase = metal concentration in soil liquid phase (mg L-1).
Small Kp values correspond to high metal concentration in soil solution and, therefore, more available metal for transport to the groundwater and/or absorbed by plant. Kp is not a constant value and may vary by several orders of magnitude.1,2 It is influenced by soil characteristics and
metal properties. Kp is one of the main sources of uncertainty in risk assessment, therefore, it is important to determine the Kp of metals in the specific soil. In general, Kp values have been determined by adsorption isotherm method2-8 and by the ratio between the concentration of
It was observed that, in general, the concentration ratio method was mostly applied for contaminated soils, while the adsorption isotherm method was mainly used in natural soil in which the metal concentration is negligible. To our knowledge, there is no worldwide standardized method for Kp values determination.If Kp may vary by several orders of magnitude in soil and it is one of the main sources of uncertainty in risk assessment, it is important to study different methodologies for its determination.
The soil studied in this work was contaminated by some metals due to its close proximity to a coal-fired power plant. In the present work, the ratio method between solid and liquid phase metal concentration was chosen for the Kp determination. In order to estimate the metal concentration in the solid phase of the soil, some sort of acid digestion is frequently used. For the liquid phase of the soil, several methods have been applied: soil solution displacement of soil by centrifugation or extraction using distilled water, dilute salts solutions, or relatively concentrated neutral salts extractants. Some commonly used dilute salts solutions are: NaNO3, KNO3, CaCl2, Ca(NO3)2, NH4NO3, NH4OAc. These solutions extract metals from the soluble and exchangeable soil fractions.17 On the other hand, EDTA solution
commonly used for agriculturestudies have not been used to simulate liquid phase of soil to calculate Kp. EDTA solution extracts higher or similar concentration of metals of soil than salts solutions.EDTA is a stronger chelating agent that extracts metals from the soluble, exchangeable, organic and partially oxides soil fractions.17,18In this work,
Ca(NO3)2 and EDTA solution were chosen for extraction of the metals from the soil.
This study aims at evaluating the partition coefficients Kp of various metals in soils sampled around a coal-fired power plant using the extraction method with EDTA and Ca(NO3)2 solutions. These Kp values will be used for conducting risk assessment of contaminated soil using mathematical models.
Reasons for the neutral salt (Ca(NO3)2) and quelant agent (EDTA) choice for simulating the soil solution and calculating the partition coefficient (Kp)
The following Ca(NO3)2 and EDTA characteristics led us to decide on them as the extraction media to calculate the partition coefficient (Kp).
Ca(NO3)2
(i) It is a neutral salt. This does not in any way affect the equilibrium between soil solution and soil solid neither by changing soil pH nor by forming complexes with its cation or anion. These characteristics are the most
important and deciding factors in selecting any extraction medium.Chloride removes Cd and Zn from soil and forms chloro-complexes.19,20 NH
4
+ salt extracting solutions
usually affect the soil equilibrium between soil solid and soil solution. It decreases soil pH and NH3 presence forms strong complexes with Cu, Ni and Cr and with Cd, Cu and Zn;19,20 (ii) Ca cation has oxidation state 2+. The
majority of heavy metals in soil has oxidation state 2+ too and then, the exchange occurs with cations of equal charge. The competitivity of the exchange sites for monovalent cations, such as Na+, K+, NH
4
+, is lesser than
the divalent metal cations ones; (iii) 0.1 mol L-1
concentration of Ca(NO3)2 is comparable to the commonly found molar concentration of soil solutions under field conditions which ranges from 0.05 to 0.2 mol L-1. (iv)
The Ca2+ and NO 3
– ions are usually present in soil solution.
This can simulate the leaching of metals from soil to the groundwater and the bioavailability to plants.
EDTA
(i) Certified reference soil to EDTA extraction method. As the result of the extensive collaborative studies carried out by a group of European laboratories, under the auspices of Community Bureau of Reference (BCR), one certified reference soil to EDTA extraction method was available;18
(ii) Quantity of extracted metal in the extraction media. Very often the metal concentration found in dilute salts extracts are low and the method reproducible is low too.21
The EDTA extraction method adopted by BCR was sufficiently accurate and reproducible in the extracts of a sludge amended soil for the elements Cd, Cu, Ni, Pb and Zn; (iii) Correlation between plant and soil. In general, the ability of the extractants to predict plant-available metals depends on the plant species, the metal and extractant used. EDTA extracts of soils tend in general to correlate well with plant contents for Cd, Cu, Ni, Pb and Zn in arable crops and Mo and Se in greenhouse crops.18
Hooda et al. showed that 0.05 mol L-1 EDTA is a reliable
test for predicting metal availability to carrots, spinach and wheat from sludge amended soils.22 The results
showed by Ure18 and Hooda et al.22 induce that EDTA
extracts of soils correlate goodwith metalplantcontents, more plant species and more metals than others dilute salts solutions (CaCl2, NH4NO3, NaNO3).
Partition coefficient calculation
Generally Kp value used in mathematical models for conducting risk assessment of contaminated soil is the same to simulate transport to groundwater and plants.
(Kp), as explained above. Calculated Kp using Ca(NO3)2 extract simulate the metal desorption from soil to soil solution and leaching to groundwater and plants. As discussed before, EDTA showed good correlation between soil solution and plant, therefore EDTA calculated Kp could simulate better metal transport to plant than to groundwater.This Kpcould not simulate metal transport to groundwater because soil solution composition has not EDTA. However, it could simulate better metal transport to plant than Ca(NO3)2 or any other dilute salt solution because the existing correlation between soil and plant above discussed. Kp value using EDTA extraction tend to be smaller or equal than Kp value using Ca(NO3)2 because EDTA extracts higher or equal metal quantities than Ca(NO3)2.
Experimental
Soil sampling
Two soil-sampling runs were performed. Initially, 16 soil samples were collected as fraction A (depth from 0 to 25 cm), in December 1996, around the coal-fired power plant, in a distance of 1 and 3 km, in the direction of the cardinal points. A second sampling was performed one year later (December 1997), in the Northwest transect direction. Twenty-four soil samples were collected at every 100 meters from the coal-fired power plant up to 1.2 km. In each transect sampling, soil samples were collected in two different profiles, named fraction A (depth from 0 to 25 cm) and fraction B (depth from 25 to 50 cm) and approximately 1 kg of soil was collected. All samples were air-dried, sieved to 2 mm and carefully homogenized.
The coal-fired power plant is a relatively small (10 MWe) and old one, located in the Figueira county, in the north region of Parana State, Brazil. The plant has been operating for more than 40 years and, some years ago, a filter system was installed (July 1998) to reduce the particulate emission through the 40 m stack. The coal used in the plant comes from a nearby mine. The region is mainly agricultural and with small population density; there are no other industrial activity in a radius of 10 km.
Soil characterization
It is well known that soil properties may influence the adsorption of metals, therefore soil characterization was carried out for all soil samples. pH was determined at a 1:2.5 soil:liquid (m/v) ratio with 1 mol L-1 KCl. The clay
content was determined by the hydrometer method.23 The
organic matter (OM) was calculated from the carbon
content (determined by Walkley-Black dichromate oxidation method) multiplied by 1.7. The cation exchange capacity (CEC) was determined by saturation of soil with BaCl2 1 mol L-1, exchange with MgSO
4 0.025 mol L -1 and
titration with EDTA 0.01 mol L-1.24 The total concentration
of Al, Fe, Mn were determined by X-ray fluorescence (Rigaku-XRFS RIX 300).
Extractions
To determined the metals concentration in different soil fraction, various extraction had been carried out.
Nitric acid digestion
0.5 g of soil was treated with 10 mL of concentrated HNO3 in a digestion vessel and processed in a microwave oven (Provecto Analítica-DGT 100 Plus), according to the methodology EPA 3051. Samples were diluted to 50 mL with deionized water and filtered by 0.45 mm pore membrane.
Ammonium ethylenediaminetetraacetic (EDTA-NH4) A sample of 2 g of soil wasextracted with 40 mL of 0.05 mol L-1 EDTA-NH
4(pH 7) and shaken for 1 hour at 10
rpm (vertical rotation). The sample was centrifuged, filtered by 0.45 mm pore membrane, and acidified with HNO3 to pH 2, according to methodology proposed by Ure.18
Calcium nitrate
2 g of soil was extracted with 40 mL of 0.1 mol L-1
Ca(NO3)2 and shaken for 16 hours at 170 rpm (horizontal rotation). The sample was centrifuged, filtered by 0.45 mm pore membrane and acidified with HNO3 to pH 2, according to methodology proposed by Conder et al.25
Duplicates of each soil sample in each extraction media were analyzed for the elements As, Cd, Co, Cr, Cu, Mo, Ni, Pb and Zn by inductively coupled plasma-optical spectrometer (Spectro Analytical Instruments-SpectroFlame M120 E). Blanks were prepared and treated in the same way as the soil sample.
Partition coefficient (Kp)
Kp was calculated according to the expressions:
ion concentrat metal
ility bioavailab
ion concentrat metal
partial
KpEDTA = (1)
ion concentrat metal
le exchangeab
ion concentrat metal
partial
where partial concentration was obtained by nitric acid digestion (mg kg-1), bioavailability concentration by EDTA
extraction (mg L-1) and exchangeable concentration by
Ca(NO3)2 extraction (mg L-1).
Results and Discussion
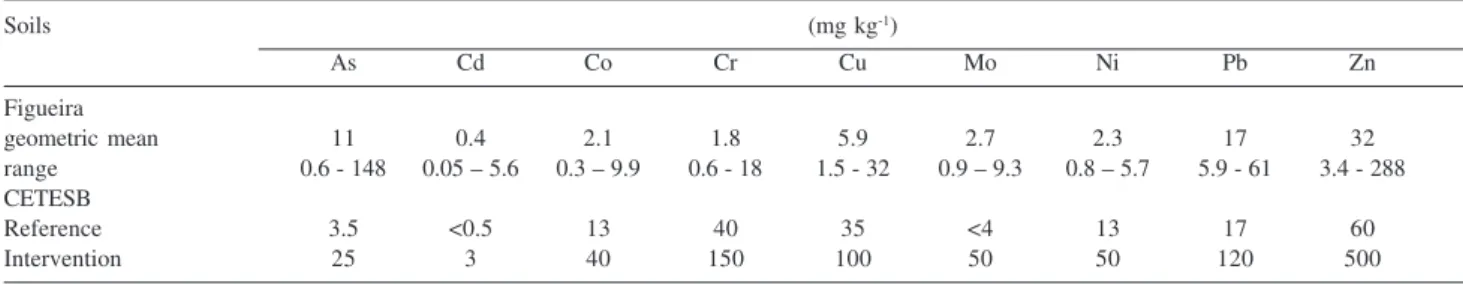
Table 1 shows the partial metal concentration of Figueira soil, reference and intervention values of CETESB environmental agency (Companhia de Tecnologia de Saneamento Ambiental of São Paulo State, Brazil). Reference soil values indicate background of metal concentration in São Paulo Statesoil.Intervention values aregenericsoil quality standards used to classify soils as seriously contaminated. These values are based on potential risks to human health and ecosystems.
Arsenic, Cd, Mo, Pb and Zn were considered contaminants of the Figueira soil because their partial concentrations were higher than the reference values. Arsenic showed partial concentration values higher than intervention value in 44% of the soil samples analyzed, that is, soil samples showed potential risk to human health and ecosystems. The majority of these samples are close to the coal-fired power plant up to 1 km in both fractions, A (depth from 0 to 25 cm) and B (depth from 25 to 50 cm). Cadmium showed partial concentration value higher than intervention value only in one soil sample, very close tothe coal-fired power plant.
The soil characteristics pH, OM, clay and Al, Fe, Mn oxides are related with sorption and desorption reactions. The Figueira soil showed a low pH, with a mean of 4.3 ± 0.3. Higher soil acidity (lower pH values) favors the availability of cations in soil. The majority of heavy metals in soil are cations. Low pH soils retained more of a given oxyanion species than did high pH soils, which is in contrast to cation retention. pH is the most important soil characteristic that affects sorption and desorption reactions. The characteristics OM, clay and Al, Fe, Mn oxides tend to sorption metal in soil solid phase. OM, clay and Al, Fe and Mn showed a mean of (2.9 ± 2.0)%, (26 ± 10)%, (51 ± 12) g kg-1, (23 ± 50)g kg-1 and (1.2 ± 0.4)g kg-1, respectively.
CEC showed a mean of 18 ± 8 cmol kg-1; CEC is the
capacity of soil reversible adsorbtion of cations from solution and it is related with OM, clay and Al, Fe, Mn oxides. All these characteristics affect sorption and desorption reactions and, therefore, affect Kp values.
The metal partition coefficient in soils was determined by expressions 1 and 2, and a box plot graphic was applied to study their variation (Figure 1). This methodology allows a visualization of the metal partition coefficients among the soil samples, the range of data variation, average and median values, as well as comparisons among different metals and the two methods applied [EDTA and Ca(NO3)2].
Because of the low Mo concentration obtained in the Ca(NO3)2 extraction solution (lower than the detection
Table 1. Partial metal concentration of the Figueira soil (Figueira county, Paraná State), reference and intervention values of the CETESB environemntal agency
Soils (mg kg-1)
As Cd Co Cr Cu Mo Ni Pb Zn
Figueira
geometric mean 11 0.4 2.1 1.8 5.9 2.7 2.3 17 32
range 0.6 - 148 0.05 – 5.6 0.3 – 9.9 0.6 - 18 1.5 - 32 0.9 – 9.3 0.8 – 5.7 5.9 - 61 3.4 - 288 CETESB
Reference 3.5 <0.5 13 40 35 <4 13 17 60
Intervention 25 3 40 150 100 50 50 120 500
limit of the ICP method applied) KpCa(NO3)2 value of Mo was not determined.
KpEDTA× KpCa(NO3)2
In general, KpCa(NO3)2 values presented greater variability than KpEDTA values (Figure 1), maybe because of the low metal concentrations obtained by the extraction with Ca(NO3)2. These data are low or near the detection limit of the method for some of the metals. Ca(NO3)2 solution extractsmetals from fewer soil fractions than EDTA.17 The Ca(NO
3)2 solution extracts metals from the
soluble and exchangeable soil fractions. EDTA is a stronger chelating agent that can extract metals from the soluble, exchangeable, organic and partially oxides soil fractions.17,18 The variability of Kp values from both
methods shows that EDTA extraction provides Kp values with less dispersion than Ca(NO3)2 extraction and, therefore, could be considered more reliable.
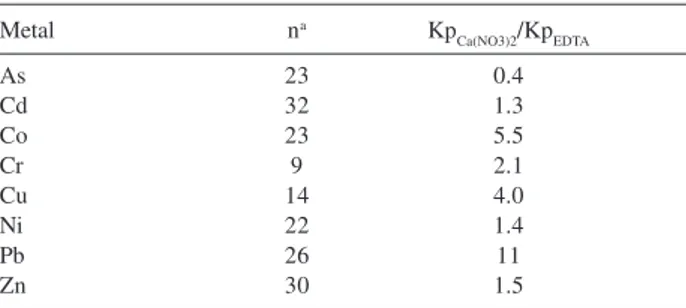
In general KpCa(NO3)2 values were higher than KpEDTA, with KpCa(NO3)2/KpEDTA ratio ranging from 0.4 to 11 (Table 2). These differences are also statistically significant, as checked by the Wilcoxon test (p < 0.05, one tailed) for all metals. This is an expected fact, since Ca(NO3)2 solution extracts less metal from soil than EDTA. KpCa(NO3)2/KpEDTA ratio for Cd, Ni and Zn showed values close to one. These metals tend to be weakly adsorbed to acid soil26 and, therefore, both extraction
solution leaded to similar results. KpCa(NO3)2/KpEDTA ratio for Co, Cr, Cu and Pb was greater than two. These metals are strongly bonded to soil organic, oxides and clay fractions26
and EDTA solution extracted Co, Cr, Cu and Pb more efficiently from the above soil fractions than Ca(NO3)2 solution, which extracts metalsonly from the soluble and exchangeable fraction of the soil. KpCa(NO3)2/KpEDTA ratios greater than ten were observed only for Pb.
Metals adsorption by soil
The mean Kp values (Figure 1) showed the following adsorption sequence for KpEDTA and KpCa(NO3)2 values:
KpEDTA: As > Mo > Cr > Cu > Ni > Cd > Pb > Co > Zn
KpCa(NO3)2: Cr > Pb > Cu > As > Co > Ni > Cd > Zn
Although KpCa(NO3)2 values were greater than KpEDTA ones, the sequence showed similar soil adsorption behavior for all metals, with exception to Pb.
The results indicate that As, Cr, Cu and Mo were strongly adsorbed on soil and Zn was more mobile, followed by Cd, Co and Ni. Such behavior is in good agreement with the literature.26 Among the more mobile
metals (Zn, Cd, Co and Ni), Cd is of greatest concern for human health because of its toxicity. Pb demonstrated a more complex behavior: KpEDTA sequence showed that Pb was more mobile in soil than in KpCa(NO3)2 sequence. Since it is well known that Pb has high affinity to organic matter and tends to bond strongly to soil,26 it is expected that Pb
would be located in the adsorption sequence near the metals Cu and Cr. However, KpEDTA of Pb was lower than KpEDTA values of Cr, Cu, Ni and Cd. Gooddy et al.27 and
Dumat et al.28 observed that Kp value of Pb could be
influenced by the type of extraction solution applied.On the other hand, EDTA extraction has been considered an effective method to remove Pb from contaminated soils.29
This means that EDTA is a very good extractor for Pb from soil and, sometimes, this extraction is more efficient than the HNO3 one.30 Based in this information, if Pb was
similarly extracted by EDTA and HNO3 solution, small Kp value would be expected.
The metals behavior observed in the present study showed good agreement with the literature.31,32 Wasay et
al.31 studied the adsorption of heavy metals in different
contaminated soils and concluded that Cd and Zn were predominantly found in the exchangeable fraction of the soil, while Cr, Cu and Pb were mostly bonded to the Fe-Mn oxides and the organic matter fraction. Therefore, Cd and Zn are more mobile than other metals. Podlesáková et al.32 studied Cd, Co, Cr, Cu, Ni, Pb, Zn in various soil
fractions with different levels of contamination and properties. They observed that Cd was found mainly in the mobile (soluble and exchangeable) fractions of the soil. Other metals such as Co, Cr, Ni and Zn were frequently found in the residual or Fe-oxide fractions, while Cu and Pb were mostly bonded to the organic matter fraction of the soil.
Other authors also observed adsorption sequences for metals in soil similar to the present study. Gomes et al.6
evaluated the adsorption of Cd, Cr, Cu, Ni, Pb and Zn with Kp determined by the adsorption isotherm method in seven different brazilian soils. The authors concluded that Cu, Cr and Pb are stronger adsorbed on soil than Cd, Ni and Zn. Table 2. KpCa(NO3)2/KpEDTA of metals
Metal na Kp
Ca(NO3)2/KpEDTA
As 23 0.4
Cd 32 1.3
Co 23 5.5
Cr 9 2.1
Cu 14 4.0
Ni 22 1.4
Pb 26 11
Zn 30 1.5
Gao et al.4 studied the adsorption of the same metals in
nine different soils using the same method as Gomes et al.6
with adjustment of soil pH from 4.5 to 6.5. These authors observed the following sequence of adsorption: Pb > Cu ≥ Zn > Ni > Cd > Cr. Chromium showed a more mobile behavior than the others metals, because in this experiment chromium was introduced in the form of an anion (CrO42–).
Hassan et al.33 studied the distribution of chromium in
different oxidation states (Cr3+ and CrO 4
2–) in soil, and
observed that CrO42– Kp was ten times smaller than Cr3+
Kp. Consequently, CrO42– is less adsorbed in soil than Cr3+.
In the present study, chromium was probably in the Cr3+
form, due to its low mobility in soil.
Contaminated soil versus non contaminated soil
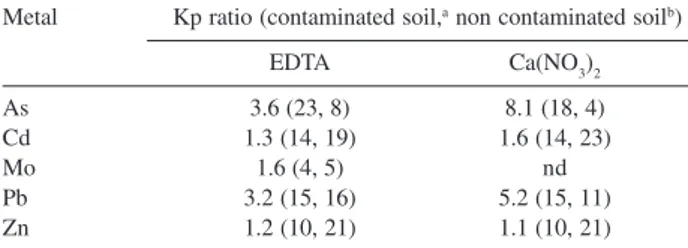
One attempt to evaluate the necessity to determine Kp value with both methods in contaminated soil was made for conducting risk assessment. Figueira soil samples were separated in two groups: the first group contained soil samples with metal concentration lower than the reference value of CETESB, and was named non contaminated soil. The second group contained soil samples with metal concentration higher than reference value and named contaminated soil. Applying Mann-Whitney test (p < 0.05, one tailed) to the two groups, Kp values of As, Cd, Pb and Zn in contaminated soil was statistically higher than Kp values in non contaminated soil. Molybdenum showed insufficient evidence to indicate a difference between contaminated and non contaminated soil. Although Kp values of the two groups showed statistically significant differences, Kp ratio between contaminated and non contaminated soil (Table 3) was lower than one order of magnitude. This indicates that in case of Figueira Kp values applied to risk assessment could be determined in non contaminated soil. Therefore, if Kp values of Figueira soil had been determined before the contamination of the soil, these Kp values could be used for risk assessment in case of a possible contamination.
Conclusions
In the case of Figueira soil, most of the studied metals showed KpCa(NO3)2/KpEDTA ratios lower than six. Therefore, both KpCa(NO3)2 and KpEDTA values presently determined could be used for conducting risk assessment of contaminated soil using mathematical models, except to Pb. KpCa(NO3)2/KpEDTA ratio for Pb is higher than one order of magnitude and, therefore, it could be a significant source of error if applied to risk calculation. Estimates of Kp using EDTA extraction method can be recommended due to the low dispersion of their values. Although EDTA and Ca(NO3)2 extract metals of different soil fractions, the metal adsorption sequence showed similar behavior, except for Pb. In case of Figueira, Kp values applied to risk assessment could be determined in non contaminated or contaminated soil.
Acknowledgments
This project received financial support from FAPESP. All soil analyses were carried out at the Laboratory of Chemistry and Environment Analyses (Laboratório de Análises Químicas e Ambiental), IPEN/CNEN. We are grateful to Cambui Coal Company (Companhia Carbonifera Cambui) for the permission to carry out this project.
References
1. Janssen, R.P.T.; Peijnenburg, W.J.G.M.; Posthuma, L.; Van Den Hoop, M.A.G.T.; Environ. Toxicol. Chem. 1997, 16, 2470.
2. Butcher, B.; Davidoff, B.; Amacher, M.C.; Hinz, C.; Iskandar, I.K.; Selim, H.M.; Soil Sci. 1989, 148, 370.
3. Anderson, P.R.; Christensen, T.H.; J. Soil Sci.1988, 39, 15. 4. Gao, S.; Walker, W.J.; Dahlgren, R.A.; Bold, J.; Water, Air, Soil
Pollut.1997, 93, 331.
5. Echeverría, J.C.; Morera, M.T.; Mazkiarán, C.; Garrido, J.J.;
Environ. Pollut.1998,101, 275.
6. Gomes, P.C.; Fontes, M.P.F.; Silva, A.G.; Mendonça, E.S.; Netto, A.R.; Soil Sci. Soc. Am. J. 2001, 65, 115.
7. Veeresh, H.; Tripathy, S.; Chaudhuri, D.; Hart, B.R.; Powell, M.A.; Environ. Geol.2003, 44, 363.
8. Agbenin, J.O.; Olojo, L.A.; Geoderma2004, 119, 85. 9. Romkens, P.F.A.M.; Salomons, W.; Soil Sci.1998, 163, 859. 10. Sauvé, S.; Hendershot, W.; Allen, H.E.; Environ. Sci. Technol.
2000, 34, 1125.
11. Sauvé, S.; Norvell, W.A.; McBride, M.; Hendershot, W.;
Environ. Sci. Technol.2000, 34, 291.
12. McBride, M.B.; Martinez, C.E.; Topp, E.; Evans, L.; Soil Sci. 2000, 165, 646.
Table 3. Kp ratio between contaminated and non contaminated soils using EDTA and Ca(NO3)2 methods
Metal Kp ratio (contaminated soil,a non contaminated soilb)
EDTA Ca(NO3)2
As 3.6 (23, 8) 8.1 (18, 4)
Cd 1.3 (14, 19) 1.6 (14, 23)
Mo 1.6 (4, 5) nd
Pb 3.2 (15, 16) 5.2 (15, 11)
Zn 1.2 (10, 21) 1.1 (10, 21)
13. Carlon, C.; Norbiato, M.; Critto, A.; Marcomini, A.; Ann. Chim. 2000, 90, 349.
14. Krishnamurti, G.S.R.; Naidu, R.; Environ. Sci. Technol.2002,
36, 2645.
15. Degryse, F.; Broos, K.; Smolders, E.; Merckx. R.; Eur. J. Soil Sci.2003, 54, 149.
16. Sastre, J.; Hernández, E.; Rodríguez, R.; Alcobé, X.; Vidal, M.; Rauret, G.; Sci. Total Environ.2004, 329, 261.
17. Alloway, B.J.; Heavy Metals in Soils, John Wiley & Sons: New York, 1990.
18. Ure, A.M.; Sci. Total Environ.1996, 178, 3.
19. Gupta, S.K.; Aten, C.; Int. J. Environ. Anal. Chem.1993, 51, 25.
20. Lebourg, A.; Sterckeman, T.; Ciesielski, H.; Proix, N.; J. Environ. Qual. 1998, 27, 584.
21. Sager, M.; Accred. Qual. Assur.1999, 4, 299.
22. Hooda, P.S.; McNulty, D.; Alloway, B.J.; Aitken, M.N.; J. Sci. Food Agric.1997, 73, 446.
23. Klute, A.; Methods of Soil Analysis, Soil Science Society of America: Madison, 1986.
24. Gillman, G.P.; Aust. J. Soil Res.1979, 17, 129.
25. Conder, J.M.; Lanno, R.P.; Basta, N.T.; J. Environ. Qual.2001,
30, 1231.
26. McBride, M.B.; Environmental Chemistry of Soils, Oxford: New York, 1994.
27. Gooddy, D.C.; Shand, P.; Kinniburgh, D.G.; Van Riemskijk, W.H.; Eur. J. Soil Sci.1995, 46, 265.
28. Dumat, C.; Chiquet, A.; Gooddy, D.; Aubry, E.; Morin, G.; Juillot, F.; Benedetti, M.F.; Bull. Soc. Geol. France2001, 172, 539.
29. Heil, D.M.; Samani, Z.; Hanson, A.T.; Rudd, B.; Water, Air,
Soil Pollut.1999, 113, 77.
30. Lim, T.T.; Tay, J.H.; Wang, J.Y.; J. Environ. Eng.2004, 130, 59.
31. Wasay, S.A.; Barrington, S.; Tokunaga, S.; J. Soil Contam.1998,
7, 103.
32. Podlesáková, E.; Nemecek, J.; Vácha, R.; In I.K. Iskandar; M.B Kirkham; Trace Elements in Soil: Bioavailability, Flux and Transfer, CRC Press: Florida, 2000, p. 21.
33. Hassan, S.M.; Garrison, A.W.; Chem. Speciation Bioavailability1996, 8, 85.
Received: July 6, 2006
Web Release Date: July 17, 2007