Printed in Brazil - ©2007 Sociedade Brasileira de Química 0103 - 5053 $6.00+0.00
R
e
v
ie
w
*e-mail: [email protected]
# Present address: Centro de Energia Nuclear na Agricultura, Universidade de São Paulo, Piracicaba-SP, Brazil
Inductively Coupled Plasma Optical Emission Spectrometry with Axially Viewed
Configuration: an Overview of Applications
Lilian C. Trevizan# and Joaquim A. Nðbrega*
Departamento de Quˇmica, Universidade Federal de Sıo Carlos, CP 676, 13650-970 Sıo Carlos-SP, Brazil
Geralmente aceita-se que espectrômetros de emissão óptica com plasma acoplado indutivamente (ICP OES) com configuração axial apresentam efeitos de matriz mais severos quando comparados aos equipamentos com configuração radial, embora gerem menores limites de detecção. Entretanto, o desenvolvimento de detectores de estado sólido associado ao arranjo óptico Littrow com rede echelle e interfaces apropriadas para remoção da zona fria do plasma vêm possibilitando a expansão do uso dessa configuração. Nesta revisão são discutidos trabalhos publicados no período de 1999 a 2006 que fazem uso da configuração axial para avaliação dos efeitos de matriz, otimização das condições de operação e análise de diversos tipos de amostras, incluindo a introdução de amostras complexas, tais como suspensões.
It is generally assumed that inductively coupled plasma optical emission spectrometers (ICP OES) with axial configuration present severe matrix effects when compared to radially viewed ones, although lower detection limits are obtained. However, the development of solid state detectors associated with a Littrow optical arrangement with an echelle grating and proper interfaces for plasma tail cut off led to an increase of analytical applications based on axially viewed configuration. In this review, papers published from 1999 to 2006 using this configuration for matrix effects evaluation, optimization of the operating conditions and analysis of complex samples, such as slurries, are discussed.
Keywords: axially viewed configuration, ICP OES, matrix effects
1. Introduction
The simultaneous and multi-element determination capability of inductively coupled plasma optical emission spectrometry (ICP OES) called the attention of the analytical community in the 70’s. The first commercial equipment was launched in 1974 and the technique is until today largely employed for routine analysis. Nowadays, two torch configurations are commercially available: axially and radially viewed. Generally axially viewed equipments have the torch positioned horizontally in relation to the optical system, while the torch of radially viewed equipments is positioned vertically. It is generally believed that despite their better limits of detections, axially viewed systems have a poor performance due to an increase of interferences caused by recombination processes in the plasma tail cool region. However, the
development of charge coupled devices solid state detectors led to the possibility of simultaneous measurements in a large spectral window. Additionally, in the 90’s interfaces were developed for plasma tail cut off using end-on or shear gas flow.1 The improvement of
detection limits with axially viewed configuration equipped with proper interfaces makes this system competitive and it was recently pointed out that “axial viewing is the default viewing mode for most systems that are currently commercialized”.2
The first systematic study of the figures of merit of an axially viewed ICP OES with a solid-state detector was published in 1995.3 The results were compared with a radial
enhancement of detection limits in the axial configuration was related to the lower relative standard deviations (RSD) of blank solutions and greater signal-to-background ratios (SBR). Both systems led to similar precisions and linear dynamic ranges for Cd 228 nm. Self-absorption effects were observed for solutions containing elevated concentrations of Cd with the axial configuration resulting in one order of magnitude reduction in the maximum calibration concentration. However, the improvement of detection limits compensated the self-absorption effects and the linear dynamic range was kept. Matrix effects caused by a 10% (m/v) NaCl solution were more critical in axially viewing mode.3 Suppression of ionic lines with higher energy sums
was also observed, mainly when using non-robust operating conditions. Additionally, OH molecular emission was a factor of three more intense relative to the background with axial configuration, probably causing a detrimental impact on detection limits if the analyte emission peak is within a spectral region of molecular bands.
Later on, several works were published comparing matrix effects observed in both configurations due to the introduction of easily ionized elements (EIE´s),5-8 acids,9
and the possibility of using internal standards for interference correction.10
A comprehensive review comparing the analytical performance of axially and radially ICP OES systems were published in 2000 by Brenner and Zander.1 Descriptions
were given of the instrumentation, operating conditions, figures of merit, interferences and application of axial equipments, with emphasis in 2-20 fold detection limits improvement for this configuration with conventional nebulization systems and 30-fold improvement when a thermospray or ultrasonic nebulizers were employed. This review describes the torches used in axial equipments, with outer sleeve commonly extended in order to confine the plasma and minimize air entrainment. Axial torches generally have wider injector tubes (> 2 mm). The advantages of the use of interfaces to remove plasma fringe (end-on gas or shear gas) were discussed. Readers’ attention were called to the minimization of self-absorption effects, protection of optical interface from thermal damage, prevention of salt deposition on the entrance of optical lenses and mirrors, reduction of matrix effects and extension of the linear calibration range when interfaces were used in axial systems. In addition, the use of either N2 or Ar as shear gas also allowed determinations in the UV region of the spectrum.
The normal analytical zone (NAZ) is defined as the plasma region where emissions are collected for spectrometric measurements, the NAZ is observed laterally in radial systems and the observation height is an important
parameter for radial equipments. The heterogeneous spatial distribution of emitting species in radial plasma is one of the factors that affect the results. However, in axial plasmas, the NAZ is extended because the entire plasma channel is observed. Spatial inhomogeneity may have less influence in axially systems where the field of observation is quite large. Considering that the external region of the plasma has lower temperature and electronic density in comparison to the internal, removal of the plasma fringe is fundamental in order to avoid self-absorption effects in axial plasma NAZ.1 Using proper interfaces, interferences seem to present
similar magnitudes in both configurations, mainly when employing robust conditions in axially viewed equipments. These conditions include the use of relative wide torch injector tubes, high radio-frequency power, and lower nebulization gas-flow rate. Results compiled indicated that Mg II / Mg I ratios were lower than those obtained with radially viewed plasmas, but minimum interferences were observed when Mg II / Mg I > 8 was established in axially equipments.1
Brenner and Zander1 also described a serie of works
employing axially viewed equipments for analysis of complex matrix samples, such as: geological materials (employing sodium peroxide or lithium metaborate as fluxes for sample preparation), agricultural samples (fertilizers, wastes, sludge, rock, etc), biological and clinical samples (fruit pulp, juice, wine, blood), foods (milk powder diluted in Triton X-100), cosmetics, polymers, particulates and air pollution, steels, NaCl brines, nuclear materials, etc. In addition, the direct analysis of solids and slurries were also performed using axially viewed configurations. In all cases, quantitative recoveries were obtained and the improvement in detection limits allowed the determination of elements which were not detectable in radially viewed systems due to the comparatively poor sensitivity of this configuration.
2. Researches using ICP OES with Axially
Viewed Configuration
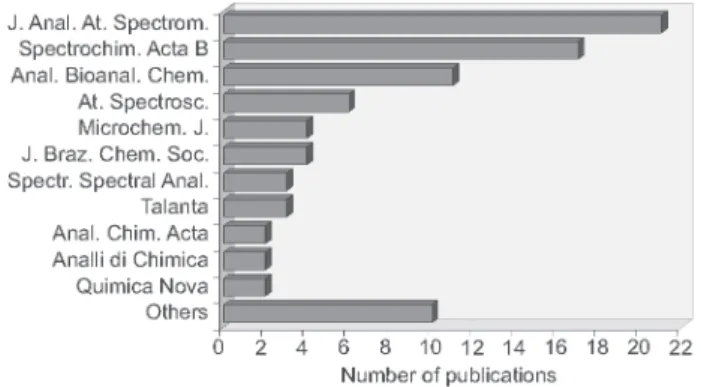
A search done in April 2006 using the ISI Web of Knowledge site11 in the World Wide Web, led to the selection
of 86 papers using axially systems published from 1999 to 2006. This period was chosen based on the publication of the Brenner and Zander’s review in 2000.1 The goal of the
search was not comprehensive. Most works were published in the Journal of Analytical Atomic Spectrometry,
Spectrochimica Acta Part B and Analytical and
Bioanalytical Chemistry (also including Freseniusæ Journal of Analytical Chemistry). The distribution profile of selected publications according to the journal is shown in Figure 1.
The number of selected publications can be considered relatively small in comparison to the publications dealing with radial equipments. Trends observed in this review are similar to the ones previously reported by Mermet,2 about the future of
ICP OES research. According to Mermet, the number of ICP OES papers has not varied drastically over the past 20 years while the number of ICP-MS papers is still increasing. Less than 60 papers dealt with axial viewing of the total of 2300 ICP OES publications searched.2 This can be considered a small number taking
into account that this configuration is the default viewing mode for most systems currently commer-cialized.2 Approximately 1000 papers were published
in both Journal of Analytical Atomic Spectrometry and
Spectrochimica Acta Part B.
It was observed that most papers selected dealt with matrix effects evaluation in axially viewed ICP OES and routine applications. Changes in analytical signals due to matrix effects were a major topic pointed out by Brenner and Zander.1 Papers evaluating matrix effects were also
cited by Mermet,2 but those related with non-spectral
matrix effects represented only 5% because few laboratories have the expertise to run diagnostic tests based on Thomson scattering due to the complex set-up and the need to adapt the instrument for this purpose.
Several publications about slurry introduction were also described and the results shown acceptable accuracy in spite of the complexity of the samples. These works could also be seen as closely related to matrix effects evaluation.
It can be supposed that the applicability of axially viewed configuration will increase since as already mentioned this is the most usual configuration sold nowadays.
2.1. Matrix effects
Matrix effects cause changes in analyte behavior due to the presence of major species in the sample. Acids and EIE’s are generally the factors that cause matrix effects in ICP OES.
Frequently, samples are introduced in ICP OES as representative solutions. Generally, analytical procedures include the use of concentrated acids or acid mixtures for sample decomposition or analyte stabilization. The magnitude of acid effects depends on several parameters and their can be classified in two general groups.12 The
first one is related to physical effects: changes in viscosity and surface tension affect sample aspiration and nebulization rates, and variations in density and volatility alter the solution mass that is transported to the plasma. In addition, depending on the characteristics of the nebulizer, changes in primary and tertiary drop size distribution of the aerosol and modification of the element concentration as a function of the drop size could occur. In the second group, all processes that take place inside the plasma would be considered.
Inorganic acids, such as sulfuric and phosphoric acids, deteriorate the nebulization leading to coarse primary aerosols, while organic acids, such as acetic and propionic acids, caused the drop size distributions of the primary aerosols to shift to smaller diameters. In contrast, nitric, hydrochloric, and perchloric acids do not modify significantly the physical aerosol generation process.12
Acid interferences could also occur due to the deterioration of analyte excitation conditions caused by changes in electronic density and temperature when the acid reaches the plasma. However, these effects can be minimized using robust conditions, even when axially viewed ICP OES is employed.12
Acid effects can be corrected by using internal standardization. An internal standard can be selected using principal component analysis (PCA) for correction of interference effects caused by acid or acid mixtures13 and
elevated concentrations of Al, Ca, Fe, K, and Na14 in an
axially viewed ICP OES. The greater advantage of the Figure 1. Number of publications employing axially viewed
chemometric approach was the selection of the most adequate internal standard for each emission line. Other strategies for acid effects correction include matrix matching, the standard additions method, sample introduction using electrothermal vaporization or modification of the sample introduction systems. In this case, the spray chamber could be eliminated and direct injection nebulizers (DIN) could be used. Desolvation systems could also be coupled, allowing the evaporation of a considerable solvent fraction.12
Easily IE’s can cause matrix effects in ICP OES and are generally found in great amounts in various types of samples. Elements with high ionization potentials can also cause matrix effects but their concentration should be greater than 0.05 mol L-1 in order to produce appreciable
effects.15 High concentrations of interferents would modify
practically all steps in an ICP OES analysis, such as the sample introduction and the radiation emission in the plasma. Modifications in solution physical properties can cause changes in aerosol formation and transport to the plasma. The presence of interferents in the plasma can affect the analytical signals because of changes in thermal characteristics and in analyte excitation efficiency.
Todoli et al.15 cited several publications emphasizing that
axially viewed systems are more susceptible to EIE´s interferences than radially viewed ones. However, the operating conditions and the sample introduction system employed should be taken into account because both can interfere in analyte emission intensities. Selection of a proper sample introduction system, use of robust operation conditions, selection of a proper observation height in radially systems and the use of an auxiliary correction method, such as internal standard or standard additions, are strategies that could be adopted to circumvent matrix effects.
Matrix effects due to the presence of Li, Mg, and Na in environmental samples caused enhancement of K emission intensities. However, mathematical correction approaches provided a reliable tool to overcome the effects and avoided the use of time-consuming procedures such as matrix matching, standard additions method or gradual sample dilution.16
Interferences caused by the presence of Ca are worse than those caused by K or Na in axially viewed systems.17
For Na, line intensity attenuation for intermediate-energy spectral lines can be attributed mainly to interferences in the aerosol generation and transport systems. On the other hand, the Mg II / Mg I ratio remained constant in the presence of Na.17 However, suppression of high-energy
spectral line intensities by Ca has been widely attributed to energy withdrawal required to atomize the high-salt aerosols. This is accompanied by a decrease in the
excitation temperature and robustness of the plasma. Chan and Hieftje18 observed that there is a correlation between
matrix effects and the second ionization potential of the interfering element in radially viewed ICP OES. Matrix effects caused by elements with a low second ionization potential, specially those with potential lower than 15 eV (the first ionization potential of Ar is 15.75 eV), are more severe than those from matrix elements having a low first ionization potential. According to Iglésias et al.19 the
magnitude of matrix effects in axially viewed ICP OES systems depends on the plasma operating conditions (power and carrier gas flow rate). In addition, resonant lines are more sensitive to auto-absorption effects than non-resonant lines, even under robust conditions.20
Analysis of these publications indicate the complexity of the matrix effects in ICP OES. However, accuracy was improved when Sb, Sc, Y, or Be were used as internal standards in axially viewed ICP OES.17
Stepan et al.21 evaluated the internal standard method
for correction of matrix effects due to the presence of Na, Ca, and HNO3 on emission lines of 18 elements in an axially viewed ICP OES. Matrix effects were observed, but they were attenuated using robust operating conditions. Internal standardization was efficient when some factors were combined: use of robust conditions, ionic lines selection and internal addition using additive effects rather than the multiplicative effects generally used. Sun et al.22
proposed the use of Sc as internal standard for the correction of effects caused by Al, Fe, and Na and they recommended a mixture of Sc and Ni as internal standards when sample solutions had elevated concentrations of Ca and Mn, whose interference effects were worse. The choice of Ni was based on the fact that this element has elevated energy sum (14.03 eV). Grotti et al.23 proposed a method
for the analysis of Pb in bones and matrix effects caused due to the presence of elevated concentration of Ca were eliminated using Co as internal standard. Memory effects were observed in B analysis24 and matrix effects caused
changes in analyte emission intensities. These effects were attributed to the presence of albumine in blood samples analysed by an axially viewed ICP OES after the dissolution in Triton X-100 medium. However, effects were corrected adopting the internal standard method.
is recommended for axially viewed configuration in order to minimize matrix effects during analysis of complex samples. Internal standardization became a well established correction method and frequently a single element could be used as internal standard for various analytes.
2.2. Use of ICP OES with axially viewed configuration for analysis of complex samples
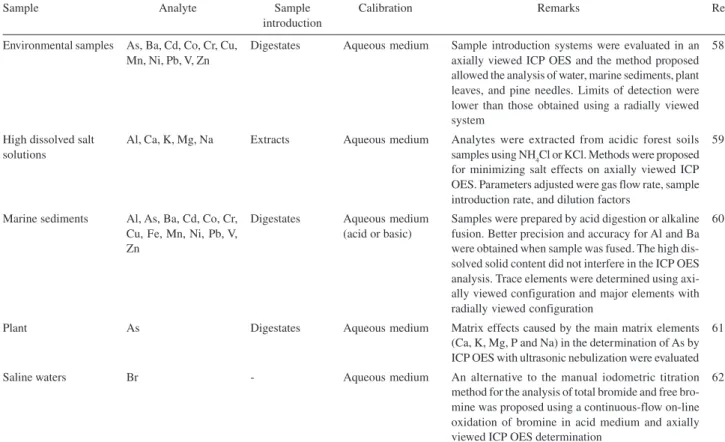
The literature shows that ICP OES axially viewed configuration has been employed for routine and complex sample analysis. It is shown in Table 1 selected applications of this configuration published in the literature between the years 1999 and 2006. Despite worries about matrix effects occurrence and the few publications about slurry introduction in axially viewed systems presented in Brenner and Zander’s review,1 slurry analysis
publications are increasing and seem to be an attractive alternative for difficult to decompose samples. Spectral interferences related to the high amount of matrix constituents, solid particle deposition in the optical interface and EIE’s interferences did not affect severely slurry analysis. When compared to techniques such as X-ray fluorescence (XRF) for cement analysis, the use of ICP OES presented some advantages, such as lower matrix-interference effects, better sensitivity, linearity of calibration curves over several orders of magnitude, excellent reproducibility, great versatility and the possibility of analyzing non-metallic elements, such as C, B, P, and S.25
Generally, grinding steps have to be adopted in analytical routine for the analysis of slurry samples. The ideal particle size to be introduced in ICP OES is an important parameter. Bigger particles could not reach the plasma or they could not be efficiently converted to excited atoms or ions during the short residence time in plasma. The ideal particle size is dependent on the type of sample introduction system used, on the thermochemical behavior of particles and on the properties of the plasma.26 However,
cement slurries27,30 with particle sizes lower than 38 µm
were accurately analysed using an axially viewed ICP OES. Babington or V-groove nebulizers are suitable for slurry nebulization in order to avoid clogging.
The calibration is a critical difficulty in slurry analysis by ICP OES. The presence of solid particles could interfere in slurry transport and nebulization and requires more energy of the plasma. The dissociation of refractory species present in slurries could be different when compared to aqueous solutions. Additionally, residence times could also be altered. Some publications proposed the use of increasing masses of certified reference
materials for the calibration,25-27 but aqueous solutions
could also be used.27,31-33
The use of the generalized standard additions method (GSAM), an expansion of the conventional standard additions method, has also been proposed for slurry analysis in a dual view28 and in an axially viewed ICP
OES.29 In a simplified way, it is based on the idea that
both quantities of reference solution and sample mass are changed. The GSAM uses multiple linear regression to process data obtained for multi-component samples in which the response/analyte concentration relationship is of arbitrary polynomial order. Multivariate models can be obtained. This method allows the observation of interferences and the quantification of the magnitude of interferences.
The simplified GSAM was successfully used for the analysis of clay and refractory material slurries by ICP OES with axial viewing.29 The model proposed allowed
the simultaneous correction of matrix and transport effects that affect slurry analysis and it is an alternative to direct analysis of slurries without the critical limitations caused by calibration strategies and particle size distribution.
The publications dealing with applications of ICP OES with axially viewed configuration presented in Table 1 indicate the increasing use of this system and its applicability in routine analysis.25-62 Combination of microwave ovens for
sample preparation and axially viewed systems for sample analysis is an efficient way to obtain time reduction and detection limits improvement. Matrix effects were not generally mentioned as an analytical limitation.
2.3. Figures of merit for ICP OESís with axially and radially viewed configurations
The use of ICP OES with axial viewing not only improves detection limits but also the number of parameters that exerts a pronounced influence on signals is reduced to two, namely the radio-frequency applied power and the nebulizer gas flow rate. In contrast, in radially viewed equipments the viewing height must also be taken into account. Thus, plotting response surfaces for optimization of axially viewed plasma is simpler.63 However, emission
lines behavior is complex and depends on the wavelength, the energy and the ionization state, leading to different shapes of the response surface. Factorial designs are proposed in several works for optimization of operating conditions of axially viewed systems, leading to bi-dimensional graphs with information about interactions in instrumental parameters.63-65 Equations could be established
Cement
Clay
Cement
Cement, gypsum and basic slag
Clay and refractory materials Biological materials Titanium nitride Titanium dioxide High-purity iron Electrolytic copper Canned food Biological samples Titanium dioxide Lubricating oil Biological materials Bovine liver Airborne particulate matter Biological materials
Al, Ca, Fe, K, Mg, Mn, Na, P, S, Si, Sr, Ti Al, Ca, Fe, K, Mg, Na, Si, Ti
Al, Ca, Fe, Mg, Mn, P, S, Si, Sr, Ti
Al, Ca, Fe, Mg, Mn, S, Si
Al, Ca, Fe, K, Mg, P, Si, Ti
Hg and Se
Ca, Cr, Fe, Mg, Ni, Si, Ti, Zr
Al, Ca, Cr, Fe, Mg, P, Pb, Si, V
Mo, Nb, Ta, Ti, V, Zr As, Fe, Mn, Sb, Sn, Pb
Sn
Si
Al, Cd, Cr, Fe, Mn, P, Zn, Zr
Residual carbon content
Residual carbon content
Ca, Cu, Fe, Mg, Mn, Zn
Al, As, Cd, Cr, Cu, Fe, Mn, Ni, Pb, Sb, Ti, V
As, Cd, Cu, Fe, Hg, Mn, Se, Zn Slurry Slurry Slurry Slurry Slurry Slurry Slurry Slurry Digestates Digestates Digestates Digestates Digestates Digestates Digestates Digestates Digestates Digestates Slurries containing CRMa Slurries containing CRMa Aqueous medium and slurries containing CRMa
GSAMb Aqueous medium Aqueous medium Aqueous medium Aqueous medium Matrix matching Aqueous medium and matrix matching
Aqueous medium Basic medium (TMAH)c Aqueous medium Aqueous medium Aqueous medium Aqueous medium Aqueous medium Aqueous medium
Slurries were prepared in 0.01 % (m/v) glycerol + 1 % (m/v) HCl
Slurries were prepared in10 % (m/v) HNO3
Slurries were prepared in 1 % (m/v) HCl. Aqueous medium calibration was feasible, except for Si and Ti. Ground samples presented particle sizes < 38 mm Slurries were prepared in 0.01 % (m/v) glycerol + 1 % (m/v) HCl
Mechanochemical synthesis promoted by an impact ball mill was employed for the synthesis of new com-pounds. Chemical modifiers were used: LiBO2 and Na2CO3. Slurries were prepared in 10 % (m/v) HNO3. Increment of emission intensities of analytes were observed in an axially viewed ICP OES
An on-line chemical vapor generation system was coupled to the axially viewed ICP OES for analysis of slurries prepared with 5 % (m/v) K2S2O8, addition of HCl and heating at 90 °C
Slurries were prepared with polyacrylate amine as dispersant
Slurries were prepared with polyacrylate amine as dispersant
Co-precipitation with cupferron
Satisfactory results were obtained with axially viewed ICP OES using both calibration methods. Separation of Cu by electrodeposition was mandatory for ICP-MS measurements
Samples were decomposed in a focused-microwave oven. Emission line at 189.927 nm was not affected by interferences
Samples were decomposed in an autoclave micro-wave oven using 25 % (m/v) TMAHc
Cavity-microwave oven was used for sample decom-position employing a mixture of aqua regia and HF. The addition of H3BO3 to avoid fluoride attack to the quartz torch strongly affected the axially viewed ICP OES measurements
The work evaluated the efficiency of a decomposi-tion procedure performed in a focused-microwave oven with six reaction vessels
Samples were decomposed in a cavity-microwave oven using HNO3 + H2O2. The feasibility of C determination by ICP OES was evaluated. Urea was used for calibra-tion. The axially viewed system presented higher sensi-tivity when compared to the radial viewed system An acid vapor partial digestion procedure was pro-posed using a focused-microwave oven and a labo-ratory-made PTFE support
Airborne particulate matter was deposited in glass fi-bers filters, which were decomposed in a cavity-mi-crowave oven with a mixture of HNO3 + HF + HClO4 The efficiency of decomposition of some procedures was evaluated. The influence of the digestion equip-ment was negligible if the digestion time employed is long enough. Residual carbon content interfered in As and Se determination by ICP OES with axially viewed configuration 25 26 27 28 30 31 32 33 34 35 36 37 38 39 40 41 42 43 Table 1. Analytical applications of ICP OES with axially viewed configuration published from 1999 to 2006
Sample Analyte Sample Calibration Remarks Ref.
Silicate rocks
Coffee and milk
Coconut water
Chocolate flavored beverages
Honey
Soil
Coffee and sugar-cane spirits
Milk
Milk
Clay
Plant materials
Biological samples
High-salinity waters
Sheep faeces
Al, Ca, Cr, Fe, K, La, Mg, Na, P, Si, Sr, Ti, V, Y
Ca, Cu, Fe, K, Mg, Mn, P, Se, Sn, Zn
Cu and Zn
Ca, Cr, Cu, Fe, Mg, Mn, Mo, Na, S, Se, P, Zn
Ca, Cd, Co, Cu, Fe, Mn, Ni, Pb, Zn
As, Cu, Pb, Sb, Zn
Al, Ca, Cu, Fe, K, Mg, Mn, Na, Pb, S, Se, Si, Sn, Sr, Zn
Ba, Ca, Cu, K, Mg, Na, P, Zn
Cl, Br, I
Al, Ca, Fe, K, Mg, Na, Si, Ti
Residual carbon content
Ca, Cu, K, Mg, Na, P, S, Zn
Cd, Cu, Fe, Mn, Pb
Dy, Eu, Yb
Digestates
Solubilization in TMAHc
Direct analysis
Digestates
Digestates
Digestates
Digestates
Digestates
Digestates
Digestates
Digestates
Digestates
-Digestates
Aqueous medium with the addition of LiBO2
Basic medium (TMAH)c
Aqueous medium
Aqueous medium
Aqueous medium
Aqueous medium
Aqueous medium
Aqueous medium
Aqueous medium
Aqueous medium
Aqueous medium
Aqueous medium
Aqueous medium
Aqueous medium
Samples were decomposed by fusion with LiBO2 and were 1,000 times diluted. The sensitivity of the ICP OES with axially viewed configuration allowed suit-able measurements and no salt deposition was ob-served
25% (m/v) TMAHc solution was added to the sample
and it was heated at 80 oC. The proposed method was
fast, easy, simple, reproducible and promoted com-plete solubilization of samples
Solutions containing 20% (m/v) of the matrix were prepared in 2% (m/v) HNO3. The radially viewed con-figuration was used for Ca, Mg, Mn and Fe determi-nation
Samples were decomposed in a focused-microwave oven using HNO3 + H2O2. Data obtained was exam-ined by multivariate analysis
Samples were decomposed in a cavity-microwave oven with HNO3 + H2O2 or submitted to ultrasonication. Matrix effects and spectral interferences were not observed
Samples were decomposed by ultrasonication with aqua regia for 9 min at 50 oC. Al, Ca and Fe caused
interferences in both axially and radially viewed con-figurations
Samples were acid decomposed. Pattern recognition techniques were applied to data sets in order to char-acterize samples considering their geographical source and production mode (industrial or homemade and organically or conventionally produced) Samples were gradually added to pre-heated acids in a focused-microwave oven. The digestion efficiency of the proposed procedure was better than the con-ventional procedure
Samples were decomposed in both closed vessel and focused microwave oven. In order to avoid volatile species loss, analytes were precipitated as non-soluble salts (AgCl, AgBr, AgI), separated and solubilized with ammonium hydroxide
Samples were decomposed in a closed-vessel micro-wave oven using aqua regia and HF, followed by the addition of H3BO3 in order to prevent the quartz torch degradation
Diluted HNO3 were used for closed-vessel microwave oven decomposition. The high pressure reached for closed-vessel improved the oxidative action of HNO3, even in diluted medium
Sample decomposition was performed in a commer-cial stainless steel oxygen bomb operating at 25 atm and digestates were diluted in HNO3 or water-soluble tertiary amines
A preconcentration procedure was proposed using col-umns. When Cd and Pb concentrations were low, ETAAS was used instead of the axially viewed ICP OES Samples were digested in a closed-vessel microwave oven using HNO3 + H2O2. Dysprosium, Eu and Yb were used as sheep faecal markers. Limits of detection obtained with axially viewed configuration were at least three-fold bet-ter than those obtained using radial system
44
45
46
47
48
49
50
51
52
53
54
55
56
57 Table 1. cont.
Sample Analyte Sample Calibration Remarks Ref.
The sample introduction system is an important factor for obtaining accurate and precise results in ICP OES. Factorial designs were also proposed as a simple procedure to evaluate plasma conditions with the use of different sample introduction systems.66 Results indicated that
robust conditions were dependent on the type of nebulizer used. The V-groove nebulizer seemed to be less efficient when using low nebulizer gas flow rate than the concentric nebulizer. Robust conditions evaluated using the Mg II / Mg I ratio were attained at high power and high nebulizer gas flow rate when V-groove nebulizer was employed.
The use of others ionic to atomic line intensity ratios rather than Mg was proposed for axially viewed ICP OES diagnostic.67 The intensity of emission lines for Cd, Cr,
Mg, Ni, Pb, and Zn were monitored, and Cr and Mg lines were more sensitive to both matrix effects and ICP OES configuration. The use of 10 g L-1 Cs solution as a buffer
for matrix effects suppression caused by high concentrations of Li and Na was also proposed.67
The Pb II / Pb I line intensity ratio was used as a diagnostic tool for the chemical vapor generation of As, Bi, Ge, Hg, Sb, Se, Sn, and Te using NaBH4 and measurements by an axially viewed ICP OES. The main operating parameters affecting chemical vapor generation and transport were varied according to a procedure based
on experimental design and empirical modeling concepts.68
Chausseau et al.69 observed that radio-frequency
power and sample and nebulizer gas flow rates had great influence on time correlation between emission lines of the same element in an axially viewed ICP OES. However, the elements analysed did not present a similar behavior when those parameters where changed and a general behavior could not be established. Optimized operating conditions were established using a radio-frequency power of 1,100 W and a nebulizer gas flow rate of 0.6 L min-1. Adopting these conditions,
adequate repeatability and correlation were obtained for all lines of the same element, independent of working with ionic or atomic lines.
Similar self-absorption effects were observed when axially and radially viewed systems were compared,20 with
a better signal-to-noise ratio for the axially viewed equipment. However, self-absorption effects for resonant lines were more evident in the axially viewed system. Plotting the Mg II 279 nm / Mg II 280 nm and the Mg II 279 nm / Mg I 285 nm line intensity ratios was an efficient mean of detecting the occurrence of self-absorption effects. When these effects were observed, the calibration should be divided into two parts: the first part for low concentrations not affected by self-Table 1. cont.
Sample Analyte Sample Calibration Remarks Ref.
introduction
Environmental samples
High dissolved salt solutions
Marine sediments
Plant
Saline waters
As, Ba, Cd, Co, Cr, Cu, Mn, Ni, Pb, V, Zn
Al, Ca, K, Mg, Na
Al, As, Ba, Cd, Co, Cr, Cu, Fe, Mn, Ni, Pb, V, Zn
As
Br
Digestates
Extracts
Digestates
Digestates
-Aqueous medium
Aqueous medium
Aqueous medium (acid or basic)
Aqueous medium
Aqueous medium
Sample introduction systems were evaluated in an axially viewed ICP OES and the method proposed allowed the analysis of water, marine sediments, plant leaves, and pine needles. Limits of detection were lower than those obtained using a radially viewed system
Analytes were extracted from acidic forest soils samples using NH4Cl or KCl. Methods were proposed for minimizing salt effects on axially viewed ICP OES. Parameters adjusted were gas flow rate, sample introduction rate, and dilution factors
Samples were prepared by acid digestion or alkaline fusion. Better precision and accuracy for Al and Ba were obtained when sample was fused. The high dis-solved solid content did not interfere in the ICP OES analysis. Trace elements were determined using axi-ally viewed configuration and major elements with radially viewed configuration
Matrix effects caused by the main matrix elements (Ca, K, Mg, P and Na) in the determination of As by ICP OES with ultrasonic nebulization were evaluated An alternative to the manual iodometric titration method for the analysis of total bromide and free bro-mine was proposed using a continuous-flow on-line oxidation of bromine in acid medium and axially viewed ICP OES determination
58
59
60
61
62
absorption effects, which is adjusted with a linear regression, and the second part for high concentrations, that is adjusted with a polynomial regression. The authors concluded that the axial mode seemed to have definitive advantages over radial viewing.20 Similar conclusions were presented when
figures of merit of both systems were compared.70 Axially
viewed configuration presented better detection power, even when complex samples were analysed. Detection limits and BEC values did not change significantly when multi-element solutions containing high carbon concentrations (up to 10,000 mg L-1) were analysed in an axially viewed ICP OES, despite
the slightly longer warm up time for this configuration, i.e.
20 or 10 min for axial and radial viewings, respectively. A few works in the literature compare the perfor-mance of dual view ICP OES systems, i.e. a single instrument with axially and radially viewed confi-gurations.71-73 The advantage of this system consists in
an effective comparison between both configurations because all the other components remain constant. The selection of axial configuration gave better detection limits without significant degradation due to matrix effects, even when a water-soluble tertiary amine solution (CFA-C, Spectrasol, Warwick, NY, USA) was used for milk dilution.71 However, it is important to emphasize
the need for adequate interfaces for plasma tail cut off. Measurements in the plasma tail zone with pronounced temperature gradients are severely affected by inter-ferences mainly caused by the formation of molecular compounds and to the presence of EIE’s. If plasma tail is not removed, interferences would be worse than those observed in radially viewed systems.72
The comparison of the efficiency of both end-on and shear gas interfaces for plasma tail cut off is difficult due to the inexistence of equipment that allows the use of both interfaces. Thus, small variations in instrumental parameters (torch internal diameter, optical arrangement, and sample introduction system) could affect the results. However, it was already shown74 that axially viewed
plasma excitation temperature and electronic density measured using Fe emission intensity lines presented similar values using both interfaces. In general, it was observed that both parameters changed with the increase of applied power. Additionally, the presence of Na in the samples caused a decrease in plasma excitation temperature and electronic density and it was related with matrix effects observed for this plasma configuration. Silva
et al.75 evaluated the behavior of two equipments with
different interfaces for the analysis of milk samples diluted in a 10% (v/v) CFA-C solution and observed higher values of Mg II / Mg I ratio in the equipment with shear gas interface. However, these values were less affected by
changes in instrumental parameters when using the end-on gas interface. Determinatiend-ons with proper accuracies were obtained for a certified reference material of powered whole milk diluted in CFA-C using equipments mounted with each interface.
2.4. Sample introduction systems and torches for ICP OES with axially viewed configuration
Axially viewed ICP OES configuration allows better detection limits than radially viewed systems. However, the sample introduction system is still considered an obstacle for major improvements in the limits of detection. Liquid sample introduction is generally performed using nebulizers that convert the liquid into an aerosol. The spray chamber selects the droplet size for introduction into the plasma. Bigger droplets are removed. Pneumatic nebulizers are more common and present two basic configurations: concentric and cross-flow. Ultrasonic nebulizers are capable of 10-fold improvement on detection limits.76
Desboeufs et al.77 evaluated two sample introduction
systems for an axially viewed ICP OES. The first one was composed by a Meinhard pneumatic concentric nebulizer and a glass cyclonic spray chamber, while the second one was composed by an ultrasonic nebulizer and a desolvation system. As expected, they observed better performance for ultrasonic nebulization for sample introduction, stability and sensitivity. In addition, detection limits were improved by an average of 6-fold, with a minimum factor of 1.5 for Mn and up to a 44.3 for K. Limits of detection slightly lower than those obtained by ICP-MS were reached using pre-concentration in a micro-column and ultrasonic nebulization.78 The sensitivity was improved
up to 400-fold when compared to a conventional pneumatic nebulizer.
O’Brien et al.79 evaluated the direct injection high
efficiency nebulizer (DIHEN) in axially viewed plasma. The DIHEN is a micronebulizer that requires the introduction of low solution uptake rates (1 to 100 µL
min-1) and nebulizer gas flow-rates (< 0.2 L min-1) when
compared to conventional sample introduction systems. Figures of merit of DIHEN were similar or superior to those obtained by conventional nebulization. However, Mg II / Mg I ratio was smaller with the use of DIHEN and indicated that with this nebulizer the plasma is more sensitive to matrix effects. The use of argon mixed with oxygen for plasma formation reduced some of the observed interferences.
Recently ITV was coupled to axially viewed systems and the precision and detection limits obtained from single element solutions were impressive.80-82 Sample is
deposited onto or into a rhenium probe and the probe is inserted into a small volume vaporization chamber that is attached to a typical ICP OES torch. Micro-samples of liquids, slurries, or solids are dried, charred and vaporized into the chamber by applying progressively higher electrical power levels. The vaporized sample is carried to the central channel of the plasma by a carrier gas. The system allowed the individual biological cell analysis for nanograms or nanoliters of samples. The ITV-ICP OES analysis minimizes sample preparation steps and costs.
Generally, axiall y viewed systems pr esent limitations for high total dissolved solids analysis due to the progressive salt deposition into the injector tube of the torch causing clogging. Samples containing such as 25 % m v-1 NaCl frequently have to be diluted or
subjected to other treatment prior to analysis. A torch that can handle with high total dissolved solid samples was recently proposed.83 The injector of the new torch
was gradually tapered, which provided a smooth transition from the 5 mm id of the transfer tube to the 2.3 mm id of the injector tip. In addition, the new torch was 20 mm shorter in length in order to minimize quartz surface devitrification and prolong its lif etime. Solutions containing high concentration of dissolved solids affected the torch lifetime mainly because of the deposition of crystals in the external torch tube. This effect can be reduced by increasing the flow-rate of the auxiliary gas from 1.0 to 2.5 L min-1.
Another modification proposed for axially viewed torches was the use of air to cool the torch wall. The performance of this low-flow air cooled torch was similar to the one reached for a conventional torch. The main advantage of this system is the reduction in argon consumption. Most equipment requires a minimum of 15 L min-1 of Ar. Using the low-flow torch, the consumption
can be reduced to 7 L min-1.84 However, detection limits
in the region of 200 nm was poorer by approximately a factor of two.
2.5. Special applications of ICP OES with axially viewed configuration
The vacuum ultraviolet spectral (VUV) region is composed by wavelengths below 180 nm. Analytical measurements in this region are difficult because the radiation is absorbed by components of air, such as oxygen or water vapor. Moreover, it is necessary the
use of a detector sensitive to wavelengths in this region. Absorption by air components can be eliminated by flushing the spectrometer with an inert gas to evacuate the optical system. However, instrument costs increase. Interfaces using Ar as end-on gas remove the plasma tail and avoid the presence of air between plasma and the ICP OES optics, thus minimizing interferences in low wavelengths.85 The possibility of analyzing the
VUV region increases the capability of ICP OES with axially viewed configuration. The improved detection limits of this configuration allowed the determination of metals and non-metals (Cl, Br, I, P, and S).85-87
Alternative lines can also be used for other elements that suffer from interferences.
Laser ablation is another alternative for ICP OES direct solid sample analysis and presented results comparable to those obtained using acid decomposition for geological materials. In this case, Sc and Y was mixed to the solid sample and used as internal standards.88 Laser ablation in
the infra-red region was used for steel analysis in a dual view ICP OES. Radially viewed configuration presented larger linear calibration range than the axially viewed one.89
Other applications of axially viewed configurations include the coupling of electrothermal vaporization with ICP OES (ETV-ICP OES). Graphite boats containing the sample were heated and a gas flow introduced the sample into the ICP OES. This system was used for the speciation of Al in silicon carbide samples.90 The use of tungsten
coil was also proposed as electrothermal vaporizer for ICP OES with axially viewed configuration for Cd determination in urine samples.91,92 The tungsten coil was
extracted from the glass casing of a standard slide projector tube and firmly placed in the laboratory-made mount. Electrical connections heated the coil and vaporized the sample.
The coupling to high performance liquid chromatograph (HPLC-ICP OES) allowed the deter-mination of arsenic species, As(III), As(V), mono-methylarsenic e dimono-methylarsenic.93 In addition, the
development of a polychromator for ICP OES with axially viewed configuration was also published in the literature.94
3. Conclusions
of plasma in axial viewing are not a major problem anymore mainly because efficient interfaces were developed for plasma tail cut off. According to Chausseau
et al.,20 the poor reputation of axial viewing with regard
to self-absorption effects seems to be “unjustified” and this viewing mode “has definite advantages over radial viewing”.
As sta ted by Mer met,95 the keywor d “total”
summarizes the current trends in ICP OES: total observation of the central channel through axial viewing, total sample consumption with high efficiency of direct injection nebulizers and total information, in terms of wavelength range, time correlation, and replicates.
Complex sample analysis, such as the introduction of slurries, can be performed accurately by ICP OES with axially viewed configuration. On the other hand, the combination of microwave-assisted sample preparation and axially viewed ICP OES systems can improve analysis time and led to improved detection limits. However, the torch lifetime can be reduced due to gradual salt deposition on torch walls.
It can be concluded that ICP OES with axial viewing is successfully applied for routine analysis of samples containing simple and complex matrixes and this again extends the analytical capability of emission measure-ments using inductively coupled plasmas. Most applications based on radial viewing can also be performed using axial viewing, and the most critical penalty could be related to the quartz torch lifetime for samples containing high amount of dissolved solids.
Acknowledgments
The authors are thankful to Fundação de Amparo à Pesquisa do Estado de São Paulo (FAPESP) and to Conselho Nacional de Desenvolvimento Científico e Tecnológico (CNPq) for financial support.
References
1. Brenner, I. B.; Zander, A. T.; Spectrochim. Acta B 2000, 55, 1195.
2. Mermet, J. M.; J. Anal. At. Spectrom., 2005 20, 11.
3. Ivaldi, J. C.; Tyson, J. F.; Spectrochim. Acta B 1995, 50, 1207. 4. Abdallah, M. H.; Diemiaszonek, R.; Jarosz, J.; Mermet, J. M.;
Robin, J.; Trassy, C.; Anal. Chim. Acta 1976, 84, 271. 5. Dubuisson, C.; Poussel, E.; Mermet, J. M.; J. Anal. At. Spectrom.
1997, 12, 281.
6. Brenner, I. B.; Zander, A.; Cole, M.; Wiseman, A.; J. Anal. At. Spectrom. 1997, 12, 897.
7. Dubuisson, C.; Poussel, E.; Mermet, J.M.; J. Anal. At. Spectrom. 1998, 13, 1265.
8. Mermet, J. M.; J. Anal. At. Spectrom. 1998, 13, 419. 9. Dubuisson, C.; Poussel, E.; Mermet, J. M.; Todoli, J. L.; J.
Anal. At. Spectrom. 1998, 13, 63.
10. Ivaldi, J. C.; Tyson, J. F.; Spectrochim. Acta B 1996, 51, 1443. 11. http://www.isiwebofknowledge.com/ acessed in April, 2006. 12. Todoli, J. L.; Mermet, J. M.; Spectrochim. Acta B1999, 54,
895.
13. Grotti, M.; Frache, R.; J. Anal. At. Spectrom. 2003, 18, 1192. 14. Grotti, M.; Magi, E.; Leardi, R.; J. Anal. At. Spectrom. 2003,
18, 274.
15. Todoli, J. L.; Gras, L.; Hernandis, V.; Mora, J.; J. Anal. At. Spectrom. 2002, 17, 142.
16. Li, Y. H.; Vansickle, H.; At. Spectrosc. 2004, 25, 21. 17. Brenner, I. B.; Le Marchand, A.; Daraed, A.; Chauvet, L.;
Microchem. J. 1999, 63, 344.
18. Chan, G. C. Y.; Hieftje, G. M.; Spectrochim. Acta B 2005, 61, 642.
19. Iglésias, M.; Vaculovic, T.; Studynkova, J.; Poussel, E.; Mermet, J. M.; Spectrochim. Acta B 2004, 59, 1841.
20. Chausseau, M.; Poussel, E.; Mermet, J. M.; Fresenius J. Anal. Chem. 2001, 370, 341.
Lilian C. Trevizan obtained a M.Sc. degree in 2003 and a Ph.D. degree in Analytical Chemistry in 2007, both from University Federal of Sıo Carlos. She has experience with microwave-assisted sample preparation and inductively coupled plasma optical emission spectrometry (ICP OES). Nowadays she is acting as a postdoctoral at the Center of Nuclear Energy in Agriculture (CENA), University of Sıo Paulo in Piracicaba and she works with laser induced breakdown spectroscopy (LIBS) with Dr. Francisco J. Krug.
21. Stepan, M.; Musil, P.; Poussel, E.; Mermet, J. M.; Spectrochim. Acta B 2001, 56, 443.
22. Sun, Y.; Wu, S.; Lee, C.; J. Anal. At. Spectrom. 2003, 18, 1163. 23. Grotti, M.; Abelmoschi, M. L.; Riva, S. D.; Soggia, F.; Frache,
R.; Anal. Bional. Chem. 2005, 381, 1395.
24. Caravaglia, R. N.; Rebagliati, R. J., Roberti, M. J.; Batistoni, D. A.; Spectrochim. Acta B 2002, 57, 1925.
25. Marjanovic, L.; Mccrindle, R. I.; Botha, B. M.; Potgieter, H. J.; J. Anal. At. Spectrom. 2000, 15, 983.
26. Silva, C. S.; Nóbrega, J. A.; Blanco, T.; Quim. Nova 2002, 25, 1194.
27. Silva, C. S.; Blanco, T.; Nóbrega, J. A.; Spectrochim. Acta B 2002, 57, 29.
28. Marjanovic, L.; Mccrindle, R. I.; Botha, B. M.; Potgieter, H. J.; Anal. Bioanal. Chem. 2004, 379, 104.
29. Santos, M. C.; Nóbrega, J. A.; J. Anal. At. Spectrom. 2007, 22, 93. 30. Santos, M. C.; Nogueira, A. R. A.; Nóbrega, J. A.; J. Braz.
Chem. Soc. 2005, 16, 372.
31. Santos, E. J.; Herrmann, A. B.; Frescura, V. L. A.; Curtius, A. J.; Anal. Chim. Acta 2005, 548, 166.
32. Wang, Z.; Ni, Z.; Qiu, D.; Chen, T.; Tao, G.; Yang, P.; Spectrochim. Acta B, 2005, 60, 361.
33. Wang, Z.; Ni, Z.; Qiu, D.; Chen, T.; Tao, G.; Yang, P.; J. Anal. At. Spectrom. 2004, 19, 273.
34. Ide, K.; Nakamura, Y.; Mat. Transaction 2002, 43, 1409. 35. Santos, E. J.; Herrmann, A. B.; Olkuszewski, J. L.; Saint’Pierre,
T. D.; Curtius, A. J.; Braz. Arch. Bio. Tech. 2005, 48, 681. 36. Perring, L.; Basic-Dvorzak, M.; Anal. Bioanal. Chem. 2002,
374, 235.
37. Hauptkorn, S.; Pavel, J.; Seltner, H.; Fresenius J. Anal. Chem. 2001, 370, 246.
38. Korn, M. G. A.; Ferreira, A. C.; Costa, A. C. S.; Nóbrega, J. A.; Silva, C. R.; Microchem. J. 2002, 71, 41.
39. Costa, L. M.; Silva, F. V.; Gouveia, S. T.; Nogueira, A. R. A.; Nóbrega, J. A.; Spectrochim. Acta B 2001, 56, 1981. 40. Gouveia, S. T.; Silva, F. V.; Costa, L. M.; Nogueira, A. R. A.;
Nóbrega, J. A.; Anal. Chim. Acta 2001, 445, 269.
41. Trevizan, L. C.; Nogueira, A. R. A.; Nóbrega, J. A.; Talanta 2003, 61, 81.
42. Marrero, J.; Rebagliati, R. J.; Gómez, D.; Smichowski, P.; Talanta, 2005, 68, 442.
43. Wasilewska, M.; Goessler, W.; Zischka, M.; Maichin, B.; Knapp, G.; J. Anal. At. Spectrom. 2002, 17, 1121.
44. Brenner, I. B.; Vats, S.; Zander, A. T.; J. Anal. At. Spectrom. 1999, 14, 1231.
45. Ribeiro, A. S.; Moretto, A. L.; Arruda, M. A. Z.; Cadore, S.; Microchim. Acta 2003, 141, 149.
46. Souza, R. A.; Baccan, N.; Cadore, S.; J. Braz. Chem. Soc. 2005, 16, 540.
47. Pedro, N. A. R.; Oliveira, E.; Cadore, S.; Food Chem. 2006, 95, 94.
48. Mendes, T. M. F. F.; Baccan, N.; Cadore, S.; J. Braz. Chem. Soc. 2006, 17, 168.
49. Vaisanen, A.; Ilander, A.; Anal. Chim. Acta 2006, 93, 570. 50. Fernandes, A. P.; Santos, M. C.; Lemos, S. H.; Ferreira, M. M.
C.; Nogueira, A. R. A.; Nóbrega, J. A.; Spectrochim. Acta B 2005, 60, 717.
51. Santos, D. M.; Pedroso, M. M.; Costa, L. M.; Nogueira, A. R. A.; Nóbrega, J. A.; Talanta 2005, 65, 505.
52. Naozuka, J., Veiga, M. A. M. S.; Oliveira, P. V.; Oliveira, E.; J. Anal. At. Spectrom, 2003, 18,917.
53. Silva, C. R.; Nóbrega, J. A.; Blanco, T.; Quim. Nova 2005, 28, 137.
54. Araújo, G. C. L.; Gonzalez, M. H.; Ferreira, A. G.; Nogueira, A. R. A.; Nóbrega, J. A.; Spectrochim. Acta B 2002, 57, 2121. 55. Souza, G. B.; Carrilho, E. N. V. M.; Oliveira, C. V.; Nogueira, A. R. A.; Nóbrega, J. A.; Spectrochim. Acta B 2002, 57, 2195. 56. Grotti, M.; Abelmoschi, M. L.; Soggia, F.; Frache, R.; Anal.
Bioanal. Chem. 2003, 375, 242.
57. Garcia, E. E.; Nogueira, A. R. A.; Nóbrega, J. A.; J. Anal. At. Spectrom. 2001, 16, 825.
58. Petry, C. F.; Pozebon, D.; Bentlin, F. R. S.; At. Spectrosc. 2005, 26, 19.
59. Hislop, J. E.; Hornbeck, L. W.; Comm. Soil Sci. Plant Anal. 2002, 33, 3377.
60. Posebon, D.; Martins, P.; At. Spectrosc. 2002, 23, 111. 61. Vassileva, E.; Hoenig, M.; Spectrochim. Acta B 2001, 56, 223. 62. Mitko, K.; Bebek, M.; At. Spectrosc. 2004, 25, 64.
63. Chausseau, M.; Poussel, E.; Mermet, J. M.; J. Anal. At. Spectrom. 2001, 16, 498.
64. Chausseau, M.; Poussel, E.; Mermet, J. M.; J. Anal. At. Spectrom. 2000, 15, 1293.
65. Grotti, M.; Lagomarsino, C.; Soggia, F.; Frache, R.; Annali Di Chimica 2005, 95, 37.
66. Trevizan, L. C.; Vieira, E. C.; Nogueira, A. R. A.; Nóbrega, J. A.; Spectrochim. Acta B 2005, 60, 575.
67. Dennaud, J.; Howes, A.; Poussel, E.; Mermet, J. M.; Spectrochim. Acta B 2001, 56, 101.
68. Grotti, M.; Lagomarsino, C.; Frache, R.; J. Anal. At. Spectrom. 2005, 20, 1365.
69. Chausseau, M.; Poussel, E.; Mermet, J. M.; Spectrochim. Acta B 2000, 55, 1431.
70. Silva, F. V.; Trevizan, L. C.; Silva, C. S.; Nogueira, A. R. A.; Nóbrega, J. A.; Spectrochim. Acta B 2002, 57, 1905. 71. Silva, J. C. J.; Baccan, N.; Nóbrega, J. A.; J. Braz. Chem. Soc.
2003, 14, 310.
72. Sengoku, S.; Wagatsuma, K.; Anal. Sci. 2006, 22, 245. 73. Chausseau, M.; Poussel, E.; Mermet, J. M.; Spectrochim. Acta
B 2000, 55, 1315.
74. Nam, S. H.; Kim, Y. J.; Bull. Korean Chem. Soc. 2001, 22, 827. 75. Silva, J. C. J.; Santos, D. M.; Cadore, S.; Nóbrega, J. A.; Baccan,
76. Montaser, A.; Golightly, D. W. eds. Inductively Coupled Plasmas In Analytical Atomic Spectroscopy, VCH Publisher: New York, 1992.
77. Desboeufs, K. V.; Losno, R.; Colin, J. L.; Anal. Bioanal. Chem. 2003, 375, 567.
78. Worrasettapong, W.; Ma, R.; Cox, A. G.; McLeod, C. W.; Intern. J. Environ. Anal. Chem. 2002, 82, 825.
79. O´Brien, S. E.; Chirinos, J. R.; Jorabchi, K.; Kahen, K.; Cree, M. E.; Montaser, A.; J. Anal. At. Spectrom. 2003, 18, 910. 80. Badiei, H. R.; Rutzke, M. A.; Karanassios, V.; J. Anal. At.
Spectrom. 2002, 17, 1007.
81. Badiei, H. R.; Smith, A. T.; Karanassios, V.; J. Anal. At. Spectrom. 2002, 17, 1030.
82. Smith, A. T.; Badiei, H. R.; Evans, J. C.; Karanassios, V.; Anal. Bioanal. Chem. 2004, 380, 212.
83. Nham, T. T.; Wiseman, A. G.; J. Anal. At. Spectrom. 2003, 18, 790.
84. Hasan, T.; Praphairaksit, N.; Houk, R. S.; Spectrochim. Acta B 2001, 56, 409.
85. Schulz, O.; Heitland, P.; Fresenius J. Anal. Chem. 2001, 371, 1070.
86. Houseaux, J.; Mermet, J. M.; J. Anal. At. Spectrom. 2000, 15, 979.
87. Krengel-Rothensee, K.; Richter, U.; Heitland, P.; J. Anal. At. Spectrom. 1999, 14, 699.
88. Kanicky, V.; Mermet, J. M.; Fresenius J. Anal. Chem.1999, 363, 294.
89. Kanicky, V.; Otruba, V.; Novotny, K.; Musil, P.; Mermet, J. M.; Fresenius J. Anal. Chem. 2001, 370, 287.
90. Hassler, J.; Zaray, G.; Schwetz, K.; Florian, K.; J. Anal. At. Spectrom. 2005, 20, 954.
91. Davis, A. C.; Calloway Jr, C. P.; Jones, B. T.; Microchem. J. 2006, 84, 31.
92. Davis, A. C.; Alligood, B. W.; Calloway Jr, C. P.; Jones, B. T.; Appl. Spectrosc. 2005, 59, 1300.
93. Chausseau, M.; Roussel, C.; Gilon, N.; Mermet, J. M.; Fresenius J. Anal. Chem. 2000, 366, 476.
94. Becker-Ross, H.; Florek, S.; Franken, H.; Radziuk, B.; Zeiher, M.; J. Anal. At. Spectrom. 2000, 15, 851.
95. Mermet, J. M.; J. Anal. At. Spectrom. 2002, 17, 1065.
Received: December 28, 2006
Web Release Date: July 6, 2007