A
r
ti
c
le
0103 - 5053 $6.00+0.00
*e-mail: [email protected]
Micelle-Mediated Extraction and Spectrophotometric Determination of Ammonia
in Water Samples utilizing Indophenol Dye Formation
Abbas Afkhami* and Rasoul Norooz-Asl
Faculty of Chemistry, Bu-Ali Sina University, Hamadan 65174 Iran
Foi investigado um processo de extração rápido, seletivo e sensível por ponto nuvem para extrair o indofenol, formado na reação de Berthelot com amônia, a partir de soluções aquosas. Utilizou-se a mistura do surfactante não iônico, Triton X-114, e do catiônico, brometo de cetiltrimetilamônio (CTAB). O método foi baseado na cor do corante indofenol produzido pela reação da amônia com fenol em meio alcalino e condições oxidantes, e na extração por ponto nuvem. Os efeitos da reação e dos parâmetros da extração foram estudados e otimizados. A linearidade obedeceu ao intervalo
de 2,00-125,00 ng mL-1 de amônia. O limite de detecção do método foi de 1,00 ng mL-1. Testou-se
também o efeito de interferência de alguns íons comum. Aplicou-se o método para a determinação do íon amônio em amostras de água naturais.
A rapid, selective and sensitive cloud point extraction process using the mixture of nonionic surfactant, Triton X-114, and cationic surfactant, cetyltrimethylammonium bromide (CTAB), to extract indophenol formed in the Berthelot reaction with ammonia from aqueous solutions was investigated. The method was based on the color reaction of ammonia with phenol under suitable oxidizing conditions in alkaline medium and cloud point extraction of produced indophenol dye. Effects of reaction and extraction parameters were studied and optimum parameters were
established. Linearity was obeyed in the range of 2.00-125.00 ng mL-1 of ammonia. The detection
limit of the method was 1.00 ng mL-1 of ammonia. The interference effect of some common ions
was also tested. The method was applied to the determination of ammonium in natural water samples.
Keywords: cloud point extraction, ammonia determination, indophenol, spectrophotometry, water samples
Introduction
Nitrogen is an essential nutrient for all forms of life in plants, animals and human. Nitrogen is required for the synthesis of amino acids, which are the building blocks of protein. Ammonia is an important source of nitrogen for living systems and found throughout the environment in the air, soil, and water; and in plants, animals and humans. Two most convenient species of nitrogen in water samples are unionized ammonia (NH3), when pH is above 9.75 and the ionized ammonium ion (NH4+) when the pH is below
8.75.1 Dissolved ammonia is one of the most important
pollutants in our environment and the main source of ammonia contamination is farming and agricultural activities.1,2 Exposure to high levels of ammonia can cause
irritation and serious burns on the skin and in the mouth,
throat, lungs, and eyes. At very high levels, ammonia can even cause death. Given its high toxicity and trace level in natural samples, the preconcentration and determination of ammonia has gained significant importance to a number of applications including environmental protection and agriculture sector.
Several methods have been reported for the determination of ammonia including spectrophotometry,1-10
solid-phase extraction diffuse reflectance spectroscopy,11
electrochemical methods,12,13 ion-chromatography,14,15
spectrofluorimetry,16 and capillary electrophoresis.17
The most widely applied method for the determination of ammonia in natural waters or other samples is based on the indophenol dye formation or Berthelot reaction.1-11
Due to ammonia low levels and the complicated matrices in environmental samples, it is usually necessary to apply a preconcentration method while separating the analyte from the concomitants. Several methods such as solid-phase extraction (SPE),1,3,11 headspace single-drop
microextraction (SPME),17 micro-phase sorbent extraction
and membrane filter,18 static headspace preconcentration,19
Amberlite XAD-720 have been used for preconcentration
of ammonia or its derivatives. Usually these methods are laborious and time consuming. They also present low precision and accuracy due to several sample preparation steps.
Micelle-mediated extraction has been used in several different matrices for trace organic or inorganic species determinations.21-29 To carry out the separation and
preconcentration of ammonia, mixed micelle-mediated extraction (mixed-MME) system was used in this work. MME is becoming an important and practical application of the use of surfactants in analytical chemistry.29 Mixed
surfactants of different charges have been used for extraction and preconcentration in order to accomplish both ideal hydrophobic and non-ideal electrostatic interactions. The use of cationic surfactants in combination with non-ionic surfactants has been documented with an increase in the extraction efficiency of polar organic compounds.29
The purpose of this study is to propose a method for the spectrophotometric determination of ammonia after preconcentration in a simple cloud point extraction (CPE) process. The method is based on the color reaction of ammonia with phenol in the presence of hypochlorite in alkaline media and micelle-mediated extraction of the produced blue dye. A mixture of nonionic surfactant, Triton X-114, and cationic surfactant, cetyltrimethylammonium bromide CTAB, was chosen as the extraction agent without any need to water bath. To the best of our knowledge, this is the first report on the preconcentration of ammonia by CPE method.
Experimental
Reagents
Analytical grade reagents and double distilled water (DDW) were used in all experiments. Stock ammonia solution (1000 mg L-1) was prepared weekly by dissolving
an appropriate amount of anhydrous NH4Cl (Merck) (dried at 100 oC) in DDW. Phenol-sodium nitroprusside solution
was prepared daily by dissolving 2.00 g phenol (Merck)
acid solution (0.25 mol L-1) was prepared by dissolving an
appropriate amount of concentrated acid (Merck) in DDW. Hypochlorite-NaOH solution was prepared by diluting 8 mL of bleach water (Pakshoo) (5% active chlorine) and 12.5 mL of 0.5 mol L-1 NaOH solution to 50 mL with DDW.
CTAB (1% m/v) and Triton X-114 (4% m/v) stock solutions were prepared by dissolving appropriate amounts of the reagents (Sigma-Aldrich) in hot distilled water.
Apparatus
A single beam WPA model Lightwave II UV/Vis spectrophotometer with a 1 cm path length quartz cell (0.50 mL) was used in the absorbance measurements at
λmax. A centrifuge with 10.0 mL calibrated tubes (Superior,
Germany) was used to accelerate the phase separation process in the CPE method.
Procedure
An appropriate amount of the ammonia stock solution to obtain a final concentration in the 2.00-125 ng mL-1
range, and 1.00 mL of the phenol-sodium nitroprusside solution were transferred into a 10.0 mL tube and the mixture was shaken vigorously for 30 s. Then, 1.00 mL of the hypochlorite-NaOH solution was added and the mixture was vigorously shaken for another 30 s. The solution was then diluted to approximately 8.00 mL with DDW and heated for 15 min at 37 oC in a water bath to
complete the color formation reaction. After that, 0.25 mL of 0.25 mol L-1sulfuric acid, 0.75 mL of 4% (m/v) Triton
X-114 and 0.5 mL of 1% (m/v) CTAB solutions were added and the solution was made up to the mark with DDW. Separation of two phases was accelerated by centrifugation for 10 min at 3800 rpm. The mixture was cooled down in a salt bath to increase the viscosity of the surfactant-rich phase. The aqueous phase was easily separated simply by inverting the tube. The surfactant-rich phase was diluted with ethanol to a final volume of 0.50 mL and transferred into a 0.50 mL quartz cell. The sample absorbance at 650 nm was determined against a reagent blank. The blank solution was submitted to the same procedure as the sample. For the blank, the ammonia solution was replaced by DDW.
Results and Discussion
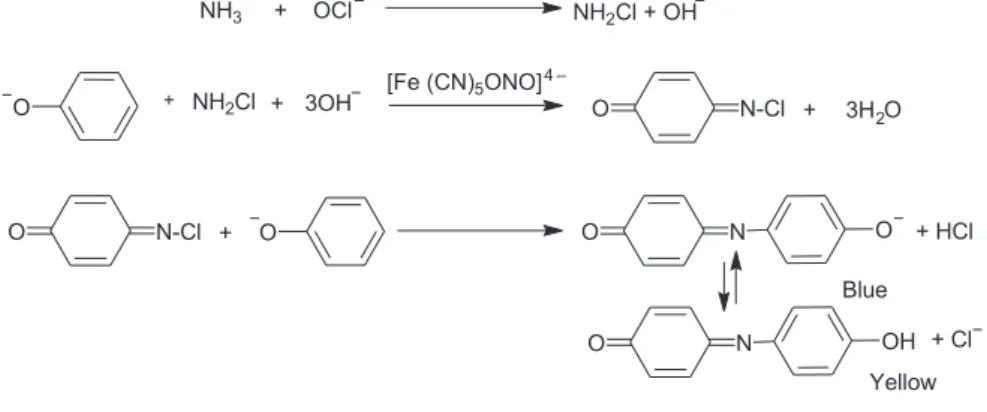
ammonia with phenol produces colored product indophenol dye (Scheme 1).30
Colored product shows an absorption spectrum with maximum absorbance at about 630 nm in aqueous and 650 nm in micellar medium. It was observed that addition of a mixture of the neutral surfactant Triton X-114 and cationic surfactant CTAB, is suitable for separation and preconcentration of produced dye by CPE method.
Optimization of the system
The indophenol formation reaction takes place in alkaline media. The effect of the concentration of NaOH on the indophenol formation was studied. The study was carried out using ammonia solution not submitted to preconcentration. As can be observed in Figure 1, the absorbance of the surfactant rich phase for both sample and blank solution increased by increasing NaOH concentration up to 0.01 mol L-1 and remained nearly constant at higher
concentrations. Therefore, 0.0125 mol L-1 NaOH was
used as the optimal concentration for complete color development.
Although 0.0125 mol L-1 NaOH was the optimum
medium for color development, CPE of indophenol does
not take place in this media. It was found that a less alkaline medium is required for this analyte extraction at room temperature by CPE. Therefore in order to make the extraction of the produced dye possible, sulfuric acid was added to the solution after completion of color development. The effect of the addition of 0.05-0.40 mL of 0.25 mol L-1 sulfuric acid was investigated. The results
showed that addition of acid increased the absorbance of surfactant rich phase up to 0.10 mL, remained nearly constant between 0.10-0.30 mL and decreased at higher concentrations. Therefore, 0.25 mL of 0.25 mol L-1 sulfuric
acid was added in future experiments.
The concentration of surfactant that is used in CPE is an important factor. In CPE, the hydrophobic compounds initially present in the solution bind to the micelles and are extracted into the surfactant-rich phase. Only a small portion of these compounds, below the critical micelle concentration (cmc), remains in the aqueous phase. As the charge of the indophenol is negative, in order to accomplish both ideal hydrophobic and non-ideal electrostatic interactions within the same extraction system, a mixture of a cationic surfactant and a non ionic surfactant should be used for extraction. Preliminary investigations showed that the indophenol dye was completely extracted in a mixture of Triton X-114 and CTAB. To obtain the optimal concentration of Triton X-114, the effect of its concentration on the absorbance of the surfactant rich phase was investigated (Figure 2). As Figure 2 shows, the absorbance of surfactant rich phase for both sample and blank increased by increasing Triton X-114 concentration up to 0.12 and 0.20% (m/v), respectively, and remained constant at higher concentrations. Therefore, 0.3% (m/v) of Triton X-114 concentration was used as the optimal concentration.
The effect of CTAB concentration on the extraction of produced indophenol in the range 0.00-0.125% (m/v) was investigated. The results showed that the absorbance of the surfactant rich phase of the blank and sample increased
Scheme 1.
by increasing CTAB concentration up to 0.04% (m/v) and remained nearly constant at higher concentrations (Figure 3). Therefore, 0.05% (m/v) CTAB was used in the proposed method.
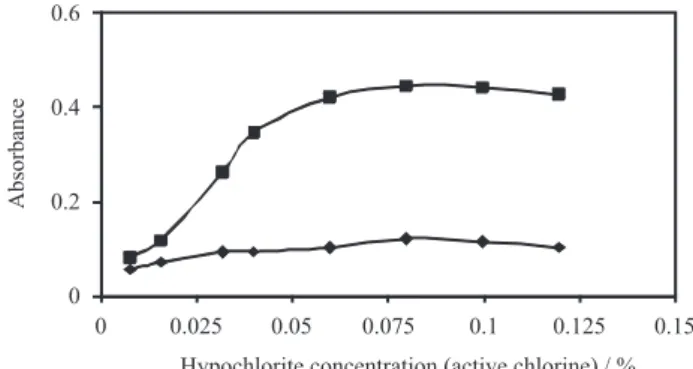
The effect of the hypochlorite concentration on the absorbance of the system was also investigated. The results showed that the absorbance of the solutions increased by increasing the hypochlorite concentration up to 0.06% (m/v) (active chlorine) and then remained nearly constant (Figure 4). Therefore, 0.08% (m/v) (active chlorine) was used in the proposed method.
The effect of the phenol concentration on the absorbance of the system was also investigated. The results (Figure 5) showed that the absorbance of the surfactant rich phase of the blank and sample increased by increasing phenol concentration up to 0.005 and 0.016 mol L-1, respectively,
then remained nearly constant up to 0.026 mol L-1 and
decreased at higher concentrations. Therefore, a 0.021 mol L-1
concentration of the phenol was used for further works. The effect of the concentration of sodium nitroprusside in the range 0.00-5.0 × 10⁻⁵ mol L-1 was also studied. As can
be observed in Figure 6, the absorbance of the surfactant
rich phase for sample and blank increased by increasing sodium nitroprusside concentration up to 1.02 × 10⁻⁵ mol L-1
and remained nearly constant at higher concentrations. Therefore, a 1.7 × 10⁻⁵ mol L-1 sodium nitroprusside
concentration was used as the optimal concentration. As Figures 1-6 show, the absorbances for the blank solutions at 650 nm are significant. Blank signals are
Figure 2. Effect of Triton X-114 concentration on CPE preconcentration performance. () sample and () blank. Conditions: ammonia, 25 ng mL-1; CTAB, 0.05% (m/v); phenol, 0.021 mol L-1; sodium nitroprusside, 3.4 × 10⁻⁵ mol L-1; hypochlorite, 0.08% active chlorine; NaOH, 0.0125 mol L-1; sulfuric acid, 6.25 × 10⁻³ mol L-1.
Figure 3. Effect of surfactant CTAB on CPE preconcentration performance. () sample and () blank. Conditions: ammonia, 25 ng mL-1; Triton X-114, 0.3 % (m/v); phenol, 0.021 mol L-1; sodium nitroprusside 3.4 × 10⁻⁵ mol L-1; hypochlorite, 0.08% active chlorine; NaOH, 0.0125 mol L-1; sulfuric acid, 6.25×10⁻³ mol L-1.
Figure 4. Effect of NaClO on CPE preconcentration performance. () sample and () blank.Conditions: ammonia, 25 ng mL-1; Triton X-114, 0.3% (m/v); CTAB, 0.05% (m/v); phenol, 0.021 mol L-1; sodium nitroprusside, 3.4 × 10⁻⁵ mol L-1; NaOH, 0.0125 mol L-1; sulfuric acid, 6.25 × 10⁻³ mol L-1.
Figure 5. Effect of phenol on CPE preconcentration performance. () sample and () blank.Conditions: ammonia, 25 ng mL-1; Triton X-114, 0.3% (m/v); CTAB, 0.05% (m/v); sodium nitroprusside, 3.4 × 10⁻⁵ mol L-1; hypochlorite, 0.08% active chlorine; NaOH, 0.0125 mol L-1; sulfuric acid, 6.25 × 10⁻³ mol L-1.
caused by a light-induced reaction involving nitroprusside breakdown products that form an indophenol dye with a similar visible spectrum to that formed with ammonia.5
Figures 1-6 also show that an increase in the concentration of NaOH, Triton X-114, CTAB, ClO–, and sodium
nitroprusside caused an increase in the absorbance of the surfactant rich phase. The signal increase is probably due to either a higher yield of the colored product or improvements in the CPE conditions, resulting in a higher extraction efficiency. The signal decrease at phenol concentrations higher than 0.026 mol L-1 is probably due to a competition
between phenol and indophenol molecules interacting with surfactant micelles.
Effect of time on dye formation as well as on the CPE procedure, was investigated. The results showed that the reaction was completed in 15 min at 37 oC.5 A 10 min
centrifugation at 3800 rpm was found to be enough for successful CPE of produced dye.
Because the surfactant-rich phase was viscous, ethanol was added to the surfactant-rich phase after CPE to facilitate its transfer into spectrophotometric cell. The extracted phase was diluted to 0.5 mL with ethanol.
Analytical characteristics
Table 1 summarizes the analytical characteristics of the optimized method, including equation for the calibration curve, linear dynamic range, limit of detection, reproducibility, preconcentration and enrichment factors. The limit of detection, defined as CL = 3 Sb/m (where CL, Sb, and m are the limit of detection, standard deviation of the blank, and slope of the calibration curve, respectively), was1.00 ng mL-1. Because the amount of ammonia in 10 mL
of sample solution is measured after preconcentration by CPE in a final volume of 0.5 mL the solution is concentrated by a factor of 20. The enrichment factor, defined as the ratio of the slope of the calibration curve for the CPE method to that of the calibration curve without preconcentration, was 28. The relative standard deviation (RSD) for five replicate measurements of 25 ng mL-1 ammonia was 2.78%.
Effect of foreign ions
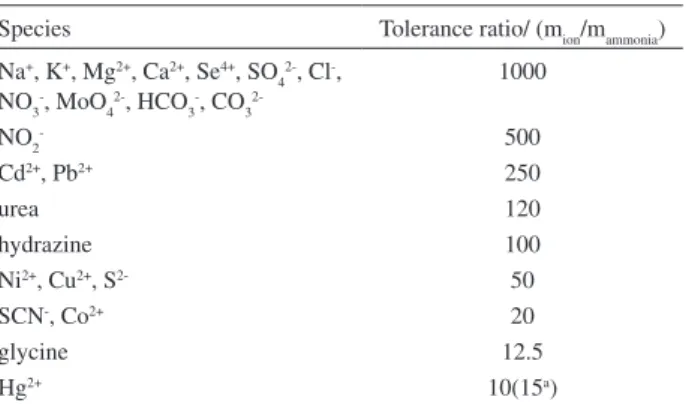
To study the common ion effector selectivity of the proposed method, the effect of various species (anions, cations and neutral species) on the determination of 50 ng mL-1 ammonia was tested under the optimum conditions.
The tolerance limit was defined as the concentration of added species caused less than ± 5% relative error on the determination of ammonia. It was found that most of the investigated species did not interfere even when present 1000-fold excess over ammonia (Table2). The interfering effect of Hg2+ up to15 fold excess over ammonia was completely
removed in the presence of 2.5 × 10⁻⁶ mol L-1 EDTA.
Application
In order to test the reliability of the proposed method, it was applied to the determination of ammonium in well and river water samples. Spiking of ammonium to the samples showed the validity of the method. The results are presented in Table 3. The amount of ammonium was also determined
Table 1. Analytical features of the proposed method
Equation for the calibration curve (n =10 )
∆A =0.0126CNH3 + 0.0565, R = 0.9981
Linear dynamic range/ (ng mL-1) 2.00-125
Limit of detection/ (ng mL-1) 1.00 (3σ blank) (n = 5)
Repeatability (RSD, %) (n = 5) 2.78 (for 25 ng mL-1 ammonia)
Maximum preconcentration factor 20
Enrichment factor 28
Table 2. Tolerance ratio of diverse ions on the determination of 50 ng mL-1 ammonia
Species Tolerance ratio/ (mion/mammonia)
Na+, K+, Mg2+, Ca2+, Se4+, SO 4
2-, Cl-, NO3-, MoO
4 2-, HCO
3 -, CO
3
2-1000
NO2- 500
Cd2+, Pb2+ 250
urea 120
hydrazine 100
Ni2+, Cu2+, S2- 50
SCN-, Co2+ 20
glycine 12.5
Hg2+ 10(15a)
a After removal as described in the text.
Table 3. Determination of ammonium in natural water and wastewater samples by the proposed method
Sample
Ammonium/(ng mL-1)
Recovery/(%) (n = 3) Added Found Proposed method Standard method30
Well water 0.00 NDa ND —
26.47 25.83 — 97.6 ± 3.0
42.35 42.88 — 101.3 ± 2.2
River water (Saleh-Abad, Hamadan)
0.00 36.70 39.00 —
26.47 43.73 94.0 ± 2.3
42.35 60.23 97.47 ± 3.8
Solid-phase extraction (SPE) 25-500 10 1
SPE/diffuse reflectance spectroscopy 25-250 11 3,11
Capillary electrophoresis/single-drop microextraction 90-1800 27 17
In line concentration — 1.0 32
Gas-diffusion, derivatisation and fluorescent detection 0-72 0.126 33
Gas diffusion — 0.8 34
Cloud-point extraction 2.00-125 1.00 Proposed method
by a standard method too.31 The result is in good agreement
with that obtained by standard method. The recoveries are in the range 94-102% and indicate that the proposed method is useful for the determination of ammonium in the natural waters and waste water samples.
Comparison of the proposed method with other methods
A comparison of the proposed method with the previously reported methods for preconcentration and spectrophotometric determination of ammonia (Table 4) indicates that the proposed method is faster and simpler than the existing methods and/or it provides a lower limit of detection.
Conclusion
The new proposed procedure gives a highly selective, very sensitive, and low-cost spectrophotometric procedure for determination of ammonia that can be applied to real samples. The mixture of surfactants has been used for preconcentration of ammonia in water, and thus toxic solvent extraction has been avoided.
Acknowledgments
The authors acknowledge to Bu-Ali Sina University Research Council and Center of Excellence in Development of Chemical Methods (CEDCM) for support of this work.
References
1. Legua, C. M.; Lloret, S. M.; Martinez, Y. M.; Falco, P. C.;
Trace-Trend Anal. Chem.2006, 25, 282.
2. Lau, K. T.; Edwards, S.; Diamond, D.; Sensor. Actuators B
2004, 98, 12.
3. Martínez, Y. M.; Falcó, P. C.; Hernández, R. H.; Talanta2006,
69, 1038.
4. Park, J. S.; Park, K. B.; Shin, K. S.; Park, H. D.; Kim, M. C.; Kim, J. R.; Park, S. J.; Song, Y. H.; Sensor. Actuators 2006,
117, 516.
5. Searle, P. L.; Analyst1984, 109, 549.
6. Clark, D. R.; Fileman, T. W.; Joint, I.; Mar. Chem.2006, 98, 121.
7. Wang, L.; Cardwell, T. J.; Cattrall, R. W.; de Castro, M. D. L.; Kolev, S. D.; Talanta2003, 60, 1269.
8. Bolleter, W. T.; Bushman, C. J.; Tidwell, P. W.; Anal. Chem.
1961, 33, 592.
9. Lee, W.; Westerhoff, P.; Yang, X.; Shang, C.; Water Res.2007,
41, 3097.
10. Pai, S. C.; Tsau, Y. J.; Yang, T.; Anal. Chim. Acta2001, 434, 209.
11. Martínez, Y. M.; Hernández, R. H.; Falcó, P. C.; Anal. Chim. Acta 2005, 534, 327.
12. Valentini, F.; Biagiotti, V.; Lete, C.; Palleschi, G.; Wang, J.;
Sensor. Actuators B2007, 128, 326.
13. Giovanelli, D.; Buzzeo, M. C.; Lawrence, N. S.; Hardacre, C.; Seddon, K. R.; Compton, R. G.; Talanta 2004, 62, 904. 14. Verma, P.; Rastogi, R. K.; Ramakumar, K. L.; Anal. Chim. Acta
2007, 596, 281.
15. Kuo, C. T.; Wang, P. Y.; Wu, C. H.; J. Chromatogr. A2005,
1085, 91.
16. Masserin, Jr, R. T.; Fanning, K. A.; Mar. Chem. 2000, 68, 323.
17. Pranaitytė, B.; Jermak, S.; Naujalis, E.; Padarauskas, A.;
Microchem. J. 2007, 86, 48.
18. Hata N.; Kasahara, I.; Taguchi, S.; Anal. Sci.2002, 18, 697. 19. Maris, C.; Laplanche, A.; Morvan, J.; Bloquel, M.;
J. Chromatogr. A1999, 846, 331.
20. Moreno, P.; Sanchez, E.; Pons, A.; Palou, A.; Anal. Chem. 1986, 58, 585.
21. Afkhami, A.; Zarei, A. R;. Talanta2004, 62, 559.
22. Madrakian, T.; Afkhami, A.; Mousavi, A.; Talanta2007, 71, 610.
23. Afkhami, A.; Madrakian, T.; Bozorgzadeh, E.; Bahram, M.;
24. Afkhami, A.; Madrakian, T.; Siampour, H.; J. Hazard. Mater. B2006, 138, 269.
25. Afkhami, A.; Madrakian, T.; Maleki, A.; Anal. Biochem. 2005,
347, 162.
26. Zarei, A. R; Anal. Biochem.2007, 369, 161.
27. Afkhami, A.; Bahram, M.; Gholami, S.; Zand, Z.; Anal. Biochem. 2005, 336, 295.
28. Pourreza, N.; Elhami, S.; Anal. Chim. Acta2007, 596, 62. 29. Delgado, B.; Pino, V.; Ayala, J. H.; González, V.; Afonso, A.
M.; Anal. Chim. Acta2004, 518, 165.
30. Harfmann, R.G.; Crouch S. R.; Talanta1989, 36,261.
31. Standard Methods for Examination of Water and Wastewater, 14th ed., American Public Health Association, Washington DC,
1975, p. 417.
32. Rocha, F R. P.; Martelli, P. B.; Reis B. F.; J. Braz. Chem. Soc.
2004, 15, 38.
33. Watson, R. J.; Butler, E. C. V.; Clementson, L. A.; Berry K. M.;
J. Environ. Monit. 2005, 7, 37.
34. Fan, S.; Müller, H.; Schweizer, B.; Böhme W.; Fresenius J. Anal. Chem.1993, 347, 103.
Received: March 24, 2008