Artigo
*e-mail: [email protected]
APPLICATION OF CLOUD POINT PRECONCENTRATION AND FLAME ATOMIC ABSORPTION
SPECTROMETRY FOR THE DETERMINATION OF CADMIUM AND ZINC IONS IN URINE, BLOOD SERUM AND WATER SAMPLES
Ardeshir Shokrollahi* and Somayeh Joybar
Department of Chemistry, Yasouj University 75918-74831, Yasouj, Iran Hoda Elias Haghighi
Chemistry Department, Islamic Azad University of Firouzabad, Firouzabad 74715-117, Iran Khodabakhsh Niknam and Ebrahim Niknam
Chemistry Department, Persian Gulf University, Bushehr, Iran
Recebido em 27/3/12; aceito em 20/10/12; publicado na web em 21/2/13
A simple, sensitive and selective cloud point extraction procedure is described for the preconcentration and atomic absorption spectrometric determination of Zn2+ and Cd2+ ions in water and biological samples, after complexation with 3,3’,3”,3’”-tetraindolyl (terephthaloyl) dimethane (TTDM) in basic medium, using Triton X-114 as nonionic surfactant. Detection limits of 3.0 and 2.0 µg L-1 and quantification limits 10.0 and 7.0 µg L-1were obtained for Zn2+ and Cd2+ ions, respectively. Relative standard deviation was 2.9 and 3.3, and enrichment factors 23.9 and 25.6, for Zn2+ and Cd2+ ions, respectively. The method enabled determination of low levels of Zn2+ and Cd2+ ions in urine, blood serum and water samples.
Keywords: Zn2+ and Cd2+ ions; TTDM; flame atomic absorption.
INTRODUCTION
Zinc is one of the least common elements and has been estimated to make up 0.0005-0.02% of the earth’s crust. It is an essential element in the growth of many kinds of organisms, both plants and animals. Zinc is present in all body tissues and fluids1 and is an essential
component of a large number (>300) of enzymes participating in the synthesis and degradation of carbohydrates, lipids, proteins, and nucleic acids, as well as in the metabolism of other micronutrients. This metal is a cofactor of several enzyme systems and constitutes the active center of carbonic anhydrase. The insulin compound is a zinc-containing protein while zinc is also present in most foods, par-ticularly those high in protein.2 Zinc stabilizes the molecular structure
of cellular components and membranes and in this way contributes to the maintenance of cell and organ integrity. Furthermore, zinc plays an essential role in polynucleotide transcription and thus in the process of genetic expression. Its involvement in such fundamental activities probably accounts for the essential nature of zinc for all life forms. Moreover, zinc plays a central role in the immune sys-tem, affecting a number of cellular and humeral immunity aspects.3
Zinc deficiency in the human diet has been found to retard growth and maturity and also to cause anemia. On the other hand, zinc is a man-made environmental pollutant. The concentration of zinc in unpolluted natural water is low.
The main uses of cadmium include nickel-cadmium batteries, invented by Thomas A. Edson in the early part of the 20th century,
and in cadmium coatings for the anti-corrosion protection of steel.4
Our environment contains countless sources of cadmium and in the modern world this element is ubiquitous in food, water and air. The greatest human cadmium exposure comes from tobacco smoke and food consumption, most of which arises from the uptake of cadmium by plants from fertilizers, sewage sludge, manure and atmospheric deposition.5 Cadmium is not only regarded as essential to human life,
but is now known to be extremely toxic6,7 and accumulates in humans
mainly in the kidneys.4 Prolonged intake, even of tiny amounts, leads
to severe dysfunction of the kidneys. Cadmium is widely found in society, either in useful products or in controlled wastes.
The sensitivity of analytical techniques is often insufficient for its determination. Several methods have been developed to separate and determine Zn2+ or Cd2+ ions. Traditionally, organic solvents8-12
have been used to extract Zn2+ or Cd2+ ions. However, these solvents
are often classified as having carcinogenic toxicity and being en-vironmental pollutants. In general, colorimetry is the conventional method commonly used in many fields. Nevertheless, almost none of the color reagents are specific for determining zinc or cadmium in complex matrices although their determination has been deve-loped.13-16 In addition, although some of these methods13,15 number
among the most accurate, they pose some associated risks for both the analysts and the environment. Therefore, the determination of zinc or cadmium concentration in environmental and biological settings by atomic absorption spectroscopy (AAS) represents an effective method. Nevertheless, this method requires a relatively large amount of sample in comparison with coupled techniques with AAS.
Aqueous solutions of many non-ionic surfactant micellar systems become turbid over a narrow temperature range, when the experimen-tal conditions (i.e., temperature or pressure, addition of salt or other additives, etc.) are changed. This temperature is called the cloud point temperature. Above the cloud point, the aqueous surfactant micellar solution separates into a concentrated phase containing most of the surfactant (termed surfactant-rich phase) and a dilute aqueous phase containing low concentration of surfactant corresponding to critical micellar concentration (cmc). Any components originally present that bind to the micellar aggregate in solution can thus be extracted from the original solution and concentrated in the small volume element of the surfactant-rich phase (usually less than 0.5 mL).
in trace analysis of organic18-21 and inorganic materials.22-32 However, despite the critical importance of Zn2+ and Cd2+ moni-toring in many industrial, environmental, clinical and pharmaceutical samples, only a few cases of the use of CPE for the separation and pre-concentration of Zn2+ and Cd2+ have been reported in the literature.33-36 In this work, a cloud-point preconcentration procedure was in-troduced for determination of Zn2+ and Cd2+ ions, after the formation of complex with 3,3’,3”,3’”-tetraindolyl (terephthaloyl) dimethane (TTDM). The lipophilic TTDM-Zn2+ and Cd2+ complexes, comple-tely extracted from aqueous solution to the concentrated micellar medium, and the analytes were ultimately analyzed by flame atomic absorption spectrometry.
EXPERIMENTAL
Reagents
All solutions were prepared with deionized water. Analytical-grade methanol, acids, and other chemicals used in this study were obtained from Merck. A 1.0% (w/v) Triton X-114 from E. Merck (Darmstadt, Germany) was prepared by dissolving 1.0 g of Triton X-114 in a 100 mL volumetric flask with stirring. All chemicals such as nitrate of Zn(II) and Cd(II) and other cations were of analytical grade purchased from Merck. The 3,3’,3”,3’”-tetraindolyl (terephtha-loyl) dimethane (TTDM) was synthesized, purified and characterized according to the literature.37,38
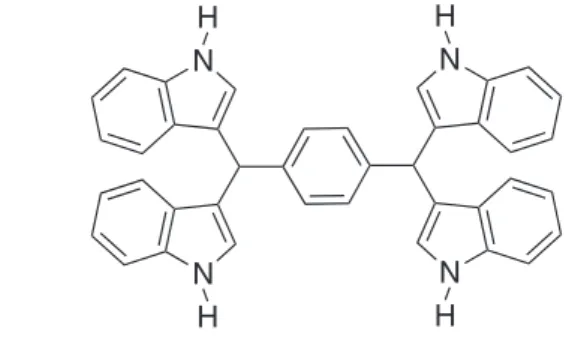
Synthesis of TTDM
To synthesize TTDM (Figure 1), a mixture of indole (4 mmol, 0.468 g), terephthaldehyde (1 mmol, 0.134 g), and Al(HSO4)3 (2
mmol, 0.636 g) in dimethyl sulfoxide (5 mL) was heated in an oil bath at 120 °C. The reaction mixture was filtered after 1 h. The residue was
washed with ethanol (2 × 4 mL). water (40 mL) was then added to the filtrate, and the precipitate filtered. The product was purified by column chromatography on silica gel, using eluent: ethyl acetate/ n--hexane (10:90)] to give pure tetra(indolyl)methane 0.492 g, 87% yield. Purification and characterization was achieved according to our previous report. 38
Instrumentation
A Perkin-Elmer model 97 AAnalyst 300 (Shelton, CT, USA) atomic absorption spectrometer equipped with deuterium background correction, Zn and Cd hollow-cathode lamps as the radiation source, was used for absorbance measurements at wavelengths of 213.9 and 228.8 nm, respectively. The instrumental parameters were adjusted according to the manufacturer’s recommendations. A UV-Vis spec-trophotometer Jasco model V-570 (Japan) was used for spectropho-tometric titrations. An A30 E 148 centrifuge was used to accelerate the phase separation process. A Metrohm 744 pH meter, furnished
with a combined glass-saturated calomel electrode, was used for pH measurements.
Spectrophotometric titrations
Standard stock solutions of TTDM (10−3 M) and the metal ions
(3.0 × 10⁻³ M) were prepared by dissolving appropriate and exactly
weighed (accuracy of ± 0.0001 g) amounts of pure solid compounds in pre-calibrated 25.0 mL volumetric flasks, and diluting to the mark with MeOH. Working solutions were prepared by appropriate dilution of the stock solutions. Titration of 2.6 mL of TTDM 2.3 × 10⁻⁴ M
solution was carried out by the addition of micro-liter amounts of a concentrated standard solution of the metal ion (1.0-2.5 × 10⁻³ M)
using a pre-calibrated micro-syringe, at 25.0 °C, with the spectrum
subsequently recorded. General procedure
A typical cloud point experiment required the following steps: an aliquot of 15 mL of a solution containing 66.7 µg L-1 Zn2+ and 133.3
µg L-1 Cd2+ ions, 0.08% (w/v) Triton X-114 and TTDM (0.08 mM)
was adjusted to pH 10 by adding NaOH. The mixture was shaken for 1 min and left to stand in a thermostated bath at 65 °C, for 25 min.
Separation of the phases was achieved by centrifugation at 3500 rpm for 15 min. The whole system was cooled in an ice bath for 5 min to allow the surfactant rich phase to regain its viscosity. In this way, the bulk aqueous phase was easily decanted. The remaining micellar phase was dissolved to 0.5 mL in 1.0 M HNO3 in methanol and the
Zn2+ and Cd2+ ions content was readily evaluated by flame atomic
absorption spectroscopy (FAAS). Application of real samples
Water samples
Analysis of water samples for determination of analyte contents was performed as follows: about 500 mL of sample was passed through a sintered glass funnel and 1 mL of concentrated HNO3 was added to
eliminate and decompose micro-organisms and acidify the medium. The water samples were stored in polyethylene bottles. The procedure given in the general procedure section was then applied for analysis. Blood serum samples
A 5-mL portion of the clear supernatant serum obtained from 2 samples from males or females aged 28 and 32 years was pipetted off and treated with 5.0 mL of 1.2 M trichloroacetic acid. The mixture was centrifuged at 3000 rpm, the deproteinized supernatant placed in a 50-mL beaker, and the resulting solution neutralized with 2.0 M NaOH until a pH value of ca10 was reached.23 Aliquots (7-mL) of
the samples were then analyzed by the proposed method. Urine samples
A 10 mL portion of a urine sample (or a spiked urine sample) was treated with 10 mL of concentrated HNO3 (63%) and an HClO4
(70%) mixture of 2:1 in a 50 mL beaker covered with a watch glass. The content of the beaker was heated on a hot plate (100 °C 15 min,
150 °C 10 min). The watch glass was removed and the acid evaporated
to dryness at 150 °C. HClO
4 (3 mL) was added to the resulting white
residue and the mixture was heated at 160 °C to dryness. All heating
was carried out under a hood while taking the necessary precautions. Five milliliters of 1 M H2SO4 was added, the mixture heated at 150
°C
for 1 min, and the volume made up to the mark in a 50 mL volumetric flask. Aliquots (7 mL) of the resulting clear solution were analyzed according to the described procedure.39
RESULTS AND DISCUSSION
The aim of this work was to develop a simple, sensitive and available method for the preconcentration and determination of trace amounts of Zn2+ and Cd2+ ions in various real samples using flame atomic absorption spectrometry coupled with CPE. In this regard, the influence of various effective parameters including, pH, surfactant and TTDM concentrations, heating time and temperature, centrifuge time and rate, as well as the effect of electrolyte on absorbance, were optimized.
The complexation study yields important information about the interaction between the ligand and metal ions. Recently, we have used the spectrophotometric method for this purpose25 before using TTDM for the CPE of the metal ions.
Spectrophotometric investigation
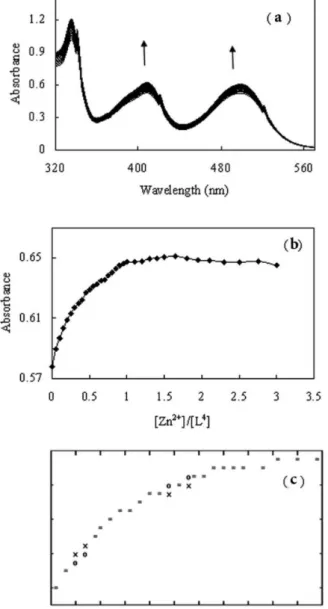
The spectra of TTDM with the addition of Zn2+ or Cd2+ ions, cor-responding mole ratio plot and curve fitting at wavelengths of 498 or 495 nm, are depicted in Figures 2 and 3, respectively. Complexation occurs through binding of Zn2+ or Cd2+ ions to nitrogen atoms, leading
to the ML, or ML, ML2 models. Formation constants and
stoichio-metries of complexes were calculated using the Kinfit program25,40-43
and results are shown in Table 1.
Effect of pH
The formation of the metal–chelate and its chemical stability are two important factors influencing CPE. The pH plays a unique role in metal–chelate formation and subsequent extraction, proving to be the main parameter for CPE. Extraction yield depends on the pH at which complex formation is carried out. Thus, a set of similar experiments in the pH range 2.0-11.0 was conducted according to
Table 1. Stepwise stability constants of complexation between metal ions and TTDM in MeOH
Metal ion Log K1 Log K2 M/L
Zn2+ 4.450 ± 0.340 ---- 1:1
Cd2+ 5.720 ± 0.230 1.245 ± 0.379 1:1, 1:2
Figure 2. UV-Visible spectra of titration of TTDM (2.3 × 10⁻⁴ M) with Zn2+ (3.0 × 10⁻³ M) in MeOH (T = 25 °C and I = 0.05 M) (a) molar ratio plot at 498 nm (b) and corresponding curve fitting (c)
the described procedure described in the Experimental section with respective results illustrated in Figure 4. The maximum sensitivity by CPE was obtained at pH 10. In more acidic solutions, deterioration of the signal occurs due to protonation of TTDM, while at pH > 10, the signal decreases and recovery is reduced due to precipitation of Zn2+ and Cd2+ ions in the form of hydroxides or ternary complexes. Consequently, pH = 10 was selected for the subsequent studies.
Effect of TTDM concentration
The absorbance of extracted metal ions as a function of the con-centration of TTDM is shown in Figure 5. As can be seen, increasing TTDM concentration up to a 0.08 mM causes increasing absorbance. Thus, a TTDM concentration of 0.08 mM was chosen to optimize other variables. At lower than 0.08 mM of TTDM, insufficient con-centration leads to incomplete complexation. A possible explanation for the decrease in absorption with higher concentrations may be attributed to the formation of charged complexes with excess TTDM in the medium or with remaining excess TTDM in aqueous solution, competing with surfactant-rich phase for formation of complex with metal ions in aqueous phase.
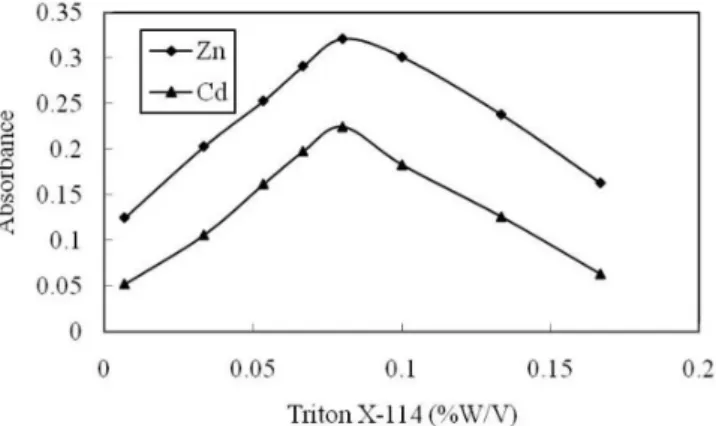
Effect of Triton X-114 concentration
The type and concentration of surfactant are important factors in cloud point extraction. Triton X-114 was chosen as a suitable surfactant due to its physicochemical characteristics, low cloud point temperature, commercial availability, relatively low price, low toxicity, high density in the surfactant-rich phase and becau-se it facilitates phabecau-se becau-separation. The variation in absorbance of
extracted Zn2+ and Cd2+ ions within the Triton X-114 concentration
range of 6.6 10-3- 0.16% (w/v) was examined and results shown in
Figure 6. The results show that quantitative extraction was obtained with an optimum Triton X-114 concentration of 0.08% (w/v), at which the highest absorbance for extracted Zn2+ and Cd2+ ions was
obtained. For concentrations lower than 0.08 % (w/v), the precon-centration efficiency of the formed complexes was very low, since the assemblies at low concentration were probably inadequate to preconcentrate trace amounts of Zn2+ and Cd2+ ions. The decreasing
of absorbance at a concentration higher than 0.08% (w/v) is due to the remaining of some part of Triton X-114 and TTDM in aqueous solution as this phase can compete with surfactant-rich phase to draw analyte ions.
Effect of ionic strength
It is known that ionic strength of the solution is one of the effective factors in cloud point extraction. In this work, the effect of KNO3
salt as an electrolyte in the range 0.01-0.5 mol L−1 on the process
was investigated. It is observed that increasing concentration of salt to 0.1 M exerts no effect on the process, but higher concentrations caused a decrease in absorbance of extracted surfactant-rich phase. This effect might be explained by the additional surface charge when the salt concentration is very high.
Effect of temperature and equilibrium time on CPE
It was desirable to employ the shortest equilibration time and the lowest possible equilibration temperature as a compromise between completion of extraction and separation of phases. The dependence of extraction efficiency upon equilibration temperature and time above the cloud point in the range 30-70 °C and 5-30 min were thoroughly
optimized, respectively. Holding the sample solutions for 25 min at 65 °C was found to be satisfactory to achieve a small volume of
the surfactant-rich phase, quantitative extraction and experimental convenience.
Effect of centrifuge time and rate
Preconcentrating trace amounts of Zn2+ and Cd2+ ions with great
efficiency in a short time is required. Therefore, CPE on a set of experiments using 15 mL samples under optimum conditions by heating to 65 °C and centrifuging at various rates and times and
subsequent cooling in 5 min was carried out. Centrifugation at 3500 rpm for 15 min separated the two phases completely. The enrichment phase did not separate completely at lower rates and centrifugation times.
Figure 4. Effect of pH of test solution on CPE of Zn2+ and Cd2+ ions. Condi-tions: Zn2+, 0.066 µg mL-1; Cd2+, 0.133 µg mL-1; TTDM, 0.08 mM; Triton X-114, 0.08%
Figure 5. Effect of TTDM concentration on CPE of Zn2+ and Cd2+ ions. Conditions: Zn2+, 0.066 M; Cd2+, 0.133 M; Triton X-114, 0.08%; pH, 10.0
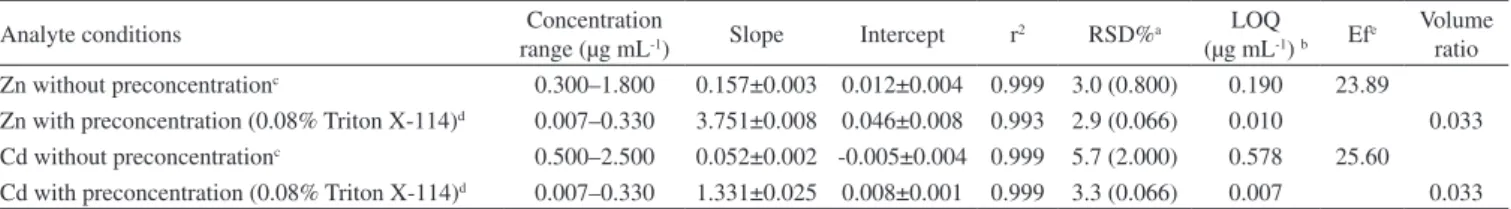
Calibration, precision and detection limits
Calibration graphs were obtained by preconcentration of 15 mL of several solutions under optimum conditions, containing various concentrations of each analyte, with the process performed according to the General procedure section where the absorbance of the final solution was measured by FAAS. A linear relationship between the measured absorbance and concentration of Zn2+ or Cd2+ ions in the
range 0.007-0.330 µg mL-1 was obtained. Table 2 shows the calibration
parameters for the proposed CPE method including the linear ranges, the relative standard deviation obtained for two analyte samples subjected to the complete procedure, volume ratio and the limit of detection. Also, a calibration graph was obtained without preconcen-tration in order to calculate the enrichment factor. The enrichment factor was calculated as the ratio of the slopes of the calibration curve with and without preconcentration, and factors obtained for Zn2+ and
Cd2+ ionswere 23.89 and 25.60, respectively.
Interference study
With a view to obtaining high selectivity by the FAAS method, the interferences were studied. These interferences constitute spe-cial ions which are related to the preconcentration step, i.e. those that may react with TTDM and decrease the preconcentration and
Table 2. Analytical characteristics of the method
Analyte conditions Concentration
range (µg mL-1) Slope Intercept r
2 RSD%a LOQ (µg mL-1) b Ef
e Volume ratio Zn without preconcentrationc 0.300–1.800 0.157±0.003 0.012±0.004 0.999 3.0 (0.800) 0.190 23.89 Zn with preconcentration (0.08% Triton X-114)d 0.007–0.330 3.751±0.008 0.046±0.008 0.993 2.9 (0.066) 0.010 0.033 Cd without preconcentrationc 0.500–2.500 0.052±0.002 -0.005±0.004 0.999 5.7 (2.000) 0.578 25.60 Cd with preconcentration (0.08% Triton X-114)d 0.007–0.330 1.331±0.025 0.008±0.001 0.999 3.3 (0.066) 0.007 0.033 aValues in parentheses are the Zn2+ and Cd2+ ions concentrations (µg mL-1) for which the RSD was obtained. bLimit of quantification, calculated as ten times the standard deviation of the blank signal. cStandard solutions of Zn2+ and Cd2+ ions in 0.1 mol L−1 HNO
3 medium.
dDilution of the surfactant-rich phase to 500 µl of 0.1 mol L−1 HNO
3 in MeOH.
e Ef is the enrichment factor.
Table 3. Effects of the interferences ions on the recovery of the analyte
Analyte Ion
Interference/ analyte ratio
(µg L-1)
Recovery (%)
Zn2+
Li+, Na+, K+, NO 3
–, Cl -Mg2+, Ca2+, Ba2+
Cr3+ Ni2+, Pb2+, Co2+ Cu2+,Mn2+,Cd2+
Fe3+,Al3+ SO4 2-ClO 4− 1000 1000 1000 1000 500 500 1000 1000 102.3 102.0 101.2 100.0 99.8 99.5 99.7 96.4 Cd2+
Li+, Na+, K+, NO 3
–, Cl -Mg2+, Ca2+, Ba2+
Cr3+ Ni2+, Pb2+, Co2+ Cu2+,Mn2+,Cd2+
Fe3+,Al3+ SO4 2-ClO4 − 1000 1000 1000 1000 500 500 1000 1000 101.1 100.5 96.1 97.7 99.8 96.4 95.8 99.0
Table 4. Characteristics of the standard addition curves for determination of Zn2+ and Cd2+ ions in water samples
Analyte Sample Slope Intercept r2 Added (µg mL-1) Found (µg mL-1) Recovery%
Zn2+
Well water (Firooz abad city) 3.792±0.121 0.103±0.006 0.995
--- 0.409±0.032
---0.100 0.512±0.071 103
0.200 0.609±0.083 100
Spring water (Firooz abad city) 3.747±0.150 0.066±0.007 0.999
--- 0.133±0.015
---0.100 0.228±0.042 95
0.200 0.327±0.069 97
Sepidan mineral drinking water 3.798±0.090 0.070±0.006 0.999
--- 0.045±0.004
---0.100 0.144±0.016 99
0.200 0.247±0.027 101
Tap water (Firooz abad city) 3.576±0.173 0.109±0.006 0.995
--- 0.459±0.045
---0.100 0.557±0.072 98
0.200 0.651±0.085 96
Cd2+
Well water (Firooz abad city) 1.581±0.030 0.004±0.001 0.999
--- nd
---0.100 0.101±0.013 101
0.200 0.194±0.021 97
Spring water (Firooz abad city) 1.509±0.050 0.008±0.001 0.997
--- 0.013±0.002
---0.100 0.117±0.006 104
0.200 0.213±0.011 100
Sepidan Mineral drinking water 1.557±0.047 0.003±0.001 0.997
--- nd
---0.100 0.098±0.008 98
0.200 0.204±0.028 102
Tap water (Firooz abad city) 1.566±0.032 0.008±0.003 0.994
--- nd
---0.100 0.099±0.010 99
0.200 0.194±0.023 97
extraction efficiency (Table 3). The study of possible interferences was conducted for Li+ , K+ , Na+, Ni2+, Pb2+, Co2+, Ba2+, Ca2+, Mg2+, Cu2+,
Mn2+, Fe3+,Cr3+, Al3+ , NO 3
–, SO 4
2-, ClO 4
−, Cl- and Cd2+ or Zn2+ ions
Table 5. Characteristics of the standard addition curves in blood serum and urine for Zn2+ and Cd2+ ions
Analyte Sample Sex Slope Intercept r2 Added (µg mL-1) Found (µg mL-1) Recovery%
Zn2+
blood serum Male 4.047±0.011 0.138±0.005 0.999
--- 0.730±0.026
---0.100 0.830±0.059 100
0.200 0.924±0.078 97
blood serum Female 3.864±0.023 0.199±0.008 0.999
--- 1.100±0.036
---0.100 1.202±0.065 102
0.200 1.298±0.082 99
urine Female 3.639±0.218 0.131±0.014 0.996
--- 1.350±0.081
---0.100 1.446±0.084 96
0.200 1.552±0.091 101
Cd2+
blood serum Male 1.572±0.074 0.008±0.002 0.998
--- nd
---0.100 0.102±0.009 102
0.200 0.200±0.021 100
blood serum Female 1.491±0.099 0.002±0.001 0.999
--- nd
---0.100 0.103±0.010 103
0.200 0.198±0.018 99
urine Female 1.611±0.062 0.009±0.003 0.999
--- nd
---0.100 0.097±0.016 97
0.200 0.206±0.024 103
Table 6. Comparing of the present work with various CPE reported method for determination of Zn2+ and Cd+ ions
Ions Detection system
Reagent Surfactant Matrix Linear range (ng·mL–1)
DL (ng·mL–1)
Sample volume (mL)
Enrichment factor (Ef)
Ref.
Zn(II) CPE-FAAS 2-Guandino-benzimidazole
Triton X-114 water 8.8-80 8.8 50 13 1
Cd(II) CPE-FAAS N,N’-bis[(1R )-ethyl-2- hydroxyethyl]
ethanediamide
Triton X-114 water 2.5-25 0.5 40 23 8
Cd(II) CPE-FAAS N,N’-bis[(1S )-1-benzyl- 2-hydroxyethyl]
ethanediamide
Triton X-114 water 2.5-25 0.25 40 22 8
Cd(II) CPE-FAAS 1, 5-bis(di-2- pyridylmethylene) thiocarbonohydrazide
Triton X-114 water, food and environmental
samples
10-200 0.95 10 10.5 7
Cd(II) CPE-FAAS bis((1H-benzo [d] imidazol-2yl)ethyl)
sulfane
Triton X-114 radiology waste, vegetable, blood and urine
- 1.4 15 48 13
Zn(II) Cd(II)
ICP-OES 4-(2-pyridylazo)-resorcinol
Triton X-114 water 10-700 20-2000
1.1 1.0
15
-43
Zn(II) Cd(II)
GFAAS (CVAAS for
Hg)
HCPTS Triton X-114 Water, blood and urine
0.07-200 0.02-200
0.0514 0.052
50 41
46
44
Zn(II) Cd(II)
CPE-FAAS 3,3’,3”,3’”-tetraindolyl (terethalyl) Di methane
(TTDM)
Triton X-114 urine, blood serum and water samples
7-330 3.0
2.0
15 23.89
25.60
This work or 133.3 µg L-1 of Zn2+ or Cd2+, respectively). There was no significant
interference at a 1:1000 ratio of Zn2+ or Cd2+ with Li+, K+, Na+, Ni2+,
Pb2+, Co2+, Ba2+, Ca2+, Mg2+, Cr3+ , NO 3
–, ClO 4
−, Cl- and SO 4
2- ions,
and also for the same condition at a ratio of 1:500 Zn2+ or Cd2+ with
Cu2+, Mn2+, Fe3+, Al3+ , and Cd2+ or Zn2+ ions.
Real samples – evaluation of method
The proposed method was applied for the determination of Zn2+
and Cd2+ ions by the standard addition technique in two blood serum,
one urine and four different water samples including well water, spring water, tap water and mineral drinking water (Table 4). The results of two blood serum samples as mentioned in the Experimental section are summarized in Table 5. Notably, the determination of Zn2+
and Cd2+ in the blood serum samples is remarkably accurate by the
proposed method. The resultsof the determination of Zn2+ and Cd2+
in thefresh urine sample as mentioned in the Experimental section are listed in Table 5.
CONCLUSION
The proposed cloud point extraction procedure using TTDM as a stable and fairly selective complexing agent offers a simple, rapid, inexpensive and environmentally benign method to preconcentrate and separate Zn2+ and Cd2+ in aqueous solutions. This method has a
very low limit of detection (LOQ), good relative standard deviation (RSD) and was applied to determine trace amounts of Zn2+ and
Cd2+ ions in various real samples. In a full comparison of the results
presented in this paper with those using similar methods reported in literature1,7,8,13,43,44 (Table 6) revealed that, on key measurements,
REFERENCES
1. Dallali, N.; Zahedi, M. M.; Yamini, Y.; Scientia Iranica2007, 14, 291. 2. Kolachi, N. F.; Kazi, T. G.; Khan, S.; Wadhwa, S. K.; Baig, J. A.; Afridi,
H .I.; Shah, A. Q.; Shah, F.;Food Chem. Toxicol.2011, 49,2548. 3. Shankar, A. H.; Prasad, A. S.; A.J.C.N1998, 68, 447.
4. Greenwood, N. N.; Earnshaw, A.; Chemistry of the Elements, Pergamon Press, Oxford, 1989.
5. Davis, A. C.; Wu, P.; Zhang, X.; Hou, X.; Jones, B. T.; Appl. Spectrosc. Rev.2006, 41, 35.
6. Cotton, F. A.; Wilkinson, G.; Murillo, C. A.; Bochmann, M.; Advanced Inorganic Chemistry, 6th ed., John Wiley & Sons Inc.: New York, 1999. 7. Ojeda, C. B.; Rojas, F. S.; Pavón, J. M.; Am. J. Anal. Chem. 2010, 1,
127.
8. Kilinc, E.; Cetin, A.; Togrul, M.; Hosgoren, H.; Anal. Sci.2008, 24, 763. 9. Diantouba, B. A.; Guiguemde, I.; Tayeb, A.; Goetzgrandmont, G. J.;
Brunette, J. P.; Ion Exch. Solvent Extr.1994, 12, 325.
10. Sekine, T.; Kobelova, I.; Noro, J.; Nguyen, T. K. D.; Anal. Sci.1994,
10,743.
11. Reddy, P. C.; Rangamannar, B.; J. Radioanal. Nucl. Chem. Lett.1995,
200, 181.
12. Hammond, J. L-Ill.; Lee, Y.; Noble, C. O.; Beck, J. N.; Proffitt, C. E.; Sneddon, J.; Talanta 1998 ,47, 261.
13. Ghaedi, M.; Shokrollahi, A.; Niknam, K.; Niknam, E.; Najibi, A.; Soylak, M.; J. Hazard. Mater. 2009, 168, 1022.
14. Xiang, G.; Wen, S.; Wu, X.; Jiang, X.; He, L.; Liu, Y.; Food Chem. 2012,
132,532.
15. Makino, T.; Clin. Chim. Acta 1991, 197, 209.
16. Kaplan, A.; Jack, R.; Opheim, K. E.; Toivola, B.; Lyon, A. W.; Clinical chemistry interpretation and techniques; 4th ed., Williams & Wilkins: Malvern, 1995, p. 348.
17. Hinze, W. L.; Pramauro, E.; Crit. Rev. Anal. Chem. 1993, 24, 133. 18. Casero, I.; Sicilia, D.; Rubio, S.; Perez-Bendito, D.; Anal. Chem. 1999,
71, 4519.
19. Sicilia, D.; Rubio, S.; Perez-Bendito, D.; Maniasso, N.; Zagatto, E. A. G.; Anal. Chim. Acta 1999, 392, 29.
20. Pinto, C. G.; Perez-Pavon, J. L.; Moreno-Cordero, B.; Anal. Chem.1994,
66, 874.
21. Du, M.; Wu, W.; Ercal, N.; Ma, Y.; J. Chromatogr., B: Anal. Technol. Biomed. Life Sci. 2004, 803, 321.
22. Ghaedi, M.; Shokrollahi, A.; Mehrnoosh, R.; Hossaini, O.; Soylak, M.;
Cent. Eur. J. Chem.2008, 6, 488.
23. Shokrollahi, A.; Shamsipur, M.; Jalali, F.; Nomani, H.; Cent. Eur. J. Chem. 2009, 7, 938.
24. Shokrollahi, A.; Ghaedi, M.; Rajabi, H. R.; Ann. Chim. (Rome)2007,
97, 823.
25. Shokrolahi, A.; Ghaedi, M.; Shabani, R.; Montazerozohori, M.; Chehreh, F.; Soylak, M.;Alipour, S.; Food Chem. Toxicol. 2010, 48, 482. 26. Ghaedi, M.; Daneshfar, A.; Shokrollahi, A.; Ghaedi, H.; Arvin Pili, F.;
Ann. Chim. (Rome) 2007, 97, 971.
27. Shokrollahi, A.; Ghaedi, M.; Niband, M. S.; Rajabi, H. R.; J. Hazard. Mater.2008, 151, 642.
28. Shokrollahi, A.; Ghaedi, M.; Hossaini, O.; Khanjari, N.; Soylak, M.; J. Hazard. Mater.2008, 160, 435.
29. Shokrollahi, A.; Ghaedi, A.; Gharaghani, S.; Fathi, M. R.; Soylak, M.;
Quim. Nova2007, 31, 70.
30. Manzoori, J. L.; Bavili-Tabrizi, A.; Microchem. J.2002, 72, 1. 31. Abdallah, A. M.; Kabil, M. A.; Akl, M. A.; Ismael, D. S.; J. Iran. Chem.
Soc.2004, 1, 79.
32. Ghazy, S. E.; El-Shazly, R. M.; El-Shahawi, M. S.; El-Hazmi, G. A. A.; El- Asmy, A. A.; J. Iran. Chem. Soc.2006, 3, 140.
33. Ghaedi, M.; Shokrollahi, A.; Niknam, K.; Niknam, E.; Soylak, M.; Cent. Eur. J. Chem.2009, 7, 148.
34. Ghaedi, M.; Shokrollahi, A.; Niknam, K.; Soylak, M.; Sep. Sci. Technol. 2009, 44, 773.
35. Chen, J.; Teo, K. C.; Anal. Chim. Acta2003, 450, 215.
36. Kulichenko, S. A.; Doroshchuk, V. A. J.; Anal. Chem.2003, 58, 524. 37. Niknam, K.; Zolfigol, M. A.; Sadabadi, T.; Nejati, A.; J. Iran. Chem.
Soc.2006, 3, 318.
38. Zolfigol, M. A.; Salehi, P.; Shiri, M.; Sayadi, A.; Abdoli, A.; Keypour, H.; Rezaeivala, M.; Niknam, K.; Kolvari, E.; Mol. Divers.2008, 12, 203. 39. Shemirani, F.; Baghdadi, M.; Ramezani, M.; Jamali, M. R.; Anal. Chim.
Acta2005, 534, 163.
40. Dye, J. L.; Nicely, V. A.; J. Chem. Edu.1971, 48, 443.
41. Shokrollahi, A.; Ghaedi, M.; Montazerzohori, M.; Kianfar, A. H.; Ghaedi, H.; Khanjari, N.; Noshadi, S.; Joybar, S.; E-J chem.2011, 8, 495.
42. Shokrollahi, A.; Ghaedi, M.; Alipour, S.; Kianfar, A. H.; Eur. J. Chem. 2011, 2, 324.
43. Silva, E. L.; Roldan, P. dos S.; Gin, M. F.; J. Hazard. Mater. 2009, 171, 1133.