Printed in Brazil - ©2006 Sociedade Brasileira de Química 0103 - 5053 $6.00+0.00
Article
*e-mail: [email protected]
Cloud Point Extraction Spectrophotometric Determination of Trace Quantities
of Bismuth in Urine
Abbas Afkhami,* Tayyebeh Madrakian and Hajar Siampour
Department of Chemistry, Faculty of Science, Bu-Ali Sina University, Hamadan, Iran
Investigamos o processo de extração no ponto-nuvem para bismuto, a partir de soluções aquosas, usando o surfactante não-iônico Triton X-114. O método consiste na reação de complexação do Bi(III) com vermelho de bromopirogalol e extração mediada pelo sistema micelar. As condições ótimas de extração e reação (pH, concentração de reagentes, efeito do tempo de incubação etc.) foram estudadas, e as características analíticas do método (por exemplo, limite de detecção, intervalo de linearidade) foram estabelecidas. Uma resposta linear para o íon Bi(III) foi obtida no intervalo de 4,60-120,0 ng mL-1. O limite de detecção obtido foi de 2,0 ng mL-1. O efeito da interferência de alguns ânions e cátions foi também testado. O método foi aplicado para a determinação de bismuto em amostras de urina humana.
A cloud point extraction process using the nonionic surfactant Triton X-114 to extract bismuth from aqueous solutions was investigated. The method is based on the complexation reaction of Bi(III) with bromopyrogallol red (BPR) and micelle-mediated extraction of the complex. The optimal extraction and reaction conditions (e.g., pH, reagent concentration, effect of time) were studied, and the analytical characteristics of the method (e.g., limit of detection, linear range) were obtained. Linearity was obeyed in the range of 4.60–120.0 ng mL-1 of Bi(III) ion. The detection limit of the method was 2.0 ng mL-1 of Bi(III) ion. The interference effect of some anions and cations was also tested. The method was applied to the determination of bismuth in human urine sample.
Keywords: cloud point extraction, bismuth, bromopyrogallol red, spectrophotometry, triton
X-114
Introduction
Bismuth and its compound are used in semi-conductors, cosmetic preparations, alloys and metallur-gical additives and in the preparation and recycling of uranium nuclear fuels.1 Bismuth compounds have been
used in medicine for more than 200 years in a variety of gastrointestinal disorders, because of their demulcent properties.2 It has been used in antiacids, peptic ulcer
treatments, some kinds of gastritis treatments and tropical dermatological creams. As the use of bismuth in medicine increased, it has spread in the environment and the chance of exposure of organisms to bismuth has increased. A number of toxic effects in humans have been attributed to bismuth compounds, such as nephrotoxic, neurotoxic, kidney damage symptoms nephropathy, osteoarthrapathy, hepatitis and
neuro-pathology. As the uses of bismuth in medicine increases, it has spread in the environment and the chance of exposure of organisms to bismuth has increased.3
Therefore, determination of bismuth at ultra-trace levels in environmental and biological samples is important. Several methods have been developed for determination of bismuth. These include hydride generation inductively-coupled plasma optical emission spectrometry (HG-ICP-OES),4 electrothermal vaporization ICP mass spectrometry
(ETV-ICP-MS),5 atomic absorption spectrometry (AAS),6,7
potentiometric stripping analysis (PSA),8 anodic stripping
voltammetry9,10 and spectrophotometry.11
et al. J. Braz. Chem. Soc.
has attracted considerable attention. The disadvantages of liquid-liquid extraction include the use of large volumes of organic solvents. Nevertheless, several other techniques for pre-concentration of Bi have been proposed, including preconcentration using Mg-W cell electrodeposition,14
preconcentration with sodium di-n-propyl dithio-phosphinate and activated carbon in a batch method, flow injection on-line two stage solvent extraction,15 flow
injection on-line sorption preconcentration16,17 and solid
phase extraction.18-22
When the micellar solution of a nonionic or weakly polar surfactant is heated, the surfactant changes from water soluble to oil soluble. Above a certain temperature called the cloud point, it loses its water solubility nearly completely; hence, the surfactant micelles separate out from the aqueous phase. As a result, the clear solution becomes turbid and phase separation occurs. At the cloud point, the homogeneous surfactant solution separates into two phases, with one phase (called the surfactant-rich phase) containing much of the surfactant and the other phase (called the water phase) containing mostly water and surfactant monomers at a concentration near its critical micelle concentration (CMC). The hydrophobic com-pounds initially present in the solution and bound to the micelles are extracted to the surfactant-rich phase, leaving only a very small portion in the water phase.
As a new separation technique, CPE offers many advantages over traditional liquid–liquid extraction. Compared with traditional solvent extraction, CPE uses water and avoids the use of large amounts of toxic and flammable organic solvents. In addition, CPE can lead to higher recovery efficiency and a large preconcentration factor because the presence of surfactant can minimize losses of analytes due to their adsorption onto the container. The other advantage of CPE is shown in the good compatibility between the surfactant and the hydro-organic mobile phase in the sample analysis using high performance liquid chromatography (HPLC).23 CPE has been used to the separation and
preconcentration of metal ions in different samples prior to their determination by instrumental methods.24,25
Bromopyrogallol red [2-(2,7-dibromo-4,5,6-trihydroxy-3-oxo-3H-xanthen-9-yl)benzenesulphonic acid, BPR], a metal sensitive dye, is a widely used xanthene ligand. BPR has been applied to the spectrophotometric determination of many substances, such as molybdenum,26 tin,27
cetylpyridinium chloride,28 ammonium ion29and bismuth;30
and adsorptive anodic stripping voltammetric determination of bismuth.31
In this paper a cloud point extraction followed by spectrophotometric determination of bismuth is described. The method is based on the micell-mediated extraction
of the complex of Bi3+ with BPR. A nonionic surfactant,
Triton X-114, was chosen as the extraction agent.
Experimental
Apparatus
UV–Visible absorbance spectra were recorded on a Perkin-Elmer Lambda 45 UV–Vis spectrometer spectro-photometer using 1 cm quartz cells (0.5 mL). A Metrohm pH meter (model 713) with a combined glass electrode was used for pH measurements. A water bath with a good temperature control within ±1 oC and a centrifuge with
10 mL calibrated centrifuge tubes (Superior, Germany) were used to achieve and accelerate the phase separation process, respectively.
Reagents
All chemical reagents used were of analytical reagent grade, and triply distilled water was used for the experiments. Stock Bi(III) solution (1000 µg mL-1) was
prepared by dissolving 0.2312 g of Bi(NO3)3.5H2O (Merck) in 3 mL 5 mol L-1 nitric acid and diluting to the mark with
water in a 100 mL volumetric flask. Triton X-114 stock solution (2% v/v) was prepared by dissolving 2 mL of concentrated solution (Merck) in hot distilled water. A 1.8
× 10-5 mol L-1 BPR solution was prepared in water. A 0.2
mol L-1 acetic acid acetate buffer of pH 3.8 was prepared
from acetic acid and sodium acetate.
Procedure
For the cloud point extraction, an aliquot of 10 mL of a solution containing Bi(III) ion (10.0-100.0 ng mL-1), 1 mL
of pH 3.8 acetate buffer solution, 2 mL of 1.0 × 10⁻³% BPR
solution and 1 mL of 2.0% (v/v) Triton X-114 solution, were kept for 20 min in the thermostatic bath at 45 oC.
Separation of two phases was achieved by centrifugation for 15 min at 3800 rpm. The mixture was cooled in an ice bath to increase the viscosity of the surfactant-rich phase, and the aqueous phase was easily decanted by simply inverting the tube. The micellar extract from this procedure was diluted with 0.3 mL of methanol and transferred into a 0.5 mL quartz cell to measure its absorbance at 542 nm.
Determination of bismuth in urine
The samples of urine were digested as follows.32 In a
2.5 mL of concentrated HNO3, and was placed on a hot plate. The sample was moderately heated up to the disappearance of the amber color. Then, the sample was evaporated almost to dryness. Thereafter, fresh portions of 2.5 mL of concentrated HNO3 were added to the dark residue and heated to dryness. This procedure was repeated until a white ash was obtained. Finally, the residue was dissolved in 2.5 mL of 3.0 mol L-1 of HCl and diluted to
25 mL with deionized water and its bismuth content was measured as described above.
Results and Discussion
Figure 1 shows the absorption spectra for BPR and its complex with Bi(III). By complexation of Bi(III) with BPR an increase in the absorbance of the solution at 542 nm was observed. The increase in the absorbance (ΔA) at
542 nm is proportional to the bismuth concentration. The produced complex can be extracted by CPE method. Therefore, the method is suitable for preconcentration-spectrophotometric determination of bismuth.
Optimization of the system
To take full advantage of the procedure, the reagent concentrations and reaction conditions must be optimized. Various experimental parameters were studied in order to obtain an optimized system.
The concentration of surfactant that is used in CPE is critical factor. To obtain the optimal concentration of Triton X-114, the effect of surfactant concentration on the increase in the absorbance of the system (ΔA) was
investigated in the range 0.04 –0.22% (v/v). As Figure 2 shows, the ΔA of the solutions increased by increasing
the Triton X-114 concentration up to 0.16% (v/v) and remained constant at higher concentrations. The increase
in ΔA by increasing surfactant concentration can be due
to both more efficient extraction of the complex and medium effect. Therefore, 0.20% (v/v) Triton X-114 was used in the proposed method.
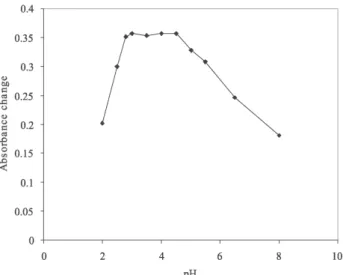
The complex formation reaction, the absorption spectra of BPR and the extraction efficiency are pH dependent. The effect of the pH on the ΔA system was studied in the
range 2-8. The pH of the solutions was adjusted by dilute NaOH and HCl solution using pH meter. The results are shown in Figure 3. As Figure 3 shows the ΔA of the system
increased by increasing pH up to 2.8, remained constant between 2.8 and 4.5 and decreased between 4.5 and 8. The complexation reaction at pH values lower than 2 and higher than 4.5 is incomplete probably due to the protonation of BPR and hydrolysis of Bi3+ ion,33
respectively. Therefore, an acetic acid-acetate buffer solution of pH 3.8 was used in the proposed method. Figure 2. Effect of surfactant concentration on the CPE preconcentration performance. Conditions: 85 ng mL-1 Bi(III) ion; 3.6 µmol L-1 BPR; pH 3.8.
Figure 3. Effect of pH on the CPE preconcentration performance. Condi-tions: 0.2%(v/v) Triton X-114; 85 ng mL-1 Bi(III) ion; 3.6 µmol L-1 BPR.
et al. J. Braz. Chem. Soc.
The effect of BPR concentration on the ΔA of the system
was investigated in the range 0.2-10.0 µmol L-1. The results
(Figure 4) showed that the ∆A of the system increased by increasing BPR concentration up to 2.0 µmol L-1 and
remained nearly constant at higher concentrations. Increase in BPR concentration causes formation of more BPR-Bi complex according to Le Châtelier principle. The increase in the ∆A of the solution by increasing BPR concentration is due to the increase in the concentration of complex. Constant ∆A at BPR concentrations higher than 2.0 µmol
L-1 shows that the complex formation equilibrium does not
shift significantly to right by increasing BPR concentration. Therefore, a 3.6 µmol L-1 concentration of BPR was selected
as optimum.
The effect of equilibration temperature and incubation time was investigated. It is desirable to employ the shortest incubation time and the lowest possible equilibration temperature, which compromise efficient separation of the phases. The incubation time was kept at 20 min, which is sufficient for the clouding procedure. It was also observed that a temperature of 45 oC is sufficient for
maximum recovery of the bismuth.
As the surfactant-rich phase was very viscous, ethanol was added to the surfactant-rich phase after CPE to facilitate its transfer into spectrophotometric cell. The amount of 0.3 mL ethanol was chosen to have an appropriate amount of sample for transferring and measuring the sample absorbance.
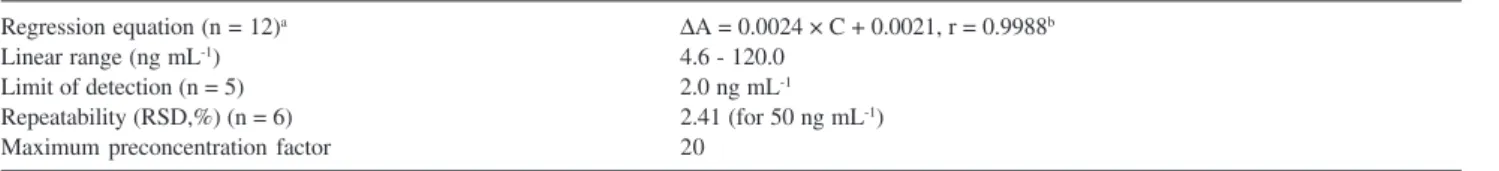
Analytical characteristics
Table 1 summarizes the analytical characteristics of the optimized method, including regression equation, linear range, limit of detection, reproducibility, and preconcentration and improvement factors. The limit of detection, defined as CL = 3 SB/m (where CL, SB, and m are the limit of detection, standard deviation of the blank, and slope of the calibration graph, respectively), was 2.0 ng mL-1. Because the amount of bismuth in 10 mL of
sample solution is measured after preconcentration by CPE in a final volume of 0.5 mL (0.2 mL surfactant-rich phase + 0.3 mL ethanol), the solution is concentrated by a maximum factor of 20.
In order to investigate the accuracy and reliability of the proposed method, bismuth was determined in a standard reference material (SeronormTM trace elements
urine). The concentration obtained by the proposed method (25.18 ± 0.09 ng mL-1) was in good agreement
with the indicated value of 25 ng mL-1.
The relative standard deviation (RSD) for six replicate measurements of 50 ng mL-1 bismuth was 2.41%.
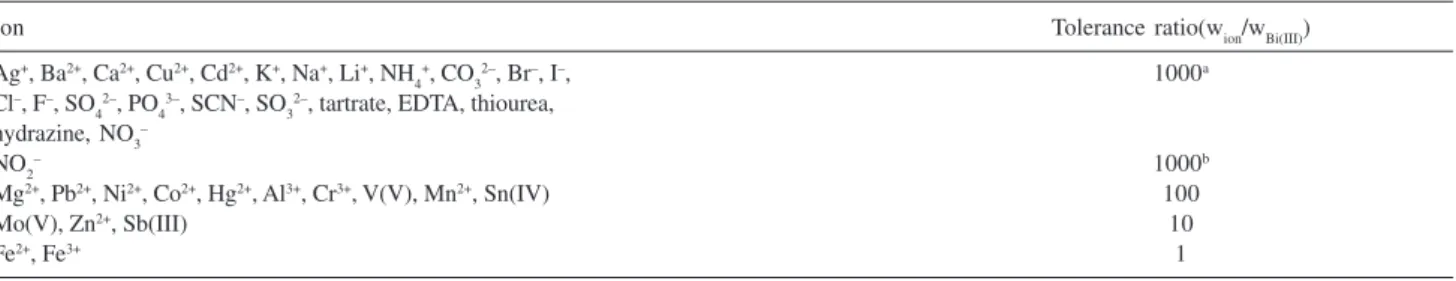
Selectivity
The effect of different cations and anions on the determination of 50 ng mL-1 bismuth ion by the proposed
method was studied. An ion was considered to be an interferent when it caused an error greater than ±5% in the determination of bismuth by the proposed method. The results are given in Table 2. Most of the investigated ions did not interfere in the preconcentration and determination of Bi(III) even when their concentrations were 100 to 1000-fold excess over Bi(III). Fe2+, Fe3+ and
nitrite interfered at 50 ng mL-1 and Sb(III) interfered at
500 ng mL-1. The interfering effect of nitrite ion was
Figure 4. Effect of BPR concentration on the CPE preconcentration per-formance. Conditions: 0.2%(v/v) Triton X-114; 85 ng mL-1 Bi(III) ion; pH 3.8.
Table 1. Analytical features of the proposed method
Regression equation (n = 12)a ΔA = 0.0024 × C + 0.0021, r = 0.9988b
Linear range (ng mL-1) 4.6 - 120.0
Limit of detection (n = 5) 2.0 ng mL-1
Repeatability (RSD,%) (n = 6) 2.41 (for 50 ng mL-1)
Maximum preconcentration factor 20
completely removed by the addition of 1000 µg mL-1
hydrazine to the solution before addition of BPR.
Applications
In order to evaluate the analytical applicability of the proposed method, it was applied to the determination of Bi(III) in urine samples. The percentage recoveries of spikes added to the urine samples prior to digestion are shown in Table 3. The good agreement between the results and known values indicate the successful applicability of the proposed method for the determination of bismuth in urine samples.
Conclusions
Cloud point extraction was used to the preconcentration of bismuth in different samples. The method, which is based on the cloud point extraction of the complex of bismuth with BPR, allows the determination of bismuth as low as 4.6 ng mL-1. The proposed method requires inexpensive
instrumentation and offers good selectivity, accuracy and precision that can be applied to the determination of bismuth in real samples. The surfactant has been used for preconcentration of bismuth in samples, and thus toxic solvent extraction, has been avoided.
References
1. Thomas, D.W. In Metals and their Compounds in the Environment; Merian, E., ed., VCH: Weinheim, 1991, pp. 789-801.
Table 3. Determination of bismuth in the real samples by the proposed method
Sample Bismuth (ng mL-1) Recovery (%)
Added Founda
Urine (man, 10.0 9.7 ± 0.5 97.0
age 28 year) 12.0 12.3 ± 1.1 102.5
15.0 15.5 ± 0.7 103.3
aAverage of four determinations ± standard deviation.
Table 2. Tolerance ratio of diverse ions on the determination of 50 ng mL-1 Bi+3
Ion Tolerance ratio(wion/wBi(III))
Ag+, Ba2+, Ca2+, Cu2+, Cd2+, K+, Na+, Li+, NH 4
+, CO 3
2–, Br–, I–, 1000a
Cl–, F–, SO 4
2–, PO 4
3–, SCN–, SO 3
2–, tartrate, EDTA, thiourea, hydrazine, NO3–
NO2– 1000b
Mg2+, Pb2+, Ni2+, Co2+, Hg2+, Al3+, Cr3+, V(V), Mn2+, Sn(IV) 100
Mo(V), Zn2+, Sb(III) 10
Fe2+, Fe3+ 1
aMaximum limit tested. bAfter removal as described in text.
2. Manhart, M. D.; Rev. Infect. Dis.1990, 12, S11.
3. Slikkerveer, A; deWolf, F. A.; Med. Toxicol. Adverse Drug Exp. 1989, 4, 303.
4. Morrow. A.; Wiltshire, G.; Huvsthous, A.; At. Spectrosc.1997, 18, 23.
5. Hinds, M. V.; Gregorie, D. C.; Ozaki, E. A.; J. Anal. At. Spectrom.1997, 12, 131.
6. Tokalioglu, S.; Kartal, S.; Elci, L.; Microchim. Acta1997, 127, 281.
7. Hall, G. E. M.; Maclaurin, A. T.; Pelchat, J. C.; Gauthier, G.; Chem. Geol.1997, 137, 79.
8. Eskilsson, H.; Jagner, D.; Anal. Chim. Acta1982, 138, 27. 9. Ye, R. D.; Khoo, S. B.; Electroanalysis1997, 9, 481. 10. Wang, C. M.; Sun, Q. Y.; Li, H. L.; Electroanalysis1997, 9,
645.
11. Abbaspour, A.; Baramekeh, L.; Talanta2005, 65, 692. 12. Sarkar, S. G.; Dhadke, P. M.; Sep. Purif. Technol.1999, 15,
131.
13. Lo, J. M.; Lin, Y. P.; Lin, K. S.; Anal. Sci.1991, 7, 455. 14. Itho, S. I.; Kaneco, S.; Ohta, K.; Mizuno, T.; Anal. Chim. Acta
1999, 379, 169.
15. Wang, J.; Hansen, E. H.; Anal. Lett.2000, 33, 2747. 16. Ivanova, E.; Yan, X. P.; Adams, F.; Anal. Chim. Acta1997,
354, 7.
17. Giacomelli, M. B. O.; Ganzarolli, E. M.; Curtius, A.; J. Spectrochim. Acta Part B2000, 55, 525.
18. Moyano, S.; Gasquez, J. A.; Olsina, R.; Marchevsky, E.; Martinez, L. D.; J. Anal. At. Spectrom.1999, 14, 259. 19. Vassileva, E.; Proinova, L.; Hadjiivanov, K.; Analyst1996, 121,
607.
20. Kocjan, R.; Garbacka, M.; Sep. Sci. Technol. 1994, 29, 799. 21. Silva, J. B. B.; Giacomelli, M. B. O.; Curtius, A. J.; Analyst
1999, 127, 1249.
22. Madrakian, T.; Afkhami, A.; Esmaeili, A.; Talanta2003, 60, 831.
23. Li, J. L.; Hung, C. B.; J. Colloid Interface Sci. 2003, 263, 625. 24. Stalikas, C. D.; TrAC, Trends Anal. Chem. 2002, 21, 343. 25. Bezerra, M. D.; Arruda, M. A. Z.; Ferreira, S. L. C.; Appl.
Spectrosc. Rev.2005, 40, 269.
et al. J. Braz. Chem. Soc.
27. Huang, X. R.; Zhang, W. J.; Han, S. H.; Wang, X. Q.; Talanta 1997,44, 817.
28. Benamor, M.; Aguersif, N.; Draa, M. T.; J. Pharm. Biomed. Anal. 2001, 26, 151.
29. Icardo, M. C.; Torro, I. G.; Zamora, L. L.; Calatayud, J. M.; Anal. Chim. Acta1999, 398, 311.
30. Nemcova, I.; Pesinova, H.; Suk, V.; Microchem J. 1984, 30, 27.
31. Guo, H.; Li, Y.; Xiao, P; He, N.; Anal. Chim. Acta2005, 534, 143.
32. Carrero, P.; Gutiérrez, L.; Rondón, C.; Burguera, J. L.; Burguera, M.; Petit de Peña, Y.; Talanta 2004, 64, 1309. 33. Alonso, A.; Almendral, M. J.; Baez, M. D.; Porras, M. J.; Lopez
Lavin, F.; Garcia de Maria, C.; Anal. Chim. Acta2000, 408, 129.
Received: November 24, 2005