Forecasting Inflation with the Phillips
Curve: A Dynamic Model Averaging
Approach for Brazil
Diego Ferreira,
*
Andreza Aparecida Palma
†
Contents: 1. Introduction; 2. Forecasting Inflation; 3. Forecasting with Dynamic Model Averaging; 4. Forecast Performance; 5. Conclusions.
Keywords: Phillips Curve, Inflation, Forecast, Time-Varying Parameter. JEL Code: C11, C15, C53, E31, E37.
This paper proposes a generalized Phillips curve in order to forecast Brazilian inflation over the 2003:M1–2013:M10 period. To this end, we employ the Dy-namic Model Averaging (DMA) method, which allows for both model evolution and time-varying parameters. The procedure mainly consists in state-space representation and by Kalman filter estimation. Overall, the dynamic specifica-tions deliver good inflation predicspecifica-tions for all the forecast horizons considered, underscoring the importance of time-varying features for forecasting exercises. As to the usefulness of the predictors on explaining the Brazilian inflation, there are evidences that the short- and long-term Phillips curve relationship may be rejected for Brazil while short- and medium-term exchange rate pass-through apparently has been decreasing in the last years.
O presente estudo propõe uma curva de Phillips generalizada para prever a infla-ção brasileira no período 2003:M1–2013:M10. Neste sentido, emprega-se o método Dynamic Model Averaging, que permite tanto a evolução do modelo quanto parâ-metros variando no tempo. O procedimento consiste basicamente em representação de estado-espaço e estimação via filtro de Kalman. De modo geral, as especificações dinâmicas proveram boas predições para todos os horizontes considerados, dando enfoque à importância de elementos variantes no tempo ao realizar previsões. Com relação a utilidade do conjunto de preditores para explicar a dinâmica da inflação brasileira, existem evidências de que a curva de Phillips pode não se adequar a econo-mia nacional no curto e longo prazo, enquanto o repasse cambial de curto e médio-prazo aparenta ter se reduzido nos últimos anos.
*Universidade Federal do Paraná (UFPR). Curitiba–PR, Brasil. E-mail:[email protected]
1. INTRODUCTION
Forecasting the behavior of inflation has been a common procedure for economies under the inflation-targeting regime. Given the lags with which monetary policy ultimately affects the macroeconomic environment, Central Banks must take a forward-looking stance in order to maintain the stability of prices. Moreover, since long-term nominal commitments (e.g. labor contracts and mortgages) and price stickiness are usual features of modern economies, forecasting inflation is also crucial for private sector decision-making. Although many different approaches have been suggested by macroeconomic research, the Phillips curve remains the conventional framework for inflation forecasts.
Ever since the paper of Phillips (1958), which provided the first1formal statistical evidence of the
rela-tionship between wages and unemployment in the United Kingdom, the trade-off between inflation and real economic activity has been intensely discussed by theoretical and empirical research. Samuelson & Solow (1960) hypothesized the same trade-off for the US economy, arguing that it provided a menu of policy choices since governments could always reduce unemployment by bearing some inflation. Hence, these findings favored the Keynesian counter-cyclical policy prescriptions (quantitative easing), whose effectiveness was intrinsically related to the assumption of non-neutral impact of monetary policy in the short-run.
By amending the Phillips curve to allow for agents’ expectations, Phelps (1967) established the so-calledexpectations-augmented Phillips curve(EAPC) through explicitly modeling firms’ wage and price-setting behavior. From an intertemporal perspective, the author argued that inflation expectations would induce future changes on the trade-off between inflation and unemployment since the adjust-ments of wages and prices are infrequently and based on inflation forecasts. On the other hand, in the presence ofrational agents, Lucas (1976) asserted that inflation expectations could not systematically differ from actual inflation, establishing what was later called thenew Classical Phillips curve(NCPC).
In the recent economic modeling, theoretical microfoundations based on staggering prices and mo-nopolistic competitive firms have taken a prominent role. The standard new Keynesian Phillips curve
(NKPC) therefore specifies that current inflation is a function of forward-looking inflation expectations and of real marginal costs. By reassuring the short-run non-neutrality of money due to nominal and real rigidities (Christiano, Eichenbaum, & Evans, 2005), this approach has validated the idea that increasing inflation might reduce unemployment, even though not permanently (Blanchard & Galí, 2007; Fuhrer & Moore, 1995; Galí & Gertler, 1999; Roberts, 1995).
However, from an empirical perspective, the literature presents a wide range of issues; see Gordon (2011) for an in-depth survey. In general, there is disbelief on whether the Phillips curve baseline is appropriate in tracking inflation dynamics. Despite the evidences of Stock & Watson (1999), Galí & Gertler (1999) and Galí, Gertler, & López-Salido (2001) in favor of the inflation-unemployment correlation, the studies of Atkeson & Ohanian (2001), Lindé (2005) and Rudd & Whelan (2005) revealed that those results essentially relied on the sample period and the forecast horizon.
Furthermore, conventional regression-based methods usually deal with time inconsistency. Accord-ing to Lucas (1976), the structure of an econometric model is built on optimal decision rules of economic agents, hence policy regime shifts might influence the coefficients of the estimated behavioral equations. Macroeconomic research has often attempted to overcome such restraint.
Two main outcomes arise from time heterogeneity: (i) uncertainty with respect to the relevant set of predictors at each period (Gordon, 1982, 1990; Stock & Watson, 1999, 2008); and (ii) potential parameter instability (Canova, 2007; Musso, Stracca, & Van Dijk, 2009). Such time-varying behavior may emerge from e.g. structural breaks and business cycle dynamics, thus damping the effectiveness of traditional
1Although the work of Fisher (1926) had previously established a correlation between unemployment rates and inflation for the
Phillips curve estimations. In order to address the latter issues, sophisticated methods of forecast com-bination have been employed. As to the US economy, Wright (2009) showed that the Bayesian Model Averaging (BMA) has provided a good performance on forecasting inflation while Kapetanios, Labhard, & Price (2008) found similar results for UK with the method of Information-Theoretic Model Averaging (ITMA).
Regarding the Brazilian literature, Sachsida (2014) provides a recent comprehensive survey. Similarly to the international experience, Brazilian research has yet to achieve a consensus on the implications of the Phillips curve for monetary policy and business cycle fluctuations. While some studies advocate against the inflation-unemployment correlation depicted by the Phillips curve (Cysne, 1985; Maka & Barbosa, 2013; Sachsida, Ribeiro, & Santos, 2009), evidences of its existence for Brazilian data can also be found (Areosa & Medeiros, 2007; Correa & Minella, 2005; Mazali & Divino, 2010; Portugal & Madalozzo, 2000). However, little attention has been given to forecasting inflation with potential time-varying features for Brazil (see e.g. Arruda, Ferreira, & Castelar, 2011, and Carlos & Marçal, 2013). To the best of our knowledge, there is no analysis on forecasting Brazilian inflation taking into account both model and parameter uncertainty.
It is the purpose of this paper to provide some insights on the latter matters. We underscore the importance of a time-varying method to forecast Brazilian inflation given the potential sub-sample in-stability from some economic changes experienced in the recent years. For instance, one could mention the burdensome macroeconomic effects in the aftermath of a confidence crisis triggered in financial mar-kets by the anticipation of Lula’s victory in late-2002, the monetary tightening engendered by Afonso Bevilaqua in 2005 and the 2007 US subprime mortgage crisis. Therefore, the empirical strategy adopted follows closely Koop & Korobilis (2012). Based on the previous work of Raftery et al. (2010), the authors recently proposed a Dynamic Model Averaging (DMA) approach to forecast US inflation, which allows for the forecasting model to change over time as well as its parameters. The exercise mainly consists on state-space representation and Kalman filter estimation. We also account for a variety of alternative fore-casting procedures in order to compare predictive performance. The models include Brazilian monthly data for the period 2003:M1–2013:M10.2 The Broad National Consumer Price Index (IPCA) is used as the
measure of inflation along with eight potential predictors.
The results have shown that DMA and DMS are able to deliver good inflation predictions for all forecast horizons considered, highlighting the importance of time-varying features. Also, evidences suggest that the and long-term Phillips curve relationship may be rejected for Brazil while short-and medium-term exchange rate pass-through has been recently decreasing. From a monetary policy viewpoint, the short-term interest rate and the inflation expectations seem to have remained useful inflation predictors throughout the sample period.
The outline of this paper is as follows. Besides this Introduction and the Conclusions, this paper is divided into three parts. The first proposes a reduced form generalized Phillips Curve model as our the-oretical framework, centering our attention in the set of predictors as well as the data transformations. The second initially addresses the Dynamic Model Averaging approach, underscoring its differences to the Bayesian Model Averaging and discussing how both model and parameter uncertainty are taken into account. Later, we present our empirical results, exploiting the usefulness of the chosen predictors and comparing models’ forecasting performance.
2. FORECASTING INFLATION
Inflation is an intriguing phenomenon, driving both monetary and fiscal policy (Leeper, 1991; Sargent & Wallace, 1975; Taylor, 1993). Accordingly, under the inflation-targeting regime, achieving and main-taining price stability are the primary objectives of Central Banks around the world. Thus, given the
2As will be discussed in section 2.1, the sample period was established in order to cope with a major methodological break within
forward-looking nature of monetary policy, forecasting inflation has portrayed an prominent role on designing optimal policy decision-making.
In order to provide some insights on the Brazilian inflation dynamics, this paper aims to evaluate the predictive performance of time-varying forecasting models, namely the Dynamic Model Averaging (DMA) method. Hence, we propose a generalized Phillips curve specification as the theoretical background since macroeconomic research has yet to achieve a consensus on the implications of different Phillips curve specifications. Overall, this procedure follows closely Koop & Korobilis (2012).
2.1. A Reduced Form Generalized Phillips Curve Model
Despite the Phillips curve ubiquity in macroeconomic literature, there remains no consensus on its specification and thus its implication for inflation dynamics. Given the existence of rigidities in the structure of the economy (e.g. sticky wages and prices, information asymmetry and menu costs), recent empirical research has extended the standard Phillips curve by including additional measures of real ac-tivity as potential predictors for future inflation (Atkeson & Ohanian, 2001; Christiano et al., 2005; Galí & Gertler, 1999; Sbordone, 2002; Stock & Watson, 1999).
While most works focused at uncovering structural parameters, this paper proposes a reduced form Phillips curve representation for the purpose of inflation forecasting. Therefore, based on Koop & Koro-bilis (2012), we apply the following generalized Phillips curve specification as our predictive regression:
yt=µ+xt′−1β+
p ∑
j=1
ϕjyt−j+εt (1)
whereyt is the inflation measure, defined asyt =∆ln(Pt)=lnPt−lnPt−1withPt being the free IPCA
inflation (headline inflation measured by the Broad National Consumer Price Index, excluding adminis-tered prices), andxt is the set of predictors. The specification thus includes unemployment rate, real
GDP growth (measured at factor prices, realized by the IPCA), industrial capacity utilization, commodi-ties price index, nominal exchange rate (units of home currency per unit of foreign currency, R$/US$), import price index, inflation expectations3(measured as the averaged expectation at timetfor inflation
at timet+1) and short-term interest rate (measured as Brazilian Central Bank’s overnight call rate). This
set of variables is in line with empirical works regarding the generalized Phillips curve (Fonseca Neto, 2010; Koop & Korobilis, 2012; Stock & Watson, 1999; Tombini & Alves, 2006). The time series were down-loaded from the Brazilian Institute of Geography and Statistics (IBGE), the Institute of Applied Economic Research (IPEA) and the Brazilian Central Bank (BCB).
Sample period spams from 2003:M1 to 2013:M10. Despite the recurrent lack of long period data for Brazil, the sample period is also restricted due to a methodological break in 2002 within the Monthly Un-employment Survey (PME). In general, PME started considering working-age population those aged ten or older (instead of fifteen or older, as before) as well as broadened the geographic area covered, includ-ing several municipalities to the six metropolitan regions surveyed before. As a result, unemployment rates increased more than 50% when compared to the old series.
All series were seasonally adjusted by the X-12-ARIMA method. All variables are transformed to be approximately stationary. The commodities price index and the import price index were transformed to their respective growth rates, thus reflecting measures of inflation. The nominal exchange rate enters the analysis in its first difference in order to evaluate its pass-through degree on inflation; a positive variation means depreciation. Finally, unemployment rate, industrial capacity utilization, inflation ex-pectations and short-term interest rate underwent no further transformations.
3The present paper uses inflation expectations from the Focus-Market Readout, published by the Brazilian Central Bank’s Investor
3. FORECASTING WITH DYNAMIC MODEL AVERAGING
Since the seminal forecasting paper by Bates & Granger (1969),4 model averaging has become a
recur-rent empirical tool to deal with model uncertainty. Even though many differecur-rent approaches have been suggested, the Bayesian Model Averaging (BMA) is considered a well-established methodology for linear regression models when there is uncertainty about which variables to include.
Given that a single linear model which includes all variables may be inefficient or even infeasible due to limited data, uncertainty arises from the existence ofN =2m different set of models denoted
asM ={Mi}iN=1, wheremis the number of potential regressors andMi is thei-th of the N models
considered. From the posterior model probabilities, BMA explicitly incorporates this uncertainty into statistical inference. Briefly, the output of a Bayesian analysis is the probability distribution for some quantity of interest (e.g. a forecast), Ω, givenM and the observed data at timet,Dt. Therefore, the
probability distribution is given by
p(Ω|Dt,M)=
N ∑
i=1
p(Ω|Mi,Dt)p(Mi|Dt), (2)
wherep(Ω|Mi,Dt) is the conditional probability distribution ofΩ given a modelMi and the dataDt,
andp(Mi|Dt) is the conditional probability of the modelMi being the true model given the data. In
other words, equation (2) is an average of the posterior distributions under each of the models consid-ered, weighted by their posterior model probability. The posterior probability for modelMi is defined
as
p(Mi|Dt)=∑Np(Dt|Mi,Dt−1)p(Mi|Dt−1) i=1p(Dt|Mi,Dt−1)p(Mi|Dt−1)
, (3)
where
p(Dt|Mi,Dt−1)=
∫
p(Dt|θi,Mi,Dt−1)p(θi|Mi,Dt−1)dθi (4)
is theintegratedlikelihood of modelMi;θi is the vector of parameters of modelMi;p(θi|Mi,Dt−1) is the prior density of θi under model Mi and the previous period’s data; andp(Dt|θi,Mi,Dt−1) is the likelihood. Equation (3) therefore provides a coherent way of summarizing model uncertainty after observing the data. Moreover, one should notice that the weights are formed as part of a stochastic process since p(Mi|Dt) is obtained fromp(Mi|Dt−1) via intermediate steps (Kapetanios et al., 2008) and that all probabilities are implicitly conditional onM.
Given the latter procedures, the estimated posterior mean and variance ofΩ are then constructed
as
E[Ω|Dt]=
N ∑
i=1
ˆ
Ωip(Mi|Dt) (5)
Var(Ω|Dt)= N ∑
i=1
(
Var(Ω|Dt,Mi)+Ωˆi2 )
p(Mi|Dt), (6)
whereΩˆi =E[Ω|Dt,Mi](Draper, 1995; Raftery, 1993).
Despite the improvement in dealing with model uncertainty, the BMA is restricted to static linear models. Allowing for the set of regressors as well as their marginal effects to vary over time may provide in-depth information on how a process is likely to evolve. For instance, Koop & Korobilis (2012) argued that time-varying features are of great interest in empirical macroeconomics due to the potential oc-currence of structural breaks and to business cycle dynamics. Hence, Raftery et al. (2010) developed
4Despite the seminal contributions of Bates & Granger (1969) on model averaging and forecast, the first mention of model
the Dynamic Model Averaging (DMA) methodology, encompassing the BMA as well as hidden Markov models, forgetting in state-space modeling and Kalman filter estimation.
Consider a linear time-varying model structure, withyt being the dependent variable;zt=[1,xt−h]
a1×mvector of regressors;θt anm×1vector of coefficients (states),εt
ind
∼N(0,Ht), andut
ind
∼N(0,Qt):
yt=ztθt+εt (7a)
θt+1=θt+ut, (7b)
fort=1,. . . ,T. Furthermore, the errors,εt andut, are assumed to be mutually independent at all leads
and lags. Despite allowing for the parameters to evolve over time following a driftless random walk process, equations (7a) and (7b) still incur model uncertainty since it is assumed thatzt is the relevant
set of regressors at all points in time. Thus, given the existence ofN=2m set of models with different
subsets ofzt as regressors, Koop & Korobilis (2012) rewrite the latter equations as
yt=zt(k)θ
(k)
t +ε
(k)
t (8a)
θt(k+)1=θt(k)+u
(k)
t , (8b)
whereεt(k) isN(0,Ht(k)),ut(k) isN(0,Qt(k)) andzt(k) is a subset ofzt, fork =1,. . . ,N. Moreover, let
Mt ∈ {1,2,. . . ,N}denote one of the models in the population at time,Θt =(θt(1) ′,. . . ,
θt(k)′)′the state vector andyt =(y1,. . . ,yt)′ the information available at each point of time, DMA involves obtaining
p(Mt=kyt−1 )
, which is the probability of modelk holding at timet given data up to timet−1, and averaging some quantity of interest (e.g. a forecast) across models using these probabilities.
Since the model depicted by equations (8a) and (8b) is a switching linear Gaussian state-space rep-resentation, Koop & Korobilis (2012) asserted that the time-varying features could be addressed with a transition matrix P in the sense of Hamilton (1989), with elementspi j =p(Mt=i|Mt−1=j), for
i,j=1,. . . ,N. However, given thatN =2m andmmay be large,P is often high-dimensional, derailing
the results of standard recursive algorithms such as the Kalman filter.
In order to deal with these restraints, Raftery et al. (2010) developed an approximation which oper-ates without explicitly specifying a transition matrix such asP, reducing therefore the computational burden of the latter recursive approaches. This procedure embodies two parameters,λandα, referred as theforgetting factors. Following the state-state model in equations (7a) and (7b), for given values of Ht andQt, Kalman filtering begins with the result that
θt−1yt−1 ∼N
(ˆ
θt−1,Σt−1|t−1
)
, (9)
where formulae forθˆ
t−1 and Σt−1|t−1 are standard, depending onHt andQt. Subsequently, Kalman
filtering continues, with
θtyt−1 ∼N (ˆ
θt−1,Σt|t−1
)
, (10)
where
Σt|t−1=Σt−1|t−1+Qt. (11)
Since specifyingQt is demanding and often little information is available, Raftery et al. (2010)
im-posed an exponential decay and replaced equation (11) by
Σt|t−1=λ−1Σt−1|t−1, (12)
or, equivalently,Qt = (
1−λ−1)
Σt−1|t−1. Hence, there is no need to estimate or simulateQt, but only
Ht. Also, the forgetting factorλimplies that observationsjperiods in the past have weightλj. Given
much weight as last period’s observation (for monthly data). Following Raftery et al. (2010) and Koop & Korobilis (2012), we considerλ∈(0.95,0.99).
According to Koop & Korobilis (2012), inference in the one-model case is then completed by the
updating equation:
θtyt ∼N (ˆ
θt,Σt|t )
, (13)
where
ˆ
θt|t=θˆt|t−1+Σt|t−1zt′(Ht+ztΣt|t−1zt′)−1 (
yt−ztθˆt−1
)
(14)
and
Σt|t=Σt|t−1−Σt|t−1zt′(Ht+ztΣt|t−1zt′)−1ztΣt|t−1. (15) As new data become available, this process is recursively repeated. Thus, recursive forecasting is done by using the one-step-ahead predictive distribution ofyt:
ytyt−1 ∼N (
ztθˆt−1,Ht+ztΣt|t−1zt′ )
. (16)
Since the results in equation (16) are all analytical, conditional onHt, Koop & Korobilis (2012)
high-lighted that no Markov chain Monte Carlo (MCMC) algorithm is required, reducing computational costs. In order to consider multiple models and uncertainty about which one is the best, Raftery et al. (2010) proposed a multi-model case based on the state-space representation depicted by equations (8a) and (8b). In this sense, estimation is analogous to the one-model case. Conditional distribution of the state at time(t−1)given the data up to that time is
p(θt−1,Mt−1yt−1
)
= N ∑
k=1 p(θt(k−)1
Mt−1=k,yt−1)p(Mt−1=kyt−1), (17)
whose conditional distribution ofθt(k−)1could be approximated by a normal distribution, denoted by
θt(k−)1Mt−1 =k,yt−1∼N(θˆt(k−)1,Σ (k)
t−1|t−1
)
. (18)
Then, one must proceed to the prediction step. Raftery et al. (2010) argued that this procedure is twofold: (i) prediction of the model indicator,Mt, via the model prediction equation; and (ii) conditional
prediction of the parameter,θt(k), given thatMt=k, via the parameter prediction equation.
Letπt−1|t−1,l =p
(
Mt−1=lyt−1). With the use of an unrestricted matrix of transition probabilities
inP with elementspkl, themodel prediction equationis then specified as
πt|t−1,k≡p
(
Mt =kyt−1 )
= N ∑
l=1
πt−1|t−1,lpkl. (19)
However, as discussed before,P is often high-dimensional. Therefore, Raftery et al. (2010) proposed an approximation for equation (19), such as
πt|t−1,k=
πtα−1|t−1 ,k
∑N
l=1πtα−1|t−1,l
, (20)
where 0 <α ≤ 1 is a forgetting factor in the sense ofλ. Even though comparable, α refers to the weight applied to model performance. For instance, ifα =0.99, forecast performance two years ago
Following Raftery et al. (2010) and Koop & Korobilis (2012), we considerα ∈(0.95,0.99). By applying the forgetting factor in the model prediction equation, there is no need of an MCMC algorithm to draw transitions between models (Koop & Korobilis, 2012).
With exponential decay, theparameter prediction equationin a multi-model setup is similar to the one in equation (10), with the superscript (k)added to all quantities:
θt(k)
Mt =k,yt−1∼N(θˆt(k−)1,Σ (k)
t|t−1
)
, (21)
whereΣt(k|t)−1=λ−1Σt(k−)1|t−1.
Furthermore, Koop & Korobilis (2012) argued that themodel updating equationis also analogous to the updating equation of the one-model setup, then being written as
πt|t,k=
πt|t−1,kpk
(
ytyt−1 )
∑N
l=1πt|t−1,lpl
(
ytyt−1
), (22)
whosepl (
ytyt−1 )
is the predictive density for modell evaluated atyt.
In general, the multi-model predictions ofyt are a weighted average of the predictions for every
modelyˆt(k), whose weights are theposterior predictive model probabilities,πt|t,k. Thus, the recursive forecasting performed by DMA is given by
ˆ
ytDMA≡E
(
ytyt−1 )
= N ∑
k=1
πt|t−1,kz (k)
t θˆ
(k)
t−1. (23)
Additionally to the DMA approach, Koop & Korobilis (2012) argued that one could instead choose to select the single model with the highest value forπt|t,kat each point in time and then perform forecasts. This exercise consists in the Dynamic Model Selection (DMS). Also, all the recursions for estimation and forecasting presented in this paper are based on choosing a prior forπ0|0,k andθ
(k)
0 , fork=1,. . . ,N. Due to potential changes in the error variance over time, we set a rolling version of the recursive method of Raftery et al. (2010) as a consistent estimator ofHt(k), so that
H Ht(k)= 1
t∗ t ∑
j=t−t∗+1 [(
yt−zt(k)θˆ
(k)
t−1
)2
−zt(k)Σ(tk|t)−1zt(k)′]. (24)
To allow for substantial change in the error variances, we sett∗=24and, thus, use a rolling estimator
based on two years of data. Moreover, to avoid the rare possibility thatHHt(k) <0, Raftery et al. (2010)
suggested replacingHt(k) byHDt(k), where
D Ht(k)=
H
Ht(k) ifHHt(k)>0
D
Ht(k−)1 otherwise .
4. FORECAST PERFORMANCE
Before evaluating the DMA performance on forecasting Brazilian inflation, some remarks must be made. First, as discussed previously, the benchmark values of the forgetting factors were set toα=0.99 and λ=0.99. Second, according to Koop & Korobilis (2012), we impose a uninformative prior over the models (π0|0,k =
1
N fork=1,. . . ,N, i.e. initially all models are equally likely) and a diffuse prior on the initial
states, such thatθ0(k)∼N(0,100Ink
)
, withnkbeing the number of variable in modelk, fork=1,. . . ,N.
all models are set to include an intercept and two lags of the dependent variable. Furthermore, the latter lag length depicts a more parsimonious specification since the estimation procedure involves a wide range of parameters.
Figures 1 to 3 provide the posterior inclusion probability of predictor. In other words, they present the probability of a predictor being useful for forecasting inflation at timet, that is, they are equivalent to the weight used by DMA attached to models with at least one predictor. We then consider three forecast horizons: short-term (h =1), medium-term (h =6) and long-term (h =12). Overall, there
are evidences that the set of predictors is changing over time, taking into account model uncertainty. Therefore, our empirical strategy seems to be suitable for dealing with potential time inconsistency while forecasting Brazilian inflation over the sample period.
As stated in Koop & Korobilis (2012), even though the posterior inclusion probability of predictor pro-vides in-depth insights on whether a given variable bears information to explain the nature of inflation dynamics, providing economic reasoning from such reduced-form forecasting exercise might not be rea-sonable. Also, the aim of this paper is not to examine the macroeconomic implications of the following results, but rather evaluate forecasting performance. Yet, we still attempt to discuss some of them in light of macroeconomic theory.
With exception of the medium-term, there is evidence that the unemployment rate is a useful infla-tion predictor in the beginning of the sample period. However, after mid-2008, the variable practically lost its capability to forecast t+1and t+12inflation. Regarding the medium-term, unemployment
regained its predictive power from 2009 until mid-2011. In general, this result provides empirical evi-dence that the short- and long-term Phillips curve relationship, in the recent years, may be rejected for Brazil; see e.g. Minella, Freitas, Goldfajn, & Muinhos (2003) and Mendonça, Sachsida, & Medrano (2012) for similar results.
Regarding the industrial capacity utilization, its usefulness as an inflation predictor is more promi-nent in the first half of the sample period, especially for short- and medium-term forecasts. However, despite the downward trend since mid-2007, it has regained its short-term predictive power for changes in consumer price inflation after 2011. Moreover, except forh=12, real GDP growth remained a useful
Figure 1.Posterior inclusion probability of predictors (h=1).
2004 2005 2006 2007 2008 2009 2010 2011 2012 2013 0
0.2 0.4 0.6 0.8 1
(a)
2004 2005 2006 2007 2008 2009 2010 2011 2012 2013 0
0.2 0.4 0.6 0.8 1
(c)
2004 2005 2006 2007 2008 2009 2010 2011 2012 2013 0
0.2 0.4 0.6 0.8 1
(d)
2004 2005 2006 2007 2008 2009 2010 2011 2012 2013 0
0.2 0.4 0.6 0.8 1
(b)
STIR t INFEXP
t UNEMP
t CPU
t
GDP t NER t
COMPRICE t IPI
t
Figure 2.Posterior inclusion probability of predictors (h=6).
2004 2005 2006 2007 2008 2009 2010 2011 2012 2013 0 0.2 0.4 0.6 0.8 1 (a)
2004 2005 2006 2007 2008 2009 2010 2011 2012 2013 0 0.2 0.4 0.6 0.8 1 (c)
2004 2005 2006 2007 2008 2009 2010 2011 2012 2013 0 0.2 0.4 0.6 0.8 1 (d)
2004 2005 2006 2007 2008 2009 2010 2011 2012 2013 0 0.2 0.4 0.6 0.8 1 (b) UNEMP t CPU t GDP t NER t COMPRICE t IPI t STIR t INFEXP t
Notes:UNEMP=unemployment rate; CPU=industrial capacity utilization; GDP=real GDP growth; NER=nominal exchange rate; INFEXP=inflation expectations (t+1); STIR=short-term interest rate; COMPRICE=commodities price index; IPI= import price index.
Figure 3.Posterior inclusion probability of predictors (h=12).
2004 2005 2006 2007 2008 2009 2010 2011 2012 2013 0 0.2 0.4 0.6 0.8 1 (a)
2004 2005 2006 2007 2008 2009 2010 2011 2012 2013 0 0.2 0.4 0.6 0.8 1 (c)
2004 2005 2006 2007 2008 2009 2010 2011 2012 2013 0 0.2 0.4 0.6 0.8 1 (d)
2004 2005 2006 2007 2008 2009 2010 2011 2012 2013 0 0.2 0.4 0.6 0.8 1 (b) UNEMP t CPU t GDP t NER t COMPRICE t IPIt STIRt INFEXP t
predictor from 2005 to 2011.
As to the nominal exchange rate, we found evidences that its capability to predict inflation has substantially weakened since 2007, forh=1andh=6. One could thus argue these evidences favor the
idea that the short- and medium-term degree of the Brazilian exchange rate pass-through (ERPT) have been recently decreasing; see e.g. Minella et al. (2003), Muinhos (2004) and Nogueira Jr (2007) for similar results. One intuition behind this result is that the adoption of the IT regime led to credibility gains of monetary policy, therefore keeping low inflation expectations even after depreciation (Nogueira Jr, 2007). Yet, since the nominal exchange rate generally prevails as a useful inflation predictor throughout the sample period for long-term forecasts, there is also empirical evidence for the presence of long-term ERPT in Brazil.
In mid-1999, the Brazilian Central Bank adopted an inflation-targeting (IT) framework for monetary policy with the short-term interest rate (STIR) as the main instrument. Hence, the STIR has been a consistent inflation predictor from mid-2005 onwards. This result further strengthens the idea of a steady stance on the control of inflation by the Central Bank.
Besides providing a nominal anchor for monetary policy, the IT regime was also designed to anchor inflation expectations. For short-term forecasts, inflation expectations followed a similar pattern to the STIR from 2005 until late-2010, though with a downward trend thereafter. As to medium-term, the posterior inclusion probability reached its maximum value in 2006, remaining as a useful predictor throughout the rest of the sample. Regarding long-term forecasts, the posterior inclusion probability presents a rather volatile behavior. Consequently, we find that inflation contains an important forward-looking component despite inflation expectations losing predictive power in the recent years.
Regardless the forecast horizon, we observe a bimodal posterior inclusion probability for the com-modities price index (COMPRICE) and the import price index (IPI). On the other hand, as the forecast horizon increases, their predictive power seems to decrease, with the partial exception of IPI, forh=6.
Ergo, there are empirical evidences that foreign prices movements are indeed transmitted to Brazilian consumer prices, especially in the last years. However, these results do not provide information to whether the transmission mechanism is direct, for instance when consumers buy imported goods, or indirect, when prices of domestically produced goods and services are affected by changes in the cost of imported inputs.
In order to evaluate the forecasting performance of DMA models, we employ the Mean Squared Forecast Error (MSFE) and the Mean Absolute Forecast Error (MAFE) as comparison metrics,5which are
calculated beginning in 2003:M5+h+1. We thus present results for 8 different models, namely:
• DMA withα=λ=0.99;
• DMS withα=λ=0.99; • DMA withα=λ=0.95;
• DMS withα=λ=0.95;
• DMA with time-invariant coefficients, i.e. withα=0.99andλ=1;
• BMA as a special case of DMA, i.e. withα=λ=1;
• Time-Varying Parameter (TVP) AR(2), withλ=0.99;
• Recursive OLS using all of the predictors.
5The MSFE can be obtained by
MSFE= 1
T−t1+1
T−1
∑
t=t1−1
(
yt+1−ytˆ+1|t
)2
,
while the MAFE is given by
MAFE=T−t1 1+1
T−1
∑
t=t1−1
yt+1−ytˆ+1|t
,
Tabela 1 reports the MSFE and the MAFE for the latter models. In general, DMA and DMS specifica-tions deliver good inflation predicspecifica-tions for all three forecast horizons, with DMS (α =λ=0.95) being the best model.6
Table 1.Predictive performance comparison.
h=1 h=6 h=12
MSFE MAFE MSFE MAFE MSFE MAFE
DMA (α=λ=0.99) 0.0446 0.1645 0.0525 0.1850 0.0566 0.1854
DMS (α=λ=0.99) 0.0414 0.1594 0.0490 0.1785 0.0476 0.1679
DMA (α=λ=0.95) 0.0446 0.1657 0.0489 0.1819 0.0487 0.1708
DMS (α=λ=0.95) 0.0362 0.1474 0.0400 0.1665 0.0405 0.1531
DMA (α=0.99,λ=1) 0.0456 0.1679 0.0549 0.1885 0.0580 0.1896
BMA (DMA withα=λ=1) 0.0480 0.1732 0.0581 0.1927 0.0626 0.1972
TVP-AR(2) (λ=0.99) 0.0392 0.1519 0.0606 0.1949 0.0563 0.1827
Recursive OLS 0.0496 0.1769 0.0571 0.1850 0.0516 0.1746
Notes:The forecast evaluation period is 2003:M5+h+1–2013:M10.
For instance, the TVP-AR(2) specification provides predictions as accurate as the ones from DMS (α=λ=0.95) for short-term forecasts. This implies that inflation bears sufficient information to explain
its ownt+1behavior. This perhaps is not surprising given that the Brazilian macroeconomic literature
has already pointed out the short-term nature of inflation persistence in the recent years (Arruda et al., 2011; Figueiredo & Marques, 2009; Santos & Holland, 2011). However, Tabela 1 also provides evidences that the TVP-AR(2) predictive power falls as the forecast horizon increases.
Since both DMA (α=0.99,λ=1) and BMA exhibited two of the worst forecasting performances, our
results further suggest that allowing for model and parameter to change over time increase predictive power.
Despite Recursive OLS and TVP-AR(2) performing relatively better than some DMA and DMS specifi-cations, overall both dynamic specifications still provide more accurate forecasts, with results rather favoring DMS models. As discussed in Koop & Korobilis (2012), by imposing zero weight on all models other than the best one, DMS “shrinks” the contribution of all models except a single one towards zero. Ergo, this shrinkage might have granted additional forecast benefits over DMA. On the other hand, given the constantly model switching nature of the DMS approach, the authors also argued that policymakers may disapprove it as a forecasting procedure, finding the gradual reweighting of DMA more appealing.
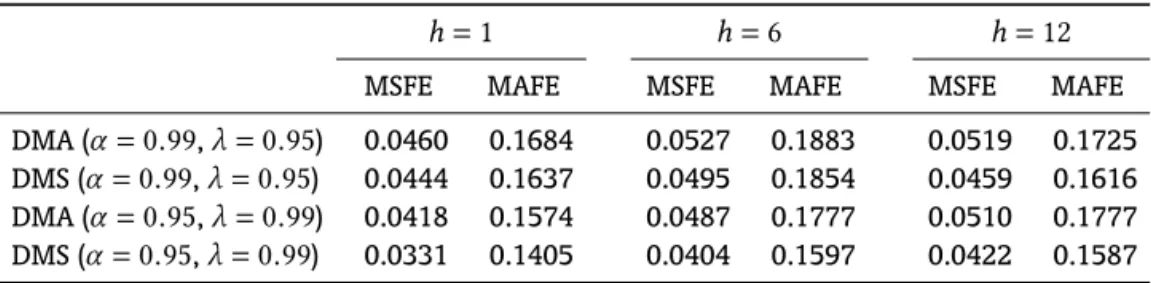
4.1. Sensitivity Analysis
Even though Raftery et al. (2010) argued thatα=λ=0.99would lead to robust results, we carry out a
sensitivity analysis in order to address any potential divergence on the forecasting performance due to the specification of the forgetting factors. Following Koop & Korobilis (2012), we specify four alternative models using different factor combinations within the rangeα,λ∈(0.95,0.99).
From the results in Tabela 2, one should note that the alternative specifications led to similar results in comparison to the ones reported in previous section, i.e., this robustness analysis evolve consistently with the previous results. However, despite DMS withα=0.95andλ=0.99forecasting a bit better than
some specifications of Tabela 1, DMS withα=λ=0.95still provided the best forecasts overall. Hence, based on these evidences, our data set seems to favor model evolution over time-varying parameters.
6Caldeira & Furlani (2013), for example, were able to achieve relatively better results than the ones presented here with a distinct
Table 2.Predictive performance comparison – sensitivity analysis.
h=1 h=6 h=12
MSFE MAFE MSFE MAFE MSFE MAFE
DMA (α=0.99,λ=0.95) 0.0460 0.1684 0.0527 0.1883 0.0519 0.1725
DMS (α=0.99,λ=0.95) 0.0444 0.1637 0.0495 0.1854 0.0459 0.1616
DMA (α=0.95,λ=0.99) 0.0418 0.1574 0.0487 0.1777 0.0510 0.1777
DMS (α=0.95,λ=0.99) 0.0331 0.1405 0.0404 0.1597 0.0422 0.1587
Notes:The forecast evaluation period is 2003:M5+h+1–2013:M10.
5. CONCLUSIONS
In this paper, we have proposed a generalized Phillips curve in order to forecast Brazilian inflation over the 2003:M1–2013:M10 period. Through an application of the Dynamic Model Averaging (DMA) approach, our specification has allowed for both model evolution and time-varying parameters, thus being less susceptible to the Lucas (1976) critique.
Our results indicate that DMA and DMS deliver good inflation predictions for all the forecast horizons considered, with DMS (α =λ = 0.95) being the best model. However, some dynamic specifications
have showed difficulty in beating naïve models (i.e. TVP-AR and recursive OLS) for short-term forecasts. Overall, the inclusion of time-varying features is found to increase predictive power, with data especially favoring changes on the set of predictors. Ergo, we underscore the usefulness of considering both model and parameter uncertainty rather than relying on traditional linear static forecasting devices.
Furthermore, the posterior inclusion probability of predictors enables explicitly evaluation of the probability of a predictor being useful for forecasting inflation. Therefore, our findings suggests that the short- and long-term Phillips curve relationship may be rejected for Brazil while short- and medium-term exchange rate pass-through has been recently decreasing. From a monetary policy viewpoint, the results indicate that price stability has remained one of the primary goals of the Brazilian Central Bank. Moreover, despite inflation expectations losing predictive power in the recent years, we have shown that the dynamics of inflation still contain an important forward-looking component.
REFERENCES
Areosa, W. D., & Medeiros, M. (2007). Inflation dynamics in brazil: the case of a small open economy. Brazilian
Review of Econometrics,27(1), 131–166. Retrieved from http://bibliotecadigital.fgv.br/ojs/index.php/bre/ article/view/1575
Arruda, E. F., Ferreira, R. T., & Castelar, I. (2011). Modelos lineares e não lineares da curva de Phillips para previsão
da taxa de inflação no Brasil. Revista Brasileira de Economia,65(3), 237–252. Retrieved from http://
bibliotecadigital.fgv.br/ojs/index.php/rbe/article/download/1523/2257
Atkeson, A., & Ohanian, L. E. (2001). Are Phillips curve useful for forecasting inflation? Federal Reserve Bank
of Minneapolis Quarterly Review,25(1), 2–11. Retrieved from https://www.minneapolisfed.org/research/ quarterly-review/are-phillips-curves-useful-for-forecasting-inflation
Barnard, G. A. (1963). New methods of quality control.Journal of the Royal Statistical Society, Series A (General),
126(2), 255–258. doi: 10.2307/2982365
Bates, J. M., & Granger, C. W. J. (1969). The combination of forecasts.Operations Research Quarterly,20(4), 451–468.
doi: 10.2307/3008764
Blanchard, O. J., & Galí, J. (2007). Real wage rigidities and the new Keynesian model. Journal of Money, Credit
and Banking,39(1), 35–66. doi: 10.1111/j.1538-4616.2007.00015.x
Caldeira, J. F., & Furlani, L. G. C. (2013). Inflação implícita e o prêmio de risco: Uma alternativa aos modelos VAR
article/view/38346
Canova, F. (2007). G-7 inflation forecasts: Random walk, Phillips curve or what else? Macroeconomic Dynamics,
11(1), 1–30. doi: 10.1017/S136510050705033X
Carlos, T. C., & Marçal, E. F. (2013, December).Forecasting Brazilian inflation by its aggregate and disaggregated
data: A test of predictive power by forecast horizon(Working Paper No. 346). São Paulo School of Economics, Getulio Vargas Foundation (FGV-EESP).
Christiano, L. J., Eichenbaum, M., & Evans, C. L. (2005). Nominal rigidities and the dynamic effects of a show to
monetary policy.Journal of Political Eocnomy,113(1), 1–45. doi: 10.1086/426038
Correa, A. S., & Minella, A. (2005). Mecanismos não-lineares de repasse cambial: Um modelo de curva de Phillips
com threshold para o Brasil. InXXXIII Encontro Nacional de Economia (ANPEC).Associação Nacional dos
Centros de Pós-Graduação em Economia.
Cysne, R. P. (1985). A relação de Phillips no Brasil: 1964–1966 versus 1980–1984.Revista Brasileira de Economia,
39(4), 401–422. Retrieved from http://bibliotecadigital.fgv.br/ojs/index.php/rbe/article/download/352/7761
Draper, D. (1995). Assessment and propagation of model uncertainty. Journal of the Royal Statistical Society.
Series B (Methodological),57(1), 45–97. Retrieved from http://www.jstor.org/stable/2346087
Figueiredo, E. A., & Marques, A. M. (2009). Inflação inercial como um processo de longa memória: análise a partir de
um modelo Arfima-Figarch.Estudos Econômicos,39(2), 437–458. doi: 10.1590/S0101-41612009000200008
Fisher, I. (1926). A statistical relationship between unemployment and price changes. International Labour
Review,13(6), 758–792.
Fonseca Neto, F. A. (2010). Persistência inflacionária e curva de Phillips novo-keynesiana para o Brasil.Revista de
Economia Política,30(2), 310–328. doi: 10.1590/S0101-31572010000200008
Fuhrer, J., & Moore, G. (1995). Inflation persistence.The Quarterly Journal of Economics,110(1), 127–159.
Galí, J., & Gertler, M. (1999). Inflation Dynamics: A structural econometric analysis. Journal of Monetary
Eco-nomics,44(2), 195–222.
Galí, J., Gertler, M., & López-Salido, J. D. (2001). European inflation dynamics. European Economic Review,45(7),
1237–1270. doi: 10.1016/S0014-2921(00)00105-7
Gordon, R. J. (1982). Inflation, flexible exchange rates, and the natural rate of unemployment. In M. N. Baily (Ed.),
Workers, Jobs and Inflation(pp. 89–158). Washington D.C.: The Brookings Institution.
Gordon, R. J. (1990). U.S. inflation, labor’s share, and the natural rate of unemployment. In H. Konig (Ed.),
Economics of Wage Determination(pp. 1–34). New York: Springer Verlag.
Gordon, R. J. (2011). The history of the Phillips curve: Consensus and bifurcation.Economica,78(309), 10–50. doi:
10.1111/j.1468-0335.2009.00815.x
Hamilton, J. D. (1989). A new approach to the economic analysis of nonstationary time series and the business
cycle.Econometrica,57(2), 357–384. doi: 10.2307/1912559
Humphrey, T. M. (1985). The early history of the Phillips curve.Economic Review,71(5), 17–24.
Kapetanios, G., Labhard, V., & Price, S. (2008). Forecasting using Bayesian and Information-Theoretic Model
Aver-aging: An application to U.K. inflation.Journal of Business & Economic Statistics,26(1), 33–41.
Koop, G., & Korobilis, D. (2012). Forecasting inflation using Dynamic Model Averaging. International Economic
Review,53(3), 867–886. doi: 10.1111/j.1468-2354.2012.00704.x
Leeper, E. M. (1991). Equilibria under ‘active’ and ‘passive’ monetary and fiscal policies. Journal of Monetary
Economics,27(1), 129–147. doi: 10.1016/0304-3932(91)90007-B
Lindé, J. (2005). Estimating new-Keynesian Phillips curves: A full information maximum likelihood approach.
Journal of Monetary Economics,52(6), 1135–1149. doi: 10.1016/j.jmoneco.2005.08.007
Lucas, J., R. E. (1976). Econometric policy evaluation: A critique.Carnegie-Rochester Conference Series on Public
Policy,1, 19–46. doi: 10.1016/S0167-2231(76)80003-6
Maka, A., & Barbosa, F. H. (2013). Phillips curves: An encompassing test. InXLI Encontro Nacional de Economia
(ANPEC).Associação Nacional dos Centros de Pós-Graduação em Economia.
Mazali, A. A., & Divino, J. A. (2010). Real wage rigidity and the new Phillips curve: The Brazilian case. Revista
Mendonça, M. J. C., Sachsida, A., & Medrano, L. A. T. (2012). Inflação versus desemprego: Novas evidências para o
Brasil.Economia Aplicada,16(3), 475–500. doi: 10.1590/S1413-80502012000300006
Minella, A., Freitas, P. S., Goldfajn, I., & Muinhos, M. K. (2003). Inflation targeting in Brazil: Constructing
credi-bility under exchange rate volatility.Journal of International Money and Finance,22(7), 1015–1040. doi:
10.1016/j.jimonfin.2003.09.008
Muinhos, M. K. (2004). Inflation targeting in an open financially integrated emerging economy: The case of Brazil.
Estudos Econômicos,34(2), 269–296. doi: 10.1590/S0101-41612004000200002
Musso, A., Stracca, L., & Van Dijk, D. (2009). Instability and nonlinearity in the Euro Area Phillips curve.
Interna-tional Journal of Central Banking,5(2), 181–212.
Nogueira, J., R. P. (2007). Inflation targeting and exchange rate pass-through.Economia Aplicada,11(2), 189–208.
doi: 10.1590/S1413-80502007000200002
Phelps, E. S. (1967). Phillips curves, expectations of inflation, and optimal unemployment over time. Economica,
34(135), 254–281. doi: 10.2307/2552025
Phillips, A. W. (1958). The relation between unemployment and the rate of change of money wage rates in the
United Kingdom, 1861-1957.Economica,25(100), 283–299.
Portugal, M. S., & Madalozzo, R. C. (2000). Um modelo de NAIRU para o Brasil.Revista de Economia Política,20(4),
26–47. Retrieved from http://www.rep.org.br/issue.asp?vol=20&mes=4
Raftery, A. E. (1993). Bayesian model selection in structural equation models. In K. Bollen & J. Long (Eds.),Testing
structural equation models(Vol. 154, pp. 163–180). Sage Publications.
Raftery, A. E., Kárný, M., & Ettler, P. (2010). Online prediction under model uncertainty via Dynamic Model
Aver-aging: Application to a Cold Rolling Mill.Technometrics,52(1), 52–66. doi: 10.1198/TECH.2009.08104
Roberts, J. M. (1995). New Keynesian economics and the Phillips curve. Journal of Money, Credit and Banking,
27(4), 975–984.
Rudd, J., & Whelan, K. (2005). New tests of the new-Keynesian Phillips curve. Journal of Monetary Economics,
52(6), 1167–1181. doi: 10.1016/j.jmoneco.2005.08.006
Sachsida, A. (2014, janeiro). Inflação, desemprego e choques cambiais: Uma revisão da literatura sobre a
curva de Phillips no Brasil(Texto para Discussão No. 1924). Brasília, DF: Instituto de Pesquisa Econômica Aplicada–IPEA.
Sachsida, A., Ribeiro, M., & Santos, C. H. (2009, outubro).A curva de Phillips e a experiência brasileira(Texto para
Discussão No. 1429). Instituto de Pesquisa Econômica Aplicada–IPEA.
Samuelson, P. A., & Solow, R. M. (1960). Analytical aspects of anti-inflation policy. American Economic Review,
50(2), 177–194.
Santos, F. S., & Holland, M. (2011). Why is Brazilian inflation so high? Inflation persistence in Brazil and other
emerging markets. InXXXIII Encontro Brasileiro de Econometria.Sociedade Brasileira de Econometria.
Sargent, T. J., & Wallace, N. (1975). “Rational” expectations, the optimal monetary instrument, and the optimal
money supply rule.Journal of Political Economy,83(2), 241–254.
Sbordone, A. M. (2002). Prices and unit labor costs: A new test of price stickiness.Journal of Monetary Economics,
49, 265–292.
Stock, J. H., & Watson, M. W. (1999). Forecasting inflation. Journal of Monetary Economics,44(2), 293–335. doi:
10.1016/S0304-3932(99)00027-6
Stock, J. H., & Watson, M. W. (2008, September).Phillips curve inflation forecasts(NBER Working Paper No. 14322).
Cambridge, MA: National Bureau of Economic Research. doi: 10.3386/w14322
Taylor, J. B. (1993). Discretion versus policy rules in practice. Carnegie-Rochester Conference Series on Public
Policy,39, 195–214. doi: 10.1016/0167-2231(93)90009-L
Tombini, A. A., & Alves, S. A. L. (2006, June). The recent Brazilian disinflation process and costs(Working Paper
Series No. 109). Brasília, DF: Banco Central do Brasil.
Wright, J. H. (2009). Forecasting US inflation by Bayesian model averaging.Journal of Forecasting,28(2), 131–144.