DOI: 10.1590/0004-282X20150052
ARTICLE
Post-activation depression of the lower
extremities in stroke patients with spasticity
and spastic equinovarus deformity
Depressão pós-ativação das extremidades inferiores de pacientes com acidente vascular
cerebral que apresentam espasticidade e deformidade equinovarus por espasticidade
Yuanbin Yang, Juan Xiao, Weiqun Song
Spasticity is common in individuals with central nervous system (CNS) disease1. It causes pain and reduces voluntary movement, which can have a disabling efect on patients and negatively afect rehabilitation outcomes. Lance’s widely used deinition of spasticity states that spasticity is a motor disor -der characterized by a velocity-dependent increase in tonic
stretch relexes (muscle tone) with exaggerated tendon jerks caused by stretch relex hyperexcitability2. A later 1994 dei
-nition described “a motor disorder characterized by a
veloc-ity-dependent increase in tonic stretch relexes that results from abnormal intra-spinal processing of primary aferent in -put”3. A deinition published in 2005 described spasticity as
“disordered sensori-motor control, resulting from an upper
motor neuron lesion, presenting as intermittent or sustained
involuntary activation of muscles”4. here is general agree
-ment that spasticity is caused by adaptations at the spinal cord level distal to the lesion.
Changes in spinal pathways may result in spasticity cluding altered muscle spindle sensitivity, presynaptic in-hibition, recurrent (Renshaw) inin-hibition, Ib inhibition
and facilitation, reciprocal Ia inhibition, group II facilita -tion, cutaneomuscular pathway changes, and post-activa-tion depression5. he last item has been an invariant ind
-ing in spasticity1,6,7, and whether hemiplegic or spinal, this
Capital Medical University, Xuanwu Hospital, Department of Rehabilitation Medicine, Beijing, China.
Correspondence: Yuanbin Yang; Department of Rehabilitation Medicine, Xuanwu Hospital of Capital Medical University; 45 Changchun Street, Xicheng District, Beijing 100053, China; Email: [email protected]
Conflict of interest: There is no conflict of interest to declare.
Received 28 November 2014; Received in final form 14 January 2015; Accepted 02 February 2015.
ABSTRACT
This study aimed to investigate changes of post-activation depression in two groups of patients with or without spastic equinovarus deformity (SED). Paired and independent t-tests were used to compare post-activation depression within and between the groups, respectively. There was a significant positive correlation between diminished post-activation depression and spasticity severity. The soleus and tibialis anterior (TA) post-activation depression values were significantly decreased on the affected sides of patients with SED compared to those without. In patients without SED, the soleus post-activation depression was significantly decreased on the affected side; however, TA post-activation depression was higher on the affected side. Both the soleus and TA become active, but the onset time may be different. The imbalanced muscle tone between the soleus and TA in the early stage after stroke may be related to equinus deformity.
Keywords: stroke, spasticity, spastic equinovarus deformity, hemiplegia, rehabilitation.
RESUMO
O principal objetivo deste estudo é a investigação da depressão pós-ativação em pacientes com deformidade equinovarus espástica (DEE). Os pacientes foram divididos em dois grupos. Student-t testes pareados e independentes foram utilizados para comparar a depressão pós-ativação intra- e inter-grupos, respectivamente. Houve uma correlação positiva significativa entre a diminuição da depressão pós-pós-ativação e a gravidade da espasticidade. A depressão pós-ativação dos músculos sóleo e tibial anterior (TA) estavam significativamente diminuídas no lado afetado dos pacientes com SEE em relação aos membros sem SEE. Em pacientes sem SEE, a depressão pós-ativação do músculo sóleo encontrava-se significativamente diminuída do lado afetado. No entanto, a depressão pós-ativação do músculo TA era maior no lado afetado que no lado não afetado. Tanto o sóleo quanto o TA serão ativados, mas o tempo para isso pode ser diferente. O desequilíbrio entre o tônus dos músculos sóleo e TA nos estágios iniciais pode estar relacionado à deformidade equina.
abnormality correlates with the degree of spasticity7 and
is not observed on the nonparetic side. Although it was
re-ported that other pathways can be changed to diferent ex -tents in patients with CNS lesions, contradictory results are
published in the literature. However, most of these studies did not report a positive correlation between the degree of these abnormalities and spasticity severity. herefore, it is
presumed that post-activation depression may have some relationship with spasticity8.
If one H-relex is induced in a resting state subject, then later stimulation will produce relexes with lower am
-plitudes at intervals of up to 10 s. Amplitude depression is
termed post-activation depression or homosynaptic depres-sion9,10,11,12. he degree of depression depends on the inter
-stimulus time: the shorter the time, the more obvious the depression13. H-relex depression is striking at short breaks
(1-2 s between two successive stimulations). In contrast, the depression is not obvious when the stimulation intervals are 8 s or longer7. Decreased synaptic neurotransmitter release may be responsible for the depression, which is most obvious in resting individuals and is weak or absent when the tested
muscle is voluntarily activated8,10.
To date, most reports have only measured lexor car -pi radialis (FCR) and soleus post-activation depression. To
our knowledge, there is no report on post-activation de
-pression of the tibialis anterior (TA). he TA may also be
-come spastic in post-stroke hemiplegia patients, which is one of the reasons for spastic equinovarus deformity (SED). herefore, the irst aim of this study was to investigate so -leus and TA post-activation depression changes in
pa-tients with SED. Our second aim was to demonstrate that TA post-activation depression impairment can also relect spasticity severity. We also conirmed the previously re
-ported inding that reduced soleus post-activation depres -sion is related to spasticity.
METHOD
Patients
his study was carried out in the Department of Rehabilitation, Xuanwu Hospital of Capital Medical University. All patients had sufered a irst stroke. Cerebral le -sions were visualized on brain computed tomography (CT)
or magnetic resonance imaging (MRI). All the patients and their guardians provided written informed consent for the experimental procedure, and the hospital ethics committee
approved this study.
To investigate the relationship between post-activation
depression and spasticity, we assessed 33 stroke patients (6 females and 27 males) aged 25–65 (48.94 ± 9.87 years). he time since the stroke ranged from 11 to 190 days (85.97 ± 67.45). Abnormal muscle tone was assessed with the composite spasticity index (CSI). he maximum possible CSI
score are 1614. he assessment was performed by a profes
-sional physiotherapist who was blinded to the
post-activa-tion depression indings.
To investigate changes in both TA and soleus
post-acti-vation depression in patients with or without SED following stroke, the subjects were divided into two groups: I, hemiple
-gia patients with SED after stroke (n = 15) and II, hemiple
-gia patients without SED after stroke (n = 18). here was no signiicant diference between the two groups with regard to age, sex, paretic side, or diagnosis.
H-reflex test
he subjects were instructed to lie in a comfortable su
-pine position. he soleus and TA H-relexes were induced and recorded using a VikingQuest device (Nicolet Biomedical, Madison, WI, USA). We used self-adhesive Ag–AgCl elec
-trodes (1.0 cm diameter) to record surface electromyogra
-phy signals. he recording electrodes were ixed to the cor
-responding skin over the muscle bellies, and the reference electrode was secured to the skin over the muscle tendon. he ground electrode was secured between the recording and reference electrodes.
he tibial nerve and common ibular nerve were stimu
-lated by a surface bipolar electrode (active cathode in the proximal part, anode in the distal part) using 1-s percuta
-neous electrical pulses. he stimulation intensity started at 0 mA and increased in 2-mA steps at a frequency of 0.2 Hz until the H-relex disappeared. he magnitude of the re
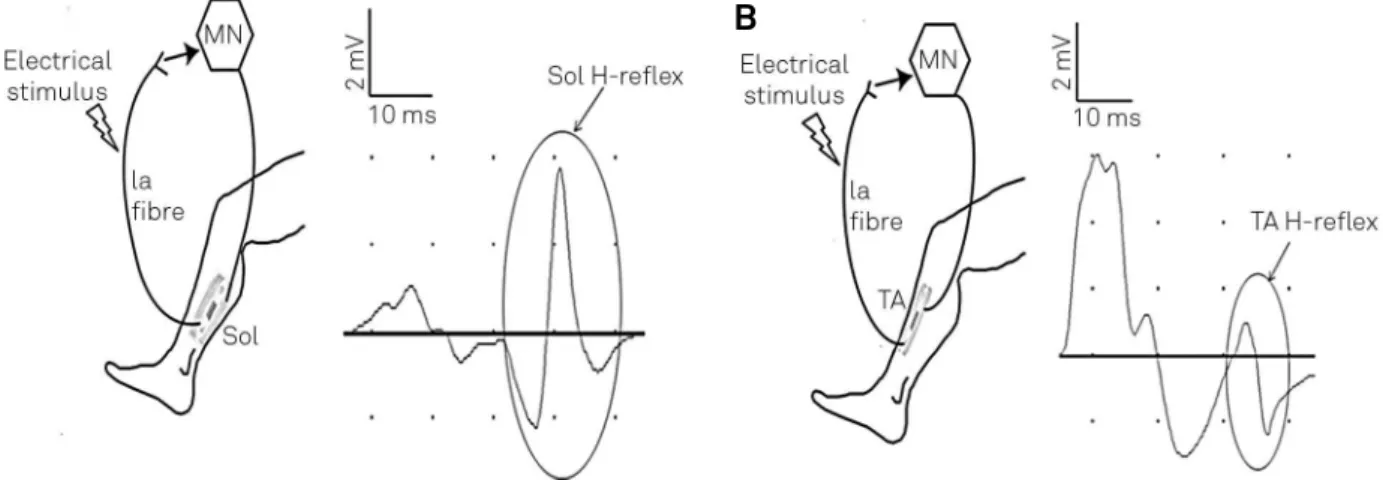
-sponse was measured as the peak-to-peak amplitude of the relex. Figure 1 shows the wiring diagram to measure soleus and TA H-relex pathways.
Post-activation depression of the H-reflex
To determine post-activation depression, the stimulation
intensity was set to the level that elicited H-relex amplitudes at the size of Hmax/2. M-waves were present in all subjects at this intensity. Sixteen consecutive H-relexes were acquired at 0.1 and 1 Hz, and again at 0.1 Hz. he stability of M-wave size was thoroughly monitored in each session. he second train of 0.1 Hz was administered to conirm that the H-relex recovered to its original size after the 0.1-Hz stimulation had
ended and to guarantee that activation remained unchanged
throughout the sessions. he amount of post-activation de -pression was computed in each patient by normalizing the
mean size of 1-Hz-induced H-relex to the mean size of the 0.1-Hz condition after elimination of the irst wave15.his is called the 1/10s ratio, and a greater value indicates less
Statistical analysis
All analyses were performed with SPSS (version 13; SPSS Inc., Chicago, IL, USA). Kolmogorov-Smirnov and equality of variances tests were used to check normali
-ty for data in each group. Paired t-tests were applied to compare soleus post-activation depression between the
unaffected and affected sides (patients with SED and pa
-tients without SED, respectively). Comparisons of the TA post-activation depression between the unaffected and affected sides also used paired t-tests (patients with and
without SED, respectively). Independent t-tests were
per-formed to compare soleus post-activation depression between patients with and without SED (affected and unaffected sides, respectively). Comparisons of the TA post-activation depression between patients with SED and patients without SED were made using paired t-tests
(affected and unaffected sides, respectively). Spearman’s correlation coefficient tests were used to explore the re -lationship between spasticity severity and the decrease in
post-activation depression. For all tests, p < 0.05 was con
-sidered statistically significant.
RESULTS
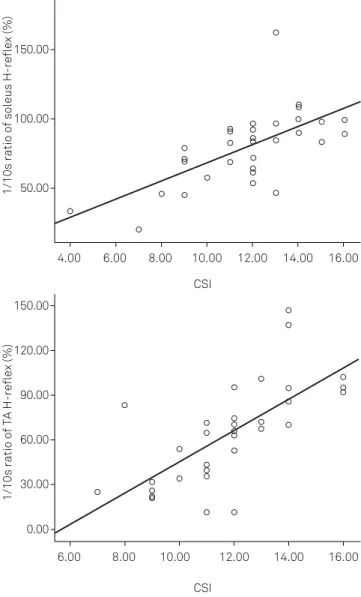
Spearman’s coeicients were used to investigate the re
-lationship between post-activation depression (1/10s ratio) and spasticity severity (CSI) (Figure 4). Both the reduced post-activation depression (implied by an increase of the 1/10s ratio) of soleus (r = 0.676, p < 0.001) and TA (r = 0.743, p < 0.001) were signiicantly positively correlated with CSI.
In other words, the larger the decrease in post-activation
de-pression, the greater the degree of spasticity.
he 1/10s ratios of the soleus and TA were assessed in stroke patients and were signiicantly increased on the af
-fected side of patients with SED compared with the a-fected side in patients without SED (soleus, p = 0.001; TA, p < 0.001). In patients with SED, the 1/10s ratios of both the soleus and
TA were signiicantly increased on the afected side com
-pared to the unafected side (soleus, p < 0.001; TA, p < 0.001). In patients without SED, the 1/10s ratio of the soleus was signiicantly increased on the afected side compared to the unafected side (p = 0.001). However, the 1/10s ratio of the TA was lower on the afected side compared to the unafect
-ed side (p < 0.001).
We also compared the time since stroke between the
two groups using an independent t-test. In patients with and
without SED, the mean times were 123.73 and 25.87 days, re
-spectively. he time diference between the two groups was signiicant (p < 0.001).
Figure 1. Wiring diagram of pathways of soleus (A) and TA (B) H-reflexes. MN: motoneuron. Sol: soleus.
A
B
Figure 2. The changes of soleus H-reflex amplitude with different electrical stimulus rate in a hemiplegia patient with lower extremity spasticity. We can see that when high-frequency (1-Hz) electrical stimulus was applied, the second and later H-reflex amplitude decreased significantly compared to the first H-reflex on the unaffected side. However, on the affected side, the second and later H-reflex amplitude also decreased, but to a much lesser extent compared to the unaffected side, and the post-activation depression of the affected side is impaired. When low-frequency (0.1-Hz) electrical stimulus was applied, the H-reflex amplitude of both the unaffected side and the affected side did not decrease significantly.
DISCUSSION
here were ive major indings of this study. (i) he most in
-teresting inding is that in patients without SED, soleus post-activation depression decreased on the afected side com
-pared to the unafected side; conversely, TA post-activation depression was higher on the afected side compared to the unafected side. (ii) Post-activation depression was de
-creased on the afected side compared to the unafected in patients with SED, and post-activation depression (both so
-leus and TA) was decreased in patients with SED compared to patients without SED on the afected side. (iii) Most pa
-tients with SED were in the subacute or chronic stage, while patients without SED were in the early stage or had mild hemiplegia. (iv) Signiicant positive correlations were found between both diminished soleus/TA post-activation depres -sion and spasticity severity.
Previous studies have revealed a signiicant positive cor -relation between reduced post-activation depression and spasticity severity6,7. Our results provide additional evidence for this relationship. A longitudinal observation of one pa
-tient with spinal cord injury (SCI) showed that the decrease of post-activation depression developed with the transi
-tion from laccid to spastic paralysis16. After CNS lesions,
post-activation depression gradually lessens as patients
transition from the acute to chronic state, which mimics the evolution of spasticity17,18. Although there is no deini -tive proof, previous studies and our indings indicate that re
-duced post-activation depression is one of the mechanisms underlying spasticity. Most reports only measured FCR and soleus post-activation depression; we have not seen any re
-ports studying TA post-activation depression. he TA may also become spastic in post-stroke hemiplegia patients. We
found that TA post-activation depression also correlated
with spasticity severity as assessed by CSI.
SED is a common pattern of neurological impairment that limits patients’ ability to walk. his deformity is reported in 18% of stroke patients19. SED includes equinus, varus, and claw toe deformities. Equinus deformity is caused by imbal
-anced muscle tone of the plantar lexor (higher) and dorsal lexor (lower), while varus deformity is associated with im
-balanced muscle tone of the inversion (higher) and evertor muscles (lower). After cerebral lesioning, the prolonged in
-creased muscle tone of the hemiplegic extremity would cause triceps shortening and tendon and soft tissue contracture, which are related to SED.
1/10s ratio of soleus H-reflex (%)
150.00
100.00
50.00
4.00 6.00 8.00 10.00 12.00 14.00 16.00
1/10s ratio of TA H-reflex (%)
150.00
120.00
90.00
30.00
0.00 60.00
6.00 8.00 10.00 12.00
CSI CSI
14.00 16.00
CSI: composite spasticity index; TA: tibialis anterior.
Figure 4. Correlation between the post-activation depression size and CSI. The amount of post-activation depression was indicated by the 1/10s ratios. The greater the 1/10s ratio, the smaller the post-activation depression. Left: soleus, data from 33 participants. Right: TA, data from 33 patients. Each small circle represents one patient. The lines in the charts are the regression lines. The correlation coefficient of the Spearman rank tests was 0.676 and 0.743, respectively (significant at the 0.001 level).
References
1. Grey MJ, Klinge K, Crone C, Lorentzen J, Biering-Sørensen F, Ravnborg M et al. Post-activation depression of soleus stretch reflexes in healthy and spastic humans. Exp Brain Res. 2008;185(2):189-97. http://dx.doi.org/10.1007/s00221-007-1142-6
2. Lance JW. Disordered muscle tone and movement. Clin Exp Neurol. 1981;18:27-35.
3. Young RR. Spasticity: a review. Neurology. 1994;44(11 Suppl 9):S12-20.
4. Pandyan AD, Gregoric M, Barnes MP, Wood D, Van Wijck F, Burridge J et al. Spasticity: clinical perceptions, neurological realities and meaningful measurement. Disabil Rehabil. 2005;27(1-2):2-6. http://dx.doi.org/10.1080/09638280400014576
5. Burke D, Wissel J, Donnan GA. Pathophysiology of spasticity in stroke. Neurology. 2013;80(2 Suppl 2):S20-6. http://dx.doi.org/10.1212/WNL.0b013e31827624a7
6. Achache V, Roche N, Lamy JC, Boakye M, Lackmy A, Gastal A et al. Transmission within several spinal pathways in adults with cerebral palsy. Brain. 2010;133(5):1470-83. http://dx.doi.org/10.1093/brain/awq053
7. Lamy JC, Wargon I, Mazevet D, Ghanim Z, Pradat-Diehl P, Katz R. Impaired efficacy of spinal presynaptic mechanisms in spastic stroke patients. Brain. 2009;132(3):734-48. http://dx.doi.org/10.1093/brain/awn310
8. Phadke CP, Flynn SM, Thompson FJ, Behrman AL, Trimble MH, Kukulka CG. Comparison of single bout effects of bicycle training versus locomotor training on paired reflex depression of the soleus H-reflex after motor incomplete spinal cord injury. Arch Phys Med Rehabil. 2009;90(7):1218-28. http://dx.doi.org/10.1016/j.apmr.2009.01.022
9. Trompetto C, Marinelli L, Mori L, Canneva S, Colombano F, Traverso E et al. The effect of age on post-activation depression of the upper limb H-reflex. Eur J Appl Physiol. 2014;114(2):359-64. http://dx.doi.org/10.1007/s00421-013-2778-5
10. Stein RB, Estabrooks KL, McGie S, Roth MJ, Jones KE. Quantifying the effects of voluntary contraction and inter-stimulus interval on the human soleus H-reflex. Exp Brain Res. 2007;182(3):309-19. http://dx.doi.org/10.1007/s00221-007-0989-x
he inversion muscles of the foot include the TA and tibi -alis posterior, while the main evertor muscle is the peroneal
muscle. he dorsal lexion muscles include the TA, extensor hallucis longus, and extensor digitorum longus. he plantar lexors comprise the peroneal muscle, triceps, lexor digito
-rum longus, tibialis posterior, and lexor hallucis longus. he TA is the main dorsal lexion and inversion muscle, while the soleus is one of the most important plantar lexion muscles. he volumes of the two muscles are large and their locations are supericial, making them easy to assess. herefore, this
study only measured the two muscles.
Based on our studies and clinical experience, SED is more likely to appear in subacute and chronic stage patients, while most patients without SED have had a recent stroke. Several studies have found that post-activation depression impair
-ments do not appear immediately after the lesion but a few weeks later, indicating that the reduction of post-activation
depression occurs gradually over time7. he decrease of
post-activation depression observed in spastic patients and
the temporal changes in the depression in the months after
SCI mimic spasticity progress20. Spasticity, SED, and impaired
post-activation depression appear gradually rather than
im-mediately after CNS lesion. hese changes take time to de -velop and thus may be due to lesion-induced changes in su-praspinal controls and plastic changes in the spinal cord that
are secondary to the loss of the supraspinal drive disrupted by
the CNS lesion7. Impaired post-activation depression may be one of the important plastic changes at the spinal cord level. Based on the above arguments, it is likely that SED is related to muscle spasticity resulting from spinal cord plasticity (such as
post-activation depression changes), and this change in
plas-ticity requires a certain amount of time after CNS damage. Interestingly, in patients without SED, soleus post-activation depression signiicantly diminished on the afected side compared to the unafected side. Conversely, TA
post-activation depression was higher on the afected side. It may be that soleus muscle tone increases irst but cannot be
detected by clinical scales. At the same time, the TA is still in
the laccid paralysis stage, which is relected by the high level of post-activation depression. However, muscle tone increas
-es with time. he earlier increase in soleus muscle tone may be due to the appearance of a more primitive pattern of loco
-motor synergy that allows simultaneous contractions of the hip, knee, and ankle extensors. herefore, in spastic hemiple -gia patients, both the agonist and antagonist (when plantar
lexion occurs, the soleus and TA, respectively) will become active to some extent. However, the onset time may be dif
-ferent. he imbalance of muscle tone between the soleus and TA in the early stage may be related to equinus deformity.
Unfortunately, we did not examine the post-activation de
-pression of the peroneal muscle for technical reasons. When
this inversion occurs, the TA is the agonist and the peroneal muscle is the antagonist. Although the post-activation
de-pression of the peroneal muscle was not tested, we deduced that the impaired post-activation depression of peroneal muscle may also occur later than for the TA, which is related to the varus deformity, just as impaired post-activation de
-pression of TA occurs later than that of the soleus. Future studies are needed to conirm our hypothesis.
In conclusion, decreased post-activation depression may
be an electrophysiological expression of spasticity. In spas -tic hemiplegia patients, both the soleus and TA will become
active to some extent during plantar lexion, but the onset times may be diferent. he imbalance of muscle tone be -tween the agonist and antagonist in early stages may result
in a speciic deformity. Post-activation depression may be a potential objective index for measuring spasticity. It may also be used to assess the efectiveness of rehabilitation therapy. Early measurement may help physicians to predict and pre
11. Tseng SC, Shields RK. Limb compressive load does not inhibit post activation depression of soleus H-reflex in indiviudals with chronic spinal cord injury. Clin Neurophysiol. 2013;124(5):982-90. http://dx.doi.org/10.1016/j.clinph.2012.10.020
12. Johnson ST, Kipp K, Norcross MF, Hoffman MA. Spinal and supraspinal motor control predictors of rate of torque development. Scand J Med Sci Sports. 2014. http://dx.doi.org/10.1111/sms.12283
13. Nielsen J, Petersen N, Ballegaard M, Biering-Sørensen F, Kiehn O. H-reflexes are less depressed following muscle stretch in spastic spinal cord injured patients than in healthy subjects. Exp Brain Res. 1993;97(1):173-6. http://dx.doi.org/10.1007/BF00228827
14. Bi S, Wan CX. Comparison of the reaction time of wrist flexion and extension between patients with stroke and age-matched healthy subjects and correlation with clinical measures. Chin Med J (Engl). 2013;126(13):2485-8.
15. Winkler T, Hering P, Straube A. Spinal DC stimulation in humans modulates post-activation depression of the H-reflex depending on current polarity. Clin Neurophysiol. 2010;121(6):957-61. http://dx.doi.org/10.1016/j.clinph.2010.01.014
16. Hiersemenzel LP, Curt A, Dietz V. From spinal shock to spasticity: neuronal adaptations to a spinal cord injury. Neurology. 2000;54(8):1574-82. http://dx.doi.org/10.1212/WNL.54.8.1574
17. Shields RK. Muscular, skeletal, and neural adaptations following spinal cord injury. J Orthop Sports Phys Ther. 2002;32(2):65-74. http://dx.doi.org/10.2519/jospt.2002.32.2.65
18. Schindler-Ivens S, Shields RK. Low frequency depression of H-reflexes in humans with acute and chronic spinal-cord injury. Exp Brain Res. 2000;133(2):233-41. http://dx.doi.org/10.1007/s002210000377
19. Bollens B, Gustin T, Stoquart G, Detrembleur C, Lejeune T, Deltombe T: A randomized controlled trial of selective neurotomy versus botulinum toxin for spastic equinovarus foot after stroke. Neurorehabil Neural Repair. 2013;27(8):695-703. http://dx.doi.org/10.1177/1545968313491002