Growth and anthropometry in hemiplegic cerebral palsy patients
Crescimento e antropometria em pacientes com paralisia cerebral hemiplégica
Marise Bueno Zonta1, Fábio Agert2, Sandra Regina B. Muzzolon3, Sérgio Antonio Antoniuk4, Neiva Isabel R. Magdalena5, Isac Bruck4,
Lúcia Helena C. dos Santos6
Institution: Universidade Federal do Paraná (UFPR), Curitiba, PR, Brasil 1Fisioterapeuta; Doutora em Saúde da Criança e do Adolescente pelo Programa de Pós-graduação do Departamento de Pediatria da UFPR, Curitiba, PR, Brasil
2Médico; Mestre em Saúde da Criança e do Adolescente pelo Programa de Pós-graduação do Departamento de Pediatria da UFPR, Curitiba, PR, Brasil
3Psicóloga; Mestre em Saúde da Criança e do Adolescente pelo Programa de Pós-graduação do Departamento de Pediatria da UFPR, Curitiba, PR, Brasil
4Neuropediatra; Professor do Departamento de Pediatria da UFPR, Curitiba, PR, Brasil
ABSTRACT
Objective: To analyze the linear growth, the head circum-ference and the anthropometric difcircum-ferences between involved and non-involved sides of 24 children with hemiplegic cer-ebral palsy, comparing them to standard values for age.
Methods: This cross-sectional study enrolled 24 con-secutive children with cerebral palsy clinically classiied as spastic hemiplegia. The anthropometric measures included: weight, lenght, head circumference, total upper limb length, hand length, palm width, total lower limb length, foot length, and limb circumference of upper-arm, thigh and calf. The anthropometric differences between both sides were calculated in centimeters and a comparison of the involved and non-involved sides was made. Two dif-ferent reference values were used to compare the measures of hand and foot length: growth charts and the software
ABase® (a PalmOS-based software). The Spearman’s
correla-tion coeficient was estimated for the associacorrela-tion between quantitative variables and the Wilcoxon non-parametric test was used for age comparisons between involved and noninvolved sides.
Results: The mean values of weight, length and head circumference were within the normal range for age and 21% of the children presented microcephaly. Discrepancy was noted between both sides in all cases, being the largest discrepancy in hand length and width. There was a positive correlation between the discrepancy observed in superior and inferior affected limbs (r=0.48), and discrepancy increases with age (r=0.44).
5Geneticista; Professora do Departamento de Pediatria da UFPR, Curitiba, PR, Brasil
6Pediatra; Neuropediatra; Professora adjunta do Departamento de Pediatria da UFPR, Curitiba, PR, Brasil
Correspondence: Marise Bueno Zonta Rua Floriano Essenfelder, 81 CEP 80060-270 – Curitiba/PR E-mail: marise.bzonta@terra.com.br
Recebido em: 18/12/08 Aprovado em: 10/6/09
Conclusion: Growth impairment in children with hemi-plegic cerebral palsy was observed on the affected limbs and in smaller proportion in head circumference.
Key-words: anthropometry; cerebral palsy; hemiplegia; growth; child.
RESUMO
Objetivo: Analisar o crescimento linear, o perímetro ce-fálico e as diferenças antropométricas entre o lado envolvido e o não-envolvido de 24 crianças com paralisia cerebral (PC) hemiplégica, comparados à média para a idade.
Métodos: Estudo transversal com amostragem consecutiva de crianças com PC, classiicadas clinicamente como hemiple-gia espástica. As medidas antropométricas incluíram: peso, estatura, perímetro cefálico, comprimento total de membro superior, comprimento da mão, largura da palma da mão, comprimento total do membro inferior, comprimento do pé e a circunferência dos membros (braço, coxa e panturrilha). As diferenças antropométricas entre os dimídios foram calculadas em centímetros e como porcentagem de encurtamento, compa-rando o lado envolvido com o não-envolvido. Dois referenciais
populacionais, tabelas de crescimento e o software ABase®,
Resultados: As médias de peso, estatura e perímetro cefá-lico se mostraram dentro dos limites normais para a idade e 21% dos pacientes apresentaram microcefalia. A discrepância entre os dimídios foi evidente em todos os casos, sendo maior na largura e comprimento da mão. Houve correlação da dis-crepância observada entre os membros superiores e inferiores no lado envolvido (r=0,48) e a discrepância aumenta com a idade (r=0,44).
Conclusões: O maior comprometimento no crescimento das crianças com paralisia cerebral estudadas ocorreu nos membros envolvidos pela hemiplegia e, em menor proporção, no perímetro cefálico.
Palavras-chave: antropometria; paralisia cerebral; hemi-plegia; crescimento; criança.
Introduction
Cerebral palsy (CP), also called chronic nonprogressive childhood encephalopathy, is caused by a brain lesion occur-ring duoccur-ring structural and functional maturation of the brain, in the pre-, peri- or postnatal period(1). Children with CP are usually affected by growth impairment, having lower weight and height than healthy children at the same age(2). Rotta(3) emphasized that these children, in addition to showing lower height and weight, are also less resistant against infections, highlighting the importance of having a normal brain so that normal physical development can be achieved.
Growth retardation in children with chronic diseases, such as CP, has a multifactorial etiology(4), and it can even be associated with non-nutritional factors resulting from brain malformation or lesions responsible for the child’s
disability(2,5). The moment when the lesion leading to CP
occurred(6), the type of movement disorder(2), the severity of
CP, mainly regarding self-feeding and walking capacity(7),
and the level of physical activity limitation(4) have been described as factors that can have an inluence on growth disorders.
Growth retardation is more important in spastic quad-riplegic CP(4,8), but it has been also reported in children with diplegia and hemiplegia(2), even when there is not malnutrition. In children with CP, approximately 35 to 40% have spastic hemiplegia, with one side of their body being more severely affected than the other(9,10). Previous studies
have demonstrated growth disorders(10,11), delay of muscle
development(5,11) and bone maturation(12) in the affected limbs of children with hemiplegia.
Due to the basic relations between the growth of dif-ferent parts of the body, disorders of the normal growth may be detected by anthropometry, which is the study of
the comparative measures of the human body(6). This is a
simple, non-invasive, and inexpensive technique. Therefore, anthropometry is the tool of choice to assess dimorphisms in children; nevertheless, it has been rarely used in the clinical practice(13). The following are the most important probable reasons for its restricted use: limited access of professionals to appropriate reference values, long time spent taking the measures, and long time spent entering data in the growth charts. Currently, speciic computer programs, such as
ABase® developed for the PalmOS-based system of palmtops,
provide anthropometric data that enable the fast comparison of measures, considering the patient’s age and sex(13).
Within this context, the objective of the present study is to analyze linear growth, head circumference, and an-thropometric differences between both sides of the body of children with hemiplegic CP, as well as the relation between head circumference and cognitive function and between anthropometric differences and motor function.
Method
This is a descriptive cross-sectional study.Our
consecu-tive sample comprised children with spastic hemiplegic CP who were being followed up at the pediatric spasticity outpatient clinic of the Center of Neuropediatrics of Hospi-tal de Clínicas of Universidade Federal do Paraná (UFPR), Curitiba, Brazil. The patients’ age ranged from 3 to 5 years old and they were seen at the outpatient clinic from June 2005 to April 2006. The patients had independent mobil-ity and their motor impairment was classiied as level I and II according to the Gross Motor Function Classiication
Sys-tem (GMFCS)(14). At the outpatient clinic, which provides
Ethics Committee of Hospital de Clínicas of Ufpr. The children’s guardians agreed with their participation in the study and signed a written consent form.
Measurements were taken in the morning always by the
same professional, according to standardized rules(15), and
they included total upper limb length, hand length, hand width, total lower limb length, foot length, and limb cir-cumference (upper-arm, thigh, and calf). The discrepancy found between both sides of the body was calculated in centimeters and percentage by comparing the affected and unaffected sides according to the following formula adapted
from the study by Demir et al(16): “Measure of unaffected
side - measure of affected side x 100 / Measure of unaf-fected side”
Values of hand length were compared with data by Fein-gold and Bossert(17), and values of foot length were compared with data by Blais et al(18) for boys and girls used by Hall et
al(15). These measures were also compared with the values
by Freeman et al using the computer program ABase®(13,19), which offers reference values for 18 anthropometric meas-ures frequently used for dimorphisms, and the results are expressed in text format and digital growth charts. In the present study, the result was expressed in text format. The computer program is available free of charge at www. medgen.unizh.ch/abase/.
Weight, height and head circumference were measured in the morning during medical visits at the outpatient clinic. All children were measured in supine position using a wood-en anthropometer. Weight was measured using a mechanical scale Fillizola, since all children were classiied as level I and II of the GMFCS, being able to stand on the scale. Z scores
were calculated using the computer program ABase®, which
has the European population as reference(19). All measures,
expressed in percentile or Z score, were considered abnormal when > 2 standard deviations (SD) above or below the mean or not between the ifth or 95th percentiles(19).
Motor function was assessed using the Gross Motor
Function Measure (GMFM)(20), developed and validated for
children with CP(21), being widely accepted even in Brazil(22). This scale was administered by the same trained professional. It comprises 88 items that assess the function related to ive dimensions of motor progress: (A) lying and rolling, (b) sit-ting, (C) crawling and kneeling, (D) standing, (E) walking, running, and jumping.
The WPPSI-R (Wechsler Preschool and Primary Scale of Intelligence-Revised)test(23) was used to assess the cognitive function. This clinical instrument is a complete revision of
the 1989 WPPSI (Wechsler Preschool and Primary Scale of Intelligence) designed for individual administration as-sessing different aspects of the intelligent of children from 3 to 7 years. It includes 12 subtests divided into two areas: Verbal and Performance.
The results of the present study were expressed as mean and SD or as frequencies and percentages. With the purpose of assessing the association between quantitative variables, we estimated the Spearman’s correlation coeficient. We compared the results from each side (affected and unaffected) with quantitative variables using the Wilcoxon nonparamet-ric test, and the level of signiicance was set at p<0.05. Data were entered in an Excel spreadsheet and analyzed using the
computer program Statistica v.6®.
Results
Twenty-four children with hemiplegic CP participated in this study. Nineteen (79%) of them were males and their
mean age was 49.3±5.2 months. With regard to laterality,
11 (45.8%) of the patients had the right side affected. Five (21%) were preterm infants and 19 (79%) were born at term. The height of three male patients was below -2 SD. Of them, two also presented with low weight and microcephaly; one of them was premature and both were small for gestational age. Cognitive status was considered normal (≥80) in 13 children (57%), and retardation (<80) was detected in 10 (43%) children. There was not a statistically signiicant cor-relation between cognitive status and head circumference
(r=0.04; p=0.85). The assessment of gross motor function
detected a mean score of 93±12%.
Mean weight was 15.5±1.5kg, while mean height was
99.7±4.6cm. Mean head circumference was 48.8±2.3cm and,
in 21 % of the children, it was lower than -2 SD. Informa-tion regarding these data and their respective z scores and percentiles for each child are described in Table 1.
Table 1 – Gender, anthropometric data and intelligence quotient (IQ) in the population studied
Gender Weight Height Head circumference IQ
kg Z score cm Z score cm Percentileª
1 M 18.0 0.95 99 -0.56 51.5 -2 SD - Md 45
2 M 16.4 -0.39 102 -0.75 47.5b -3.7 SD 52
3 M 17.5 0.39 104 0.08 50.2 -2 SD - Md 81
4 M 17.0 0.07 102 -0.50 49.0 -2 SD - Md 80
5* F 16.0 -0.34 103 -0.19 42.0 -3.6 SD 56
6 M 15.5 -1.22 102 -1.21 49.5 -2.4 SD 74
7 M 14.5 -0.48 100 0.24 49.0 -2 SD - Md 77
8* M 16.5 -0.08 102 -0.38 49.0 -2 SD - Md 99
9 M 14.8 -1.30 102 -0.75 45.6 b -2 SD - Md 67
10 F 17.9 1.32 102 1.03 48.0 -2 SD - Md 88
11* F 13.7 -1.76 94 -2.39 46.5 b -4.4 SD 101
12* M 16.0 0.45 105 1.60 51.0 -2 SD - Md 44
13 M 16.2 0.74 98 0.20 48.4 -2.6 SD 126
14 M 15.0 -1.08 100 0.17 47.5 -3.6 SD 43
15 M 14.5 -1.03 100 -0.59 49.0 -2 SD - Md 98
16 F 13.5 -0.54 96 0.01 49.2 -2 SD - Md 61
17 M 15.5 -0.70 88 -3.61 52.8 -2 SD - Md 72
18 M 13.6 -2.12 98 -1.54 48.2 -3.0 SD 94
19 M 16.2 0.11 104 0.63 53.0 M - +2 SDe 76
20 M 13.0 -2.58 91 -3.22 47.7 b -3.7 SD 50
21 M 17.7 -0.18 106 -0.45 49.5 -2.4 SD 94
22* M 13.0 -2.58 91 -3.22 47.7 b -3.7 SD c
23 F 16.0 -0.05 98 -0.70 48.4 -2.9 SD 83
24 M 15.0 -1.08 104 -0.17 51.0 -2 SD - Md 141
* Preterm children: 33, 34, 26, 32 and 27 weeks; ªData from the computer program ABase®; bdata corresponding to -2 standard deviations (SD) in the growth chart; c unavailable data; d -2 SD – M: value between -2 SD and mean; eM - +2 SD: value between the mean and +2 SD.
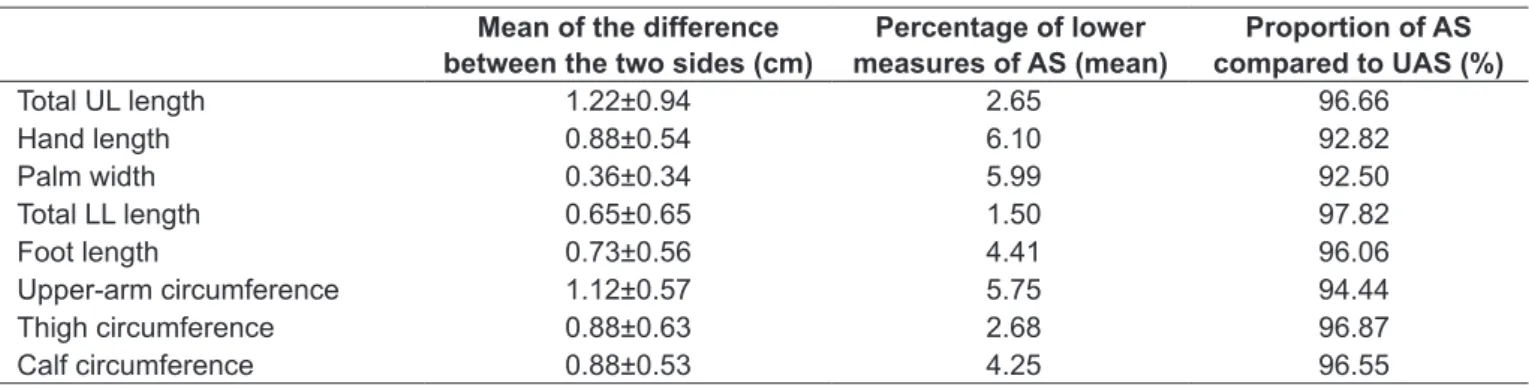
Table 2 – Relation between the measures of the affected and unaffected sides
Mean of the difference between the two sides (cm)
Percentage of lower measures of AS (mean)
Proportion of AS compared to UAS (%)
Total UL length 1.22±0.94 2.65 96.66
Hand length 0.88±0.54 6.10 92.82
Palm width 0.36±0.34 5.99 92.50
Total LL length 0.65±0.65 1.50 97.82
Foot length 0.73±0.56 4.41 96.06
Upper-arm circumference 1.12±0.57 5.75 94.44
Thigh circumference 0.88±0.63 2.68 96.87
Calf circumference 0.88±0.53 4.25 96.55
UL: upper limb; LL: lower limb; AS: affected side; UAS: unaffected side.
the higher the difference in the foot (r=0.48). The older the patient, the higher the percentage of lower upper-arm circumference, whereas the older the patient, the larger the discrepancy (r=0.44).
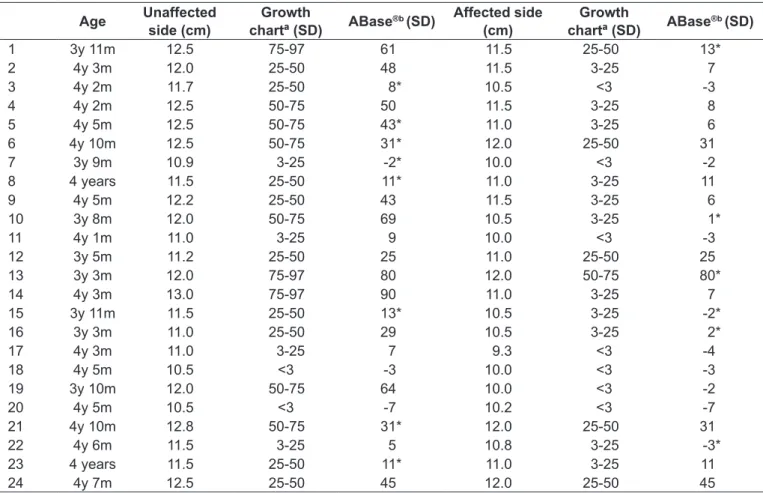
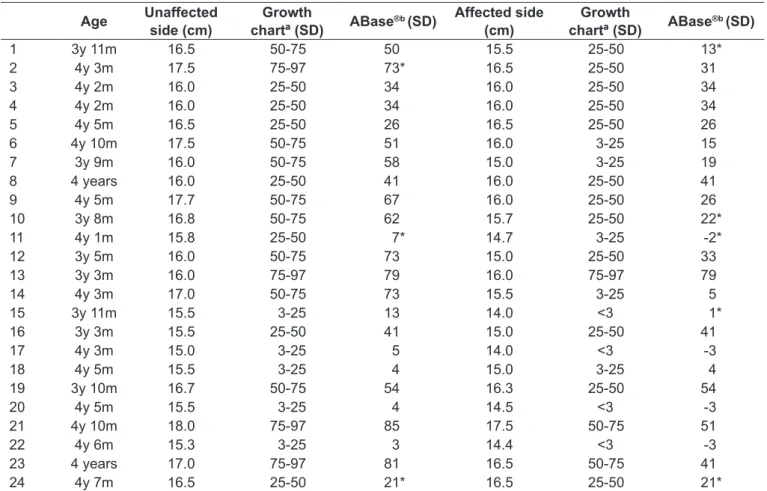
When we compared the data from the growth chart and ABase®, we found divergent results in 32% of the data
related to hand length and in 18% in terms of foot length (Tables 3 and 4). These divergent data show that the
com-puter program ABase® assigned lower values, except for one
Table 3 – Comparison of the values of hand length considering data from the growth chart and from ABase® in all the 24 children
Age Unaffected side (cm)
Growth
chartª (SD) ABase
®b (SD) Affected side
(cm)
Growth
chartª (SD) ABase
®b (SD)
1 3y 11m 12.5 75-97 61 11.5 25-50 13*
2 4y 3m 12.0 25-50 48 11.5 3-25 7
3 4y 2m 11.7 25-50 8* 10.5 <3 -3
4 4y 2m 12.5 50-75 50 11.5 3-25 8
5 4y 5m 12.5 50-75 43* 11.0 3-25 6
6 4y 10m 12.5 50-75 31* 12.0 25-50 31
7 3y 9m 10.9 3-25 -2* 10.0 <3 -2
8 4 years 11.5 25-50 11* 11.0 3-25 11
9 4y 5m 12.2 25-50 43 11.5 3-25 6
10 3y 8m 12.0 50-75 69 10.5 3-25 1*
11 4y 1m 11.0 3-25 9 10.0 <3 -3
12 3y 5m 11.2 25-50 25 11.0 25-50 25
13 3y 3m 12.0 75-97 80 12.0 50-75 80*
14 4y 3m 13.0 75-97 90 11.0 3-25 7
15 3y 11m 11.5 25-50 13* 10.5 3-25 -2*
16 3y 3m 11.0 25-50 29 10.5 3-25 2*
17 4y 3m 11.0 3-25 7 9.3 <3 -4
18 4y 5m 10.5 <3 -3 10.0 <3 -3
19 3y 10m 12.0 50-75 64 10.0 <3 -2
20 4y 5m 10.5 <3 -7 10.2 <3 -7
21 4y 10m 12.8 50-75 31* 12.0 25-50 31
22 4y 6m 11.5 3-25 5 10.8 3-25 -3*
23 4 years 11.5 25-50 11* 11.0 3-25 11
24 4y 7m 12.5 25-50 45 12.0 25-50 45
*Divergent data between both reference methods; ª comparison with data by Feingold(17); bdata from the computer program ABase® in text format, based on data by Freeman et al(19).
Discussion
Growth is an essential aspect of child development,
be-ing a marker of health and well-bebe-ing(24). Abnormal growth
between the two sides of the body in children with hemi-plegic CP is used as a model for the study of the inluence of non-nutritional factors on growth. The fact that each child is her/his own control makes it possible to rule out factors such as malnutrition, endocrinological aspects, gender, race, parents’ mean height, and puberty stage(5).
Since there is no signiicant difference between the both sides of the normal child’s body, which was previously dem-onstrated by Demir et al(16), in the present study, we used the unaffected side in comparison with the affected side in
children with hemiplegic CP, as described by Stevensen et
al(5) and Van Heest et al(25), who also included both sexes in the same sample. Disorders in the linear or speciic growth of limbs of children with CP and head circumference can be measured and compared with reference values for the general population.
Although anthropometry is the technique of choice to assess dimorphisms in children, in the clinical practice, it has been seldom used. The fact of being time-consuming and the occasional lack of appropriate charts for the several body measures may explain its rare use. The computer program ABase®(13) was designed with the purpose of minimizing this problem. In the present study, we compared the ind-ings resulting from the use of both methods, growth charts
and ABase®, and some differences were detected. Growth
charts provide ranges of values for the classiication of the
patient’s measures, while ABase®, used in the text format,
provides a speciic value. We found differences regarding the results provided by both reference methods, since ap-proximately one fourth of results showed divergent data
between the information provided by ABase® and the growth
curve. The fact that ABase® uses the European population as
the measures of both sides of the body. On the other hand, depending on the objective of the anthropometric assess-ment, tools such as the computer program ABase® make assessment simpler, mainly in terms of time consumption. The fact that the results obtained from these two reference methods are not interchangeable suggests that the choice of the reference method should be previously made and used for all assessments.
Holt(26) analyzed the growth of 50 children with
hemi-plegia and found that they tended to have lower weight and height in comparison with the population mean, while Maekawa et al, cited by Uvebrant(11), did not ind this trend. In our sample, the mean values were within the normal range, although three patients had weight and height deicit, which was not related to nutritional factors, and
these cases are currently being investigated. Uvebrant(11)
analyzed 169 children with hemiplegia and found that weight and height means were not signiicantly different from the normal values either. The data of the present study are in agreement with the absence of difference in
the linear growth of these children in comparison with the normal population.
It is possible that one of the factors that stimulates linear growth in patients with hemiplegia is the possibility of a motor performance close to the normal. The mean score on the GMFM (93%) in the present sample suggested motor ability very similar to normal performance, considering that the expected result in this scale is that 5-year-old normal children are able to complete 100% of the items. Studies have demonstrated the beneit of physical activity in terms of
growth and development stimulation(27), while other studies
have considered that the severity of the growth disorder in CP could also be related to physical activity limitation(4).
The study by Ibrahim and Hawamdeh(8) associated a more
adequate growth in CP with better motor function and demonstrated lower impairment in the hemiplegic children compared to the diplegic and quadriplegic children. The fact that the children included in our study had a motor function similar to normal suggests that they are also highly prone to have more adequate social participation and health
indica-Table 4 – Comparison of the values of foot length considering data from the growth chart and from ABase® in all the 24 children
Age Unaffected side (cm)
Growth
chartª (SD) ABase
®b (SD) Affected side
(cm)
Growth
chartª (SD) ABase
®b (SD)
1 3y 11m 16.5 50-75 50 15.5 25-50 13*
2 4y 3m 17.5 75-97 73* 16.5 25-50 31
3 4y 2m 16.0 25-50 34 16.0 25-50 34
4 4y 2m 16.0 25-50 34 16.0 25-50 34
5 4y 5m 16.5 25-50 26 16.5 25-50 26
6 4y 10m 17.5 50-75 51 16.0 3-25 15
7 3y 9m 16.0 50-75 58 15.0 3-25 19
8 4 years 16.0 25-50 41 16.0 25-50 41
9 4y 5m 17.7 50-75 67 16.0 25-50 26
10 3y 8m 16.8 50-75 62 15.7 25-50 22*
11 4y 1m 15.8 25-50 7* 14.7 3-25 -2*
12 3y 5m 16.0 50-75 73 15.0 25-50 33
13 3y 3m 16.0 75-97 79 16.0 75-97 79
14 4y 3m 17.0 50-75 73 15.5 3-25 5
15 3y 11m 15.5 3-25 13 14.0 <3 1*
16 3y 3m 15.5 25-50 41 15.0 25-50 41
17 4y 3m 15.0 3-25 5 14.0 <3 -3
18 4y 5m 15.5 3-25 4 15.0 3-25 4
19 3y 10m 16.7 50-75 54 16.3 25-50 54
20 4y 5m 15.5 3-25 4 14.5 <3 -3
21 4y 10m 18.0 75-97 85 17.5 50-75 51
22 4y 6m 15.3 3-25 3 14.4 <3 -3
23 4 years 17.0 75-97 81 16.5 50-75 41
24 4y 7m 16.5 25-50 21* 16.5 25-50 21*
tors than children with CP who have more severe growth disorders, as demonstrated by Stevensen et al(24).
Head circumference, which is one of the most important measures during childhood, relects the intracranial volume of the brain under development. The presence of discrepancy in its proportion may suggest pathological processes(15). In the present study, 21% of the patients had microcephaly. Stewart (1948), cited by Uvebrant(11), found small head cir-cumference in almost all cases of hemiplegia investigated in his study, which was not corroborated by our indings and by Uvebrant’s results(11), who found that 15% of the subjects had head circumference measures lower than -2 SD. Recently,
Ibrahim and Hawamdeh(8) found a signiicant decrease in the
head circumference of hemiplegic girls.
Few studies have attempted to associate microcephaly
and cognitive function. The WIPPSI-R test(23) used in the
present study to assess cognitive function is approved by the Federal Council of Psychology to be used with this age group. This test has been used for some years at the outpa-tient clinic for newborns at risk of Hospital de Clínicas of UFPR, detecting an intelligence quotient < 80 in 5-year-old children who failed the Denver II test twice or more at 2 years old, with sensitivity and speciicity of 70%(28). In the present study, there was not correlation between cognitive
function and head circumference. Uvebrant(11), on the other
hand, found that children with head circumference < -2 SD had an increase of 55% in the incidence of mental retarda-tion, whereas those with head circumference > -2 SD had an increase of only 21%.
Compared to the normal height and weight, the asym-metry of growth between the both sides of the body of children with hemiplegia was evident, and the affected side was smaller and shorter in terms of length, width
and circumference, which was also found by Stevensen et
al(5). Uvebrant(11) found hypertrophy in 96% of the cases
and frequent growth disorder in the affected limbs, with mean discrepancy of 15mm in the upper limb and 6mm in the lower limb. In the present study, these means were
12.2mm and 6.5mm, respectively. Holt(26) found that 20%
of the hemiparetic children had a percentage of >2.5% of shorter affected legs, which represented 20mm; 62% had <20mm of shorter measures, and 18% did not have
shorter measures. In the study by Uvebrant(11), these
ind-ings were 13%, 75%, and 12%, respectively, and, in our sample, the values were 8%, 50%, and 42%. Comparing the data of the present study with those provided by the above mentioned studies, we found that in the present
sample the shortness of the arm was also more signiicant than the shortness of the leg.
The higher disproportion between both sides of the body in hemiplegia would be related to the hand and the foot(10); however, in the present study, the higher disproportion was observed in terms of palm length and width, followed by upper-arm circumference, which is in agreement with Tizard et al(29).
There is controversy on the relation between discrepancy in the growth of the affected side and age(5,16,24). In the present study, the mean age was younger and more homogeneous if compared to the mean age of the subjects included in the stud-ies that investigated the relation between growth discrepancy in the affected side and age(5,16,24); even though, we found that the older the age, the higher the percentage of decrease in the circumference of the affected upper-arm. This reinforces the term used by Tizard et al(29), “undergrowth,” since the process of lower growth is related to the dificulty to grow instead of being related to a retrogression. Even if later there is worsening due to lack of activity, the lower measure of the limbs occurs early during the growth process. In the normal develop-ment, growth of different parts of the body occurs according to a predicted and proportional process(15). The relationship found between the measures of the upper and lower limb of the affected side suggests that there is a natural trend to the proportional growth of this side, even when there is evident asymmetry regarding the unaffected side.
1. World Health Organization, WHO. International classiication of function and
disability, beta-2 version. Geneva; 1999.
2. Shapiro BK, Green P, Krick J, Allen D, Capute AJ. Growth of severely impaired children: neurological versus nutritional factors. Dev Med Child Neurol 1986;28:729-33.
3. Rotta NT. Cerebral palsy, new therapeutic possibilities. J Pediatr (Rio J) 2002;78:S48-54.
4. Stallings VA, Charney EB, Davies JC, Cronk CE. Nutrition-related growth failure of children with quadriplegic cerebral palsy. Dev Med Child Neurol 1993;35:126-38.
5. Stevenson RD, Roberts CD, Vogtle L. The effects of non-nutritional factors on growth in cerebral palsy. Dev Med Child Neurol 1995;37:124-30.
6. Pryor HB, Thelander HE. Growth deviations in handicapped children. An anthopometric study. Clin Pediatr (Phila) 1967;6:501-12.
7. Tobis JS, Saturen P, Larios G, Posniak AO. Study of growth patterns in cerebral palsy. Arch Phys Med Rehabil 1961;42:475-81.
8. Ibrahim AI, Hawamdeh ZM. Evaluation of physical growth in cerebral palsied children and its possible relationship with gross motor development. Int J Rehabil Res 2007;30:47-54.
9. Pellegrino L, Dormans JP. Deinitions, etiology and epidemiology of cerebral
palsy. In: Dormans JP, Pellegrino L, editors. Caring for children with cerebral palsy. Baltimore: Paul H Brooks; 1998. p. 3-30.
10. Swaiman KF, Wu Y. Cerebral palsy. In: Swaiman KF, Ashwal S, Ferriero DM, editors. Pediatric neurology: principles & practice, volume 2. Philadelphia: Mosby Elsevier; 2006. p. 491-504.
11. Uvebrant P. Hemiplegic cerebral palsy. Aetiology and outcome. Acta Paediatr Scand 1988;345:1-100.
12. Roberts CD, Vogtle L, Stevenson RD. Effect of hemiplegia on skeletal maturation. J Pediatr 1994;125:824-8.
13. Zankl A. Computer-aided anthropometry in the evaluation of dysmorphic children. Pediatrics 2004;e114:333-6.
14. Palisano R, Rosenbaum P, Walters S, Russell D, Wood E, Galuppi B. Development and reliability of a system to classify gross motor function in children with cerebral palsy. Dev Med Child Neurol 1997;39:214-23. 15. Hall JG, Froster-Iskenius UG, Allanson JE. A handbook of normal physical
measurements. Oxford: Oxford Medical Publications; 1989.
References
16. Demir SO, Oktay F, Uysal H, Seluk B. Upper extremity shortness in children with hemiplegic cerebral palsy. J Pediatr Orthop 2006;26:764-8.
17. Feingold M, Bossert WH. Normal values for selected physical parameters: an aid to syndrome delineation. Birth Defects Orig Artic Ser 1974;10:1-16. 18. Blais MM, Green WT, Anderson M. Lengths of the growing foot. J Bone Joint
Surg 1956;38:998-1000.
19. Freeman JV, Cole TJ, Chinn S, Jones PR, White EM, Preece MA. Cross sectional stature and weight reference curves for the UK, 1990. Arch Dis Child 1995;73:17-24.
20. Russell DJ, Rosenbaum PL, Cadman DT, Gowland C, Hardy S, Jarvis S. The gross motor function measure: a means to evaluate the effects of physical therapy. Dev Med Child Neurol 1989;31:341-52.
21. Bjornson KF, Graubert CS, Buford VL, McLaughlin J. Validity of the gross motor function measure. Pediatr Phys Ther 1998;10:43-7.
22. Cury VC, Mancini MC, Melo AP, Fonseca ST, Sampaio RF, Tirado MG. The effects of the use of orthoses on the functional mobility of children with cerebral palsy. Rev Bras Fisioter 2006;10:67-74.
23. Wechsler D. Wechsler preschool and primary scale of intelligence – revised. San Antonio: The Psychological Corporation; 1989.
24. Stevenson RD, Conaway M, Chumlea WC, Rosenbaum P, Fung EB, Henderson RC et al. Growth and health in children with moderate-to-severe cerebral palsy. Pediatrics 2006;118:1010-8.
25. van Heest AE, House J, Putnam M. Sensibility deiciencies in the hands of
children with spastic hemiplegia. J Hand Surg (Am) 1993;18:278-81. 26. Holt KS. Growth disturbances. In: Bax M, editor. Hemiplegic cerebral palsy in
children and adults. London: Heinemann; 1961. p. 39-53.
27. Alves C, Lima RV. Linear growth and puberty in children and adolescents: effects of physical activity and sports. Rev Paul Pediatr 2008;26:383-91. 28. Bruck I, Antoniuk S, Santos LC. Avaliação aos dois anos prevê desenvolvimento
neuropsicomotor aos cinco anos? 1º Congresso Brasileiro de Neurologia Infantil; 2003, agosto 15-17; São Paulo, Brasil. p.33.
29. Tizard JP, Paine RS, Crothers B. Disturbances of sensation in children with hemiplegia. J Am Med Assoc 1954;155:628-32.
30. Stevensen RD, Hayes RP, Cater LV, Blackman JA. Clinical correlates of linear growth in children with cerebral palsy. Dev Med Child Neurol 1994;36: 135-42.
hemiplegic CP, as well as investigation of the factors that may stimulate a better growth of the affected side and the inluence on the physical therapy treatment.
The inclusion of ive preterm children may be called into question; however, there are not studies comparing these data in preterm children, either adequate or small for gestational age. Further studies involving a larger number of preterm patients are necessary to corroborate these indings.
In conclusion, we can assume that the most frequent growth disorders in children with hemiplegic CP are related
to the discrepancy between both sides of the body and head circumference, without any alterations in the linear growth. The discrepancy between both sides of the body was evident, being more signiicant in terms of palm width and length, and 21% of the patients had microcephaly, which was not related to the cognitive function. The reference values of normality used in the present study, growth charts and
ABase®, were not interchangeable; therefore, pediatricians