Per d a s n a v i sã o d e cor es em p a ci en t es t r a t a d os com cl or oq u i n a
1 Departamento de Psicologia Experimental, Instituto de Psicologia e Núcleo de Neurociências e Comportamen-to, Universidade de São Paulo, São Paulo, Brasil; 2 Departamento de Fisiologia, Centro de Ciências Biológi-cas, Universidade Federal do Pará, Belém, Brasil; 3 Hospi-tal Universitário, Universidade de São Paulo, São Paulo, Brasil; 4 Departamento de Oftalmologia, Escola Paulista de Medicina, Universidade Federal de São Paulo, São Paulo, Brasil; 5 Departamento de Medicina Integrada II, Centro de Ciências da Saúde, Universidade Federal do Pará, Belém, Brasil.
Correspondence concerning this article should be addres-sed to Dora Fix Ventura - Av. Prof. Mello Moraes, 1721 CEP 05508-900, São Paulo, SP, Brasil (email: [email protected]); phone: 11-3091-4444 x223 / Fax: 11-3091-4357.
D or a F . V en t u r a1 L u i z Ca r l o s L . Si l v ei r a2 M a u r o N i sh i3, 4
M a r cel o F . Co st a1 M i r el l a Gu a l t i er i1 R u t h M . A . d o s Sa n t o s2 Ca r o l i n a T . P i n t o2 A n a L a u r a A . d e M o u r a2 A n d er so n R . R o d r i gu es2 Cl au d i o Sak u r ad a3
M a r i a d e F á t i m a L . C. Sa u m a5 J o h n M . d e So u z a1
I N T R O D U CT I O N
The neurotoxic effect of some therapeutic drugs is well established(1-2). Treatment with 4-aminoquinoline derivatives - chloroquine or hydroxy-chloroquine- prescribed for rheumatoid arthritis, lupus erithromatosus or
A BST R A CT
Keywords: Chloroquine; Retinopathy; Color vision; Contrast sensitivity; Neurotoxicology,
Neurobehavioral test battery; Dyschromatopsia
malaria, may be accompanied by ocular toxicity that produces a loss of paracentral visual fields, which may develop, in later stages, an annular scotoma. These visual field abnormalities are related with some characteristic ophthalmic findings that include loss of the foveal reflex, with irregular and increased pigmentation in the macula. A ring of depigmentation surroun-ded by mild increased pigmentation eventually develops, resembling a bull’s eye or target. The electroretinogram may show an enlarged a wave or a reduced b wave, and the electro-oculogram may be depressed. These findings may even be present before ophthalmoscopic changes appear and may be accompanied by alterations in color vision(3).
The first report of probable ocular toxicity was by Cambiag-gi in 1957(4), when he reported on an unusual retinopathy seen in a patient with systemic lupus erythematosus who was taking chloroquine. However, he did not associate this retinopathy with the use of chloroquine. In 1959, Hobbs and colleagues(5) made the first association of retinopathy with the use of chloro-quine. In the early 1960s there were many reports of chloroquine retinopathy, with most patients taking daily doses averaging 500 mg and total doses sometimes exceeding 1000 g. Initial review of these data(6-9) suggested that retinopathy was rare if the total dose of chloroquine was less than 100 g.
These symptoms are probably due to retinal degeneration, reported in 0.5 to 3.5% of patients treated with hydroxichloro-quine(10-11) and in 10-25% of patients treated with chloro-quine(12).
The retinal degeneration that occurs in chloroquine retino-pathy is a cone-rod dysfunction ophthalmoscopically detec-ted in its advanced stages as a bull’s eye lesion, usually affecting both eyes, although it may be found unilaterally(13). As a rule, long term use of chloroquine increases the risk and severity of retinopathy in a cumulative fashion, related to the total amount of drug taken. However, there are cases of retinopathy with minimal doses(9,14-15) as well as lack of toxicity in massive doses(16). A recent report associating early suscep-tibility with mutations in the ABCR (ABCR4) gene led to the
suggestion of a relationship between retinal toxicity by 4-ami-noquinoline derivatives and Stargardt’s disease(17). Detection of such susceptibility should constitute a recommendation for careful monitoring of visual function and retinal integrity during drug treatment.
In an effort to achieve early diagnosis of retinal damage, the present work evaluates visual impairment in non-retinopa-thic users of chloroquine or hydroxichloroquine, with sensi-tive quantitasensi-tive methods of assessment of color discrimina-tion and contrast sensitivity. In a joint study of the University of São Paulo (USP), in São Paulo, and of the Federal University of Pará (UFPA), in Belém, we evaluated patient’s color dis-crimination thresholds using the Cambridge Color Test (CCT)(18-21), color discrimination performance in arrangement tests using the Farnsworth-Munsell 100 Hue (FM100), the Farnsworth-Munsell D15, and the Lanthony desaturated tests(1-22); and patient’s contrast sensitivity for black-and-white sine wave grating.
M ET H O D S
Subjects
We studied patients that make use of chloroquine for the treament of rheumatic diseases but, at the same time, had no ophthalmoscopic signs of retinopathy. Patients were referred by rheumatologists in both centers. All patients were submit-ted to an ophthalmological examination that included evalua-tion of corrected visual acuity, biomicroscopy, tonometry and indirect ophthalmoscopy. Patients with any finding that would be related to chloroquine retinopathy or other ophthal-mological pathology were excluded from the present study. Informed consent was obtained from all subjects, in accordan-ce with the Declaration of Helsinki determinations.
Patients were tested in São Paulo (n=10; aged 38 to 71 years; mean=55.8 years) and Belém (n=22; aged 20 to 67; mean=40 years). The prescribed accumulated chloroquine dose was 45 a 430 g (mean=213 g; sd=152 g) for the São Paulo group and 36 to 540 g (mean= 174 g; sd=183 g) for the Belém group.
Equipment
The São Paulo group used commercial version of all tests. The Cambridge Colour Test, CCT v2.0, with VSG 5 card and Sony FD Trinitron colour monitor, was purchased from Cam-bridge Research Instruments, England. The arrangement tests were the Farnsworth Munsell 100 Hue and D15 tests (Gretag Macbeth, N.Y.) and the Lanthony Desaturated test (D15-d Luneau Ophtalmologie, Chartres, France). The Belém group used a self-built system. The software was written using C++ programming language, OFS/Motif 1.1, AIX-Windows R4, and IBM-GL graphic library, all for AIX 3.2.x environment. The software was developed for IBM POWERStation RISC 6000. The stimuli were displayed in IBM 6091 19i colour monitors, 1280 x 1024 pixels, 81.32 kHz horizontal refresh rate, 77 Hz vertical frame rate. They were generated by using IBM GT4-3D graphic adapters, 24 bits / 8 bits per gun. A dithering routine was used to obtain 10 bits grey level resolution. The software was developed by C. R. Botelho-de-Souza (luminan-ce contrast sensitivity test), A. M. Braga (FM100) and author ARR (CCT, FM100).
Procedure
All tests were performed with All tests were performed with spectacles to correct any refractive error.
Cambridge Colour Test
Ellipse 2; Field 3: 0.242, 0.463 for Ellipse 3. These CIE (Com-mission Internationale d’Éclairage) chromaticities constituted the background colour against which hues corresponding to equally spaced vectors were tested(21) (Figures 1 and 2).
The CCT used the staircase psychophysical method to measure threshold discrimination, presenting two staircases in random alternation. In each staircase testing began with a saturated hue and proceeded to a less saturated hue every time the subject answered correctly, with a maximum excursion of 0.110 u’v’ units and a minimum excursion of 0.002 u’v’ units in this space. Reversibly, incorrect responses or no responses are followed by presentation of hues with higher saturation value. Step size is halved or doubled, following respectively correct or incorrect responses. After a criterion of 6 incorrect responses or 6 reversals, the series is terminated and a thre-shold is computed. In succession, testing on a new pair of hues is begun. The results are expressed in u’v’ coordinates in CIE colour space.
Arrangement Tests
The arrangement tests were used by the São Paulo group in their original formats, according with the test’s instruc-tions, with the specified illumination provided by a fluores-cent lamp (Sylvania mod. Octron 6500K FO 32W) in an other-wise darkened room. This procedure was followed in the appli-cation of the FM100, D15 and Lanthony Desaturated tests.
The Belém group used a locally made computerized ver-sion of the FM100. The general procedure is the same as in the commercial version, but all measurements were repeated four times and the results were presented as mean and standard deviation for each data point.
Contrast Sensitivity
The contrast sensitivity was evaluated only in the Belém group of patients. Achromatic contrast sensitivity was mea-sured monocularly, both eyes being alternately tested, at ele-ven spatial frequencies, ranging from 0.2 to 30 cycles / degree. The stimuli consisted of stationary, black-and-white, vertical sine-wave gratings, with a mean luminance of 188 cd/m2, pla-ced at 3 m, subtending 6.5 x 5 degrees. Each measurement was repeated six times and the mean value was taken as represen-tative of contrast sensitivity.
R ESU L T S
All patients presented normal ophthalmological exams with corrected visual acuity of 20/20. No patient was excluded from the present study. In São Paulo, all patients were evalua-ted in every test. In Belém, all patients were tesevalua-ted in the FM100, but only 5 patients were tested in the CCT.
Nine of the 10 patients tested in São Paulo and 15 of the 22 tested in Belém, presented acquired dyschromatopsia revea-led by the CCT and/or by the arrangement tests – the FM 100 and Lanthony. The D15 test was not sensitive enough to of 100x10-3 u’v’ units in either the deutan or protan axis or
150x10-3 u’v’ units in the tritan axis were excluded.
The Trivector was followed by a longer procedure, the MacAdam Ellipses protocol. Eight-vector or twenty-vector ellipses were determined in the São Paulo and Belém laborato-ries, respectively, for all subjects that passed the Trivector protocol. The u’v’ coordinates for the center of the three ellipses lied along the protan-deutan axis (Tritanopic set) and were: Field 1: 0.197, 0.469 for Ellipse 1; Field 2: 0.158,0.473 for
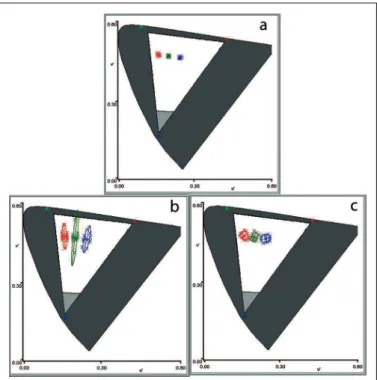
Figure 1 – MacAdam’s ellipses measured by the Cambridge Colour Test. Results for a control subject (a), a chloroquine treated patient showing tritan loss (b), and a chloroquine treated patient with diffuse loss (c)
Figure 2 – Average ellipse area for the three fields tested for the worst eye and best eye of chloroquine treated patients and for age-matched
reveal losses in these patients. Since previous work on norms for the CCT (Ventura et al., in press) showed no statistical difference between the ellipse parameters obtained in the São Paulo and Belém setups in normal subjects, all results were grouped. The same was true for the data from the FM 100.
The MacAdam´s Ellipses Test
Figure 1 shows the CIE 1976 u’v’ color space representa-tion containing MacAdam’s ellipses around three chromatici-ties for two chloroquine treated patients and for an age-mat-ched control subject. The central point in each ellipse repre-sents the background chromaticity and each data point (cros-ses) is a color discrimination threshold, between the back-ground color and one of the tested colors. The tested colors ranged from red to violet. The resulting ellipse is represented by the interpolated line. The shape of the ellipses obtained reveals the type of colour vision loss. Horizontal ellipses tilted towards the red or green vertices of the color triangle in the diagram correspond to protan or deutan losses, respectively, while ellipses pointing to the blue extremity correspond to tritan losses. A diffuse loss increases the ellipse in all directions.
MacAdam’s ellipses obtained in patients treated with chloroquine were enlarged in comparison with those mea-sured in age-matched controls (Figures 1 and 2). The patholo-gic changes were either tritanopic (6/10 in São Paulo and 2/5 in Belém) or diffuse (3/10 in São Paulo and 3/5 in Belém) and the average ellipse areas were asymmetric for fellow eyes. Total ellipse area from the worst eyes, regardless of shape, showed a statistically significant difference between chloroquine trea-ted patients and controls for Fields 2 and 3 (p = 0.041 and p = 0.046, respectively) but not for Field 1 (p = 0.14). No significant difference was observed when the best eyes from the chlro-quine treated group were compared to the control.
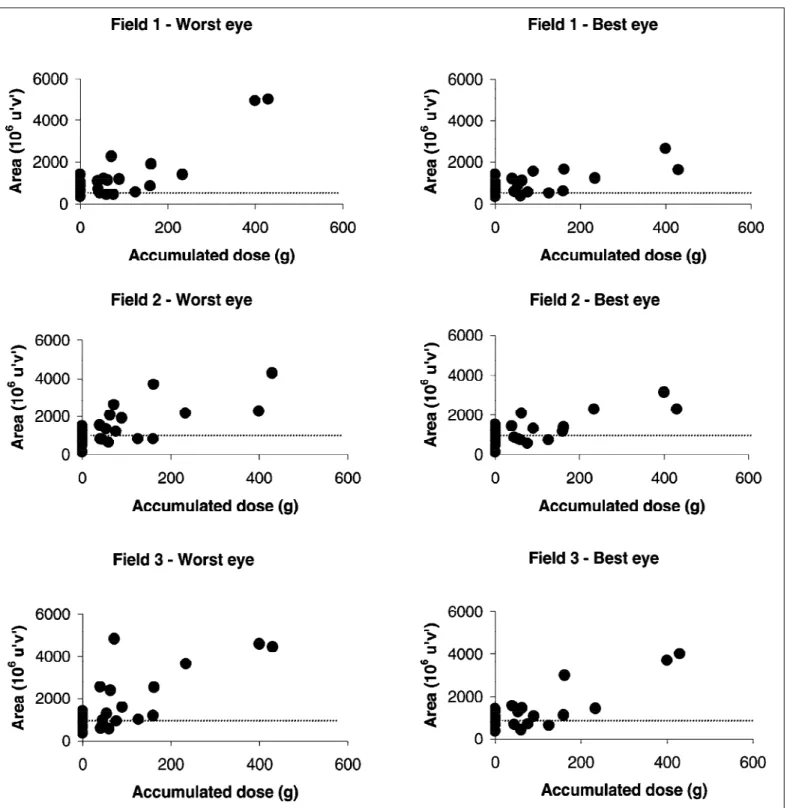
The large variability in these data is related to the fact that the patients had different levels of accumulated dose of chlo-roquine. In fact, accumulated dose of chloroquine was highly positively correlated with ellipse area, especially in Field 3, which is closer to the blue end of the colour space (Figure 3).
Arrangement Tests
Typical results for the FM100 Test are shown in Figure 4 for a control subject and for two chloroquine treated patients, one with diffuse loss, the other with a light tritan loss. The numbers in the periphery of the graph correspond to the Munsell colors that are ordered in the test. The radial plot shows the magnitude of each error that was made when arran-ging the colours sequentially. Error magnitude indicates the distance between each colour and the next one. A test result with no errors is represented by a radial plot that constitutes a perfect circle. Errors made by subjects with protan, deutan and tritan deficiencies fall along the respective confusion lines.
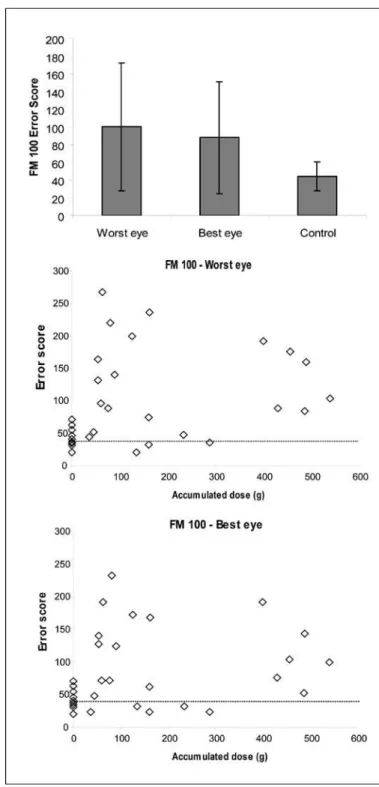
The average error score for the FM100 test was higher in the chloroquine treated patients than in the age-matched con-trols and it was different between the two eyes (Figure 5a).
The FM100 error score was worse even after the first few doses of chloroquine for both the best and worst eyes in all patients (Figure 5b and 5c). The best eye results were statisti-cally different from the controls (p = 0.013). Twenty four pa-tients showed pathologic changes in the FM100, either trita-nopic (5/22 in Belém) or diffuse (9/10 in São Paulo and 10/22 in Belém). However, three patients from the Belém group that scored within the normal range in the FM100, showed tritano-pic (2 patients) or diffuse (1 patient) losses in the CCT.
In an attempt to compare the FM100 results with those from the CCT, the ellipse area was plotted against the FM100 error score. The result showed no statistically significant cor-relation.
The Lanthony test revealed losses in three out of seven patients, while the D15 showed loss in only one of these patients.
Contrast sensitivity
Contrast sensitivity was unaffected by the chloroquine treatment in the patients in which this visual funcation was evaluated. However, since the group tested in Belém received a lower accumulated dose of chloroquine, a loss in contrast sensitivity is not excluded for higher accumulated doses.
Comparison between test results
The results obtained with the CCT showed that, among chloroquine treated patients, there were cases of selective tritanopic colour vision loss (6/10 in São Paulo and 5/22 in Belém) and of diffuse loss (3/10 in São Paulo and 10/22 in Belém). Although losses were also present in the FM100, there was no statistically significant correlation between the FM100 error score and the ellipse area measured by the CCT. The Lanthony desaturated test was more sensitive and closer to the CCT than the FM100 in the indication of losses. The D15 was not sensitive enough to show these losses. Contrast sensitivity was within normal values for all patients. The ex-tent of the losses in colour discrimination was positively cor-related with the accumulated dose.
D I SCU SSI O N
Figure 3 – Relationship between accumulated prescribed dose of chloroquine in grams and ellipse area at the three fields measured, for the worst and best eyes. Each data point is the result of one patient. Age-matched control results are plotted at the zero dose level point. The dashed horizontal
line represents the median ellipse area of the control group
least sensitive test, having failed to indicate loss in 9 out of 10 patients. Further work with a larger number of patients is in progress to strengthen and broaden these comparisons.
The finding that in some patients functional changes are associated with very small doses of chloroquine suggests
that these cases correspond to the early susceptibility descri-bed by several authors(9,14-15) and it would be important to find out if these patients have mutations in the ABCR (ABCR4)
Figure 4 – FM 100 results for an age-matched control subject (a) and two chloroquine treated patients, one showing diffuse (b) and the other
tritanopic losses (c)
Figure 5 – (a) Average FM 100 error score for the worst eye and the best eyes and for the age-matched controls. (b and c) Relationship between FM 100 error score and accumulated dose for the worst and best eyes, respectively. Each data point is the result of one patient. Age-matched control results are plotted at the zero dose level point. The dashed horizontal line represents the median error score for the control group
procedure and provides quantitative data that can be directly interpreted in CIE colour space, while the FM100 is a test that is influenced by training and by other subjective factors.
R ESU M O
Pacientes que fazem uso de cloroquina ou hidróxi-cloroquina, drogas que são freqüentemente administradas para o trata-mento de artrite reumatóide, lúpus eritrematoso ou malária, podem sofrer alterações na visão de cores e na sensibilidade de contraste. O presente estudo avaliou a função visual des-tes paciendes-tes em um estudo conjunto da Universidade de São Paulo (USP), em São Paulo, e da Universidade Federal do Pará (UFPA), em Belém. Trinta e dois pacientes usuários de cloro-quina sem alterações no exame de fundo de olho foram avalia-dos em São Paulo (n=10, 38 a 71 anos, média=55,8 anos) e em Belém (n=22, 20 a 67 anos, média=40 anos). A dose acumulada de cloroquina prescrita foi de 45 a 430 g (média=213 g; dp=152 g) para o grupo de São Paulo, e de 36 a 540 g (média=174 g; dp=183 g) para o grupo de Belém. Os testes foram realizados monocularmente com o estado refracional corrigido. A discri-minação de cor foi avaliada utilizando o Teste de Cor de Cambridge (CCT): o limiar de discriminação de cor foi mensu-rado primeiro nos eixos protano, deutano e tritano, e em se-qüência, três elipses de MacAdam foram determinadas. A visão de cores dos pacientes também foi avaliada com testes de arranjo de cores: o teste de 100 matizes de Farnsworth-Munsell (FM100), o D15 de Farnsworth-Farnsworth-Munsell, e o teste Lanthony Dessaturado (D15d). A sensibilidade de contraste foi também medida com grades senoidais preto-e-brancas em 22 pacientes. Os resultados foram comparados com controles sem patologias oftalmológicasou neuro-oftalomológicas. 24 pacientes apresentaram discromatopsia adquirida, com perdas seletivas (11 pessoas) ou difusas (13 pessoas). Embora as perdas estivessem presentes no FM100, não houve correlação entre o escore de erro do FM100 e a área elíptica medida pelo CCT. Além disso, três pacientes que tiveram escores normais no FM100 falharam para alcançar limiares normais no CCT. O teste de Lanthony foi menos sensível do que os outros dois testes, tal que falhou em indicar perda em cerca de metade dos pacientes afetados, e o D15 foi o teste menos sensível, deixan-do de indicar déficits em 9 de 10 pacientes. A sensibilidade de contraste esteve dentro dos valores normais para pacientes submetidos a este teste. A extensão das perdas na discrimina-ção de cores foi positivamente correlacionada com a dose acumulada. O CCT é recomendado para o acompanhamento destes pacientes, pois forneceu dados quantitativos que po-dem ser diretamente interpretados no espaço cromático da CIE (Commission Internationelle d’Éclairage).
Descritores: Cloroquina; Retinopatia; Visão de cores; Sensi-bilidade de contraste; Neurotoxicologia; Bateria de testes neurocomportamentais; Discromatopsia
A CK N O W L ED GEM EN T S
This work was supported by FAPESP # 0030/00-98, FINEP #66.95.0407.00, CNPq #523303/95-5 and CAPES-PROCAD grants to D.F.V.; FINEP-PNOPG #090/00-99, FINEP/CNPq-PRONEX, CNPq-PNOPG #550663/2001-0, and CNPq #521640/ 96-2, CAPES-RENOR, IBM and UFPA-PROINT #372/2001 grants to L.C.L.S. D.F.V., L.C.L.S., and J.M.S. are CNPq research fellows. M.F.C. and A.R.R. have graduate fel-lowships from CAPES, whilst M.G., R.M.A.S., C.T.P. and A.L.A.M. have undergraduate fellowship from CNPq. We thank Claudiel Luiz dos Santos and Jocely Costa Barata for administrative assistance.
R EF ER EN CES
1. Birch J. Diagnosis of Defective Color Vision. New York: Oxford University Press, 1993.
2. Pokorny J, Smith VC, Verriest G, Pinckers AJLG. Congenital and Acquired Color Vision Defects. New York: Grune & Stratton, 1979.
3. Easterbrook M. Detection and prevention of maculopathy associated with antimalarial agents. Int Ophthalmol Clin 1999;39:49-57.
4. Cambiaggi A. Unusual ocular lesions in a case of systemic lupus erythemato-sus. Arch Ophthalmol 1957;57:451.
5. Hobbs HE, Sorsby A, Freedman A. Retinopathy following chloroquine thera-py. Lancet 1959;2:478.
6. Hobbs HE, Eadie SP, Somerville F. Ocular lesions after treatment with chloroquine. Brit J Ophthalmol 1961;45:284.
7. Hendkind P, Rothfield NF. Ocular abnormalities in patients treated with synthetic antimalarial drugs. N Engl J Med 1963;269:433.
8. Arden GB, Kolb H. Antimalarial therapy and early retinal changes in patients with rheumatoid arthritis. Brit Med J 1966;5482:270.
9. Nylander U. Ocular damage in chloroquine therapy. Acta Ophthalmol Scand 1966;44:335-48.
10. Levy GD, Munz SJ, Paschal J, et al. Incidence of hydroxychloroquine retino-pathy in 1,207 patients in a large multicenter outpatient practice. Arthritis Rheum 1997;40:1482-6.
11. Mavrikakis M, Papazoglou S, Sfikakis PP, et al. Retinal toxicity in long term hydroxychloroquine treatment. Ann Rheum Dis 1996;55:187-9. 12. Finbloom DS, Silver K, Newsome DA, Gunkel R. Comparison of
hydroxy-chloroquine and hydroxy-chloroquine use and the development of retinal toxicity. J Rheumatol 1985;12:692-4.
13. Nomura R, Kondo M, Tanikawa A, Yamamoto N. Unilateral cone dysfunc-tion with bull’s eye maculopathy. Ophthalmology 2001;108(1):49-53. 14. Voipio H. Incidence of chloroquine retinopathy. Acta Ophthalmol Scand
1966;44:349-54.
15. Silman A, Shipley M. Ophthalmological monitoring for hydroxychloroquine toxicity: a scientific review of available data. Brit J Rheumatol 1997;36:599-601. 16. Johnson MW, Vine AK. Hydroxychloroquine therapy in massive total doses
without retinal toxicity. Am J Ophthalmol 1987;104:139-44.
17. Shroyer NF, Richard AL, Lupski JR. Analysis of the ABCR (ABCA4) gene in 4-Aminoquinoline retinopathy: is retinal toxicity by chloroquine and hydroxych-loroquine related to Stargardt disease? Am J Ophthalmol 2001; 131(6):761-6. 18. Mollon JD, Reffin JP. A computer-controlled colour vision test that combines
the principles of Chibret and Stilling. J Physiol 1989;41(4):5.
19. Mollon JD, Reffin J P. Handbook of the Cambridge Colour Test. London:
Cambridge Research Systems (www.crsltd.com), 2000.
20. Reffin JP, Astell S, Mollon JD. Trials of a computer-controlled colour vision test that preserves the advantages of pseudoisochromatic plates. In: Drum B, Moreland JD, Serra A, editors, Colour Vision Deficiencies X. Dordrecht: Kluwer, 1991: p.69-76.
21. Regan BC, Reffin JP, Mollon JD. Luminance noise and the rapid determination of discrimination ellipses in colour deficiency. Vision Res, 1994;34: 1279-99. 22. Committee on Vision. Procedures for Testing Color Vision. Washington,