ECOLOGY, BEHAVIOR AND BIONOMICS
Orb-Weaving Spider Diversity in the Iberá Marshlands, Argentina
G
ONZALOD R
UBIO1, C
LAUDIAE M
ORENO21CONICET, Diversidad Animal I, Facultad de Ciencias Exactas, Físicas y Naturales, Univ Nacional de Córdoba, Av Vélez Sarsfi eld 299, X5000JJC Cba, Argentina; [email protected]
2 Centro de Investigaciones Biológicas, Univ Autónoma del Estado de Hidalgo, Apartado Postal 69 plaza Juárez, 42001 Pachuca, Hgo., Mexico; [email protected]
Edited by Og de Souza – UFV Neotropical Entomology 39(4):496-505 (2010)
ABSTRACT - The Iberá Marshlands RAMSAR reserve, in the northeast of Argentina, is one of the largest and most important wetlands of America. In this study we assess orb-weaving spider (Araneae: Orbiculariae) diversity in this reserve, analyzing different facets of local diversity (species richness, diversity, evenness and taxonomic distinctness), and the contribution of species differentiation (beta diversity) among localities and habitat types to the composition of regional diversity. We found 1657 individuals of 59 orb-weaving spider species/morphospecies. Local diversity differs among the three sampled localities. At the habitat level, the different facets of biodiversity followed a clear pattern, where woodlands have higher species richness, diversity, evenness and taxonomic distinctness than savannas. Savanna sites shared a common spider species composition, while woodland communities have high values of complementarity. Thus, beta diversity has a very high contribution to the regional diversity of the orb-weaving spiders in the Iberá Marshlands. We suggest that conservation management in the reserve should be directed towards promoting natural spatial heterogeneity, giving special protection to habitat mosaics in different localities.
KEY WORDS: Spider inventory, species richness, ecological diversity, taxonomic distinctness, beta diversity
The Iberá system comprises a macro functional unit of terrestrial, aquatic and interface environments with a surface of 12300 km2. It is located in the northeast of Argentina and is considered one of the largest and most important marshlands of America (Neiff & Poi de Neiff 2006). Due to its geographical location, inaccessibility and low human population density, this ecosystem has remained relatively unaltered compared with other Neotropical marshlands (Neiff 2004). The Iberá Reserve was designated a RAMSAR site in January 2002 (Giraudo 2003). This reserve is one of the few protected areas without anthropic modifi cations, and thus it represents a valuable scenario for studying the structure, distribution, organization and function of biological communities in native environments.
One of the most diverse groups within the Order Araneae is Orbiculariae, which is represented by the families Araneidae, Tetragnathidae, Theridiosomatidae, Anapidae, Nephilidae, Symphythognathidae, Mysmenidae, Uloboridae, and Deinopidae. The common characteristic of all them is that they build orbicular webs in strict sense (Coddington 1986). Orb-weaving spiders are strongly infl uenced by habitat type (Uetz 1991, Hurd & Fagan 1992). Their abundance and species composition are affected by the structural complexity of vegetation, giving their site preferences for building their webs (Hatley & MacMahon 1980, New 1999, Whitmore et al 2002, Tews et
al 2004, Tsai et al 2006, Jiménez-Valverde & Lobo 2007). Also, orb-weaving spiders are easily located due to the conspicuousness of their webs and their high abundance in ecosystems (Blanco-Vargas et al 2003). These features lead to consider this group as an appropriate model for biodiversity studies (Coddington & Levi 1991, Blanco-Vargas et al 2003).
Spider diversity in subtropical forests of the Neotropical region is not well known, especially in Argentina where systematic fi eldwork has not been carried out until recently. Only few aspects of species composition, diversity and distribution patterns are known so far (Corronca & Abdala 1994, Avalos et al 2006, 2007, Rubio et al 2008). Considering the framework of the Convention of Biological Diversity signed by the Argentine government (CBD 1992), species inventories and comparative studies of spider assemblages in areas of northern Argentina are needed. An accurate species inventory with quick, inexpensive and reliable methods is a basic and essential step for effectively managing and monitoring biological communities (May 1988, Coddington et al 1991, Colwell & Coddington 1994, Boulinier et al 1998, Shen et al 2003). Furthermore, the assessment of species diversity should ideally incorporate a set of measures in order to capture different facets of biodiversity.
species composition (beta diversity) provides an overview of the degree of resemblance between communities and its importance to the composition of regional richness (gamma diversity). In this sense, distinctness in species composition over sites of a region can be assessed using a measure of complementarity (Colwell & Coddington 1994) in order to capture the idea that complementary communities form parts of a whole. Also, from an ecological point of view, species diversity incorporates information on the community structure in terms of species abundances (number of individuals) assuming that a community with a more even distribution of abundances among the species is more diverse than a community that is clearly dominated by a few species and has many rare.
From another point of view, the degree of species phylogenetic relatedness is an additional feature that can be used in the analysis of species diversity and has great potential in setting conservation priorities and for environmental monitoring (Vane-Wright et al 1991, Williams et al 1991, Warwick & Clarke 1995, 1998, Clarke & Warwick 1999). This facet of biodiversity can be easily assessed with Clarke & Warwick’s taxonomic diversity indices, which take into account the taxonomical arrangement of species as a crude approximation to their evolutionary diversity (Warwick & Clarke 1995, Clarke & Warwick 1998), and is based on the idea that a community with closely related species is less biodiverse than a community with low relatedness among species.
The purpose of this study is to assess orb-weaving spider assemblages in the Iberá marshlands, analyzing different facets of local diversity, and the contribution of species differentiation (beta diversity) among localities and habitat types to the composition of regional diversity. The three studied localities are separated along 150 km in a NE-SW trajectory and they have particular conditions as the environmental units are arranged as groups of islands among lentic systems of great extension in the Paranaense-Espinal gradient. This implies a gradual difference in the vegetation between localities (Cabrera & Willink 1973).
The hypothesis is that the presence of contrasting habitats (savanna and woodland) and the variation between localities might be refl ected in orb-weaving spider diversity, causing an important contribution of differentiation between communities to the regional diversity in the reserve. If this occurs, 1) there would be clear differences between habitats and localities considering as response variables species richness, diversity, evenness and taxonomic diversity; 2) there would be high complementarity and a clear differentiation in species composition between the habitat types of each locality, and among localities; and 3) regional richness would depend on the values of local alpha diversity, but would also have a strong contribution of beta diversity (between habitats and localities). In this scenario, management for conservation should be directed towards promoting spatial heterogeneity, giving special emphasis to natural habitat mosaics in different localities. Alternatively, if we found a single spider assemblage in the reserve without spatial variation, we would suggest focusing management efforts in protecting only those habitats or localities that result more biodiverse.
Material and Methods
Study area. The study was conducted at the Iberá Marshlands Reserve (Corrientes, Argentina). In this area, three localities were selected: Colonia Pellegrini (CP) (28°32’S - 57°11’W) in San Martin department; Paraje Galarza (PG) (28°05’S - 56°41’W) in Santo Tomé department; and Estancia Rincón (ER) (28º44’S - 57º40’W) in Mercedes department (Fig. 1). This area consists of 12300 km2 of wetlands of the Paranaense (CP, PG) and Espinal (ER) Biogeographical Provinces (Cabrera & Willink 1973).
Two predominant habitat types are observed in all three localities: woodlands and savannas, which are distributed along the wetland system. The hygrophilous woodlands are found as “forest islands”, where the herbaceous stratum is characterized by the presence of Oplismenus hirtellus (pasto bezerro; Poaceae) and Chaptalia nutans (cerraja; Asteraceae). The shrub stratum shows a variable density, dominated by Brunfelsia australis (jasmín paraguayo; Solanaceae), Byttneria urticifolia (Sterculiaceae) and Ephedra tweediana (tramontana; Ephedraceae). The arboreal stratum, for medium to low height (between 8 m and 15 m), is represented mainly by Handroanthus heptaphyllus (lapacho; Bignoniaceae), Peltophorum dubium (ibirá pitá; Fabaceae), Cordia americana (guayaibí; Boraginaceae), Enterolobium contortisiliquum (timbó; Fabaceae), Nectandra angustifolia (laurel negro; Lauraceae) and some undergrowths of Guadua chacoensis (tacuara; Poaceae); Zanthoxylum fagara (tembetarí; Rutaceae) and Chloroleucon tenuifl orum (tatané; Fabaceae) are also present but less frequent. The savanna is characterized by the dominance of Andropogon laterales (paja colorada; Poaceae), two marked strata are identifi ed by the presence of Paspalum notatum (pasto horqueta; Poaceae) and abundant small grasses such as Cuphea sp. (Lythraceae), Tibouchina gracilis (Melastomataceae), Angelonia integerrima (Plantaginaceae) and Desmodium incanum (pega pega; Fabaceae).
The climate of this region is subtropical humid with warm rainy summers and cold and dry winters, the annual temperature and precipitation averages are 21.30 ºC and 1700 mm respectively (Neiff & Poi de Neiff 2006); however, the studied localities show less bioclimatic variations (Carnevali 1994).
season (10 samples per locality). Manual samples were taken at night by two people over 30 min by looking up and down (Coddington et al 1991). Overall, we took 150 samples (50 per locality). All samples were preserved in polyethylene bags (20 x 30 cm) with a small amount of 70% ethanol.
In the laboratory, spiders were sorted into families and morphospecies. Identifi cation to lower taxonomic levels was made with the available bibliography. Species nomenclature follows Platnick (2009). Immature specimens were assigned to generic level and in a few cases to species level only by morphological comparison with the adults, and their inclusion was necessary to obtain reliable estimates of species richness (Jiménez-Valverde & Lobo 2007). Furthermore, we used a reference collection made by various Argentine spider specialists (Avalos et al 2006, 2007) including spiders from different environments of Corrientes province. All the collected specimens were deposited in the Arthropod Collection of the Universidad Nacional del Nordeste, Argentina (CARTROUNNE).
Data analysis. The information collected using different techniques and sampling through the year allowed us to get more comprehensive species inventories by broadening the sampling universe. But in order to simplify this manuscript with a clear focus on our objectives, we do not pretend to analyze here the variation of spider assemblages between seasons or among sampling techniques. So, in this paper we restrict our
analysis to the patterns of spider diversity between habitats and localities.
As a fi rst step, we calculated the ratio between total number of individuals and total number of species (individuals: species) as a measure of sampling effort. As the number of individuals to capture one species increases, the inventory becomes more comprehensive assuming that less species remain to be capture. Then, we assessed the completeness of the spider inventories in each locality as the proportion of observed species richness relative to maximum expected richness. Expected richness was calculated using the Abundance-based Coverage Estimator (ACE), a non-parametric richness estimator, which was calculated with EstimateS 8 (Colwell 2006).
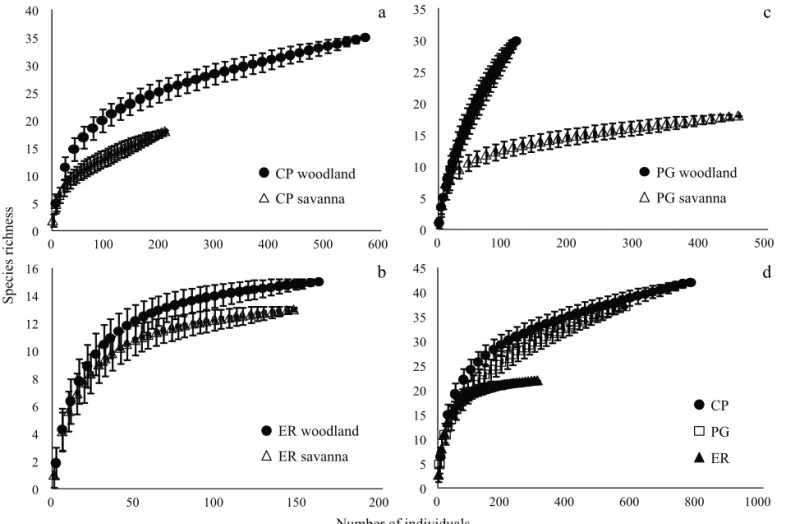
Species richness is a natural measure (May 1988); it is the simplest way to describe community and regional diversity (Magurran 2004), and it is fundamental for comparisons among sites. To test for differences in cumulative species richness between habitats and localities, we used rarefaction to standardize samples given that total number of individuals collected in each habitat and locality was markedly different (Gotelli & Colwell 2001, Colwell et al 2004, Magurran 2004). Rarefaction curves based on the number of individuals collected, with standard errors, were calculated with the software Species Diversity and Richness ver.3.0.2 (Henderson & Seaby 2002). The Shannon diversity and Pielou evenness indexes (Magurran 2004) were calculated Fig 1 Location of Iberá marshlands system (shaded area) and study localities (squares), Corrientes Province, Argentina. CP: Colonia Carlos Pellegrini; ER: Estancia Rincón; PG: Paraje Galarza.
28 28
57
57
0 50 km
50
N
PG
CP ER
50
with 95% confi dence intervals obtained by bootstrap re-sampling using the Species Diversity and Richness software (Henderson & Seaby 2002).
In addition, we used two taxonomic measures called Average Taxonomic Distinctness (Δ+) and Variation in Taxonomic Distinctness (Λ+) (sensu Clarke & Warwick 1998, 2001). On one hand, Δ+ takes into account the taxonomic level at which any two species are related and can be thought of as the average length –in the taxonomic tree– between any two randomly chosen species present in the sample (Warwick & Clarke 1995, Magurran 2004). Thus,
Δ+ is a direct measure of taxonomic diversity: a high value of Δ+ refl ects high taxonomic diversity (low relatedness among species). On the other hand, Λ+ refl ects the degree to which certain taxa are over- or under-represented in samples. Therefore, Λ+ measures the unevenness in the taxonomic tree, and is thus contrary to the concept of taxonomic biodiversity: high taxonomic diversity would be expected for a community with an even distribution of species among the taxonomic levels and units, a situation that would result in a low value of Λ+.
We used a simple linear scaling whereby the largest number of steps in the tree is set to = 100. We also performed a randomization test (1000 random samples) to detect differences in the taxonomic distinctness at each observed sample transect, from the expected values derived from the species pool, taking into account the number of species of the samples (Clarke & Warwick 1998). The null hypothesis assumes that each sample contains species randomly selected from the pool and that it should therefore fall within the 95% confi dence intervals. All the analyses of taxonomic diversity measures and randomization tests were performed using PRIMER (Clarke & Gorley 2001).
The degree of distinctness among pairs of localities was measured using the complementarity index suggested by Colwell and Coddington (1994). The value of this index, expressed as a percentage, ranges from 0% for identical species composition to 100% when species composition is completely different. This measure of complementarity is therefore a direct measure of beta diversity. Also, we used detrended correspondence analysis (DCA) to explore patterns in community composition across habitats and localities. DCA is a multivariate technique that orders samples based on the number of individuals of each species. Our ordination used the total number of each spider species recorded at each habitat type in each locality. Samples closer to one another in ordination space are more similar in species composition than samples that are further apart. We performed the DCA in CANOCO (ter Braak & Smilauer 2006).
Finally, in order to analyze the percentage contribution of point species richness (alpha diversity) and of dissimilarity in species composition (beta diversity) to the total spider richness, we used a model of additive partitioning of species richness (Lande 1996, Veech et al 2002, Crist et al 2003). According to this model, total spider richness in the Iberá Marshlands (gamma diversity) is considered as a result of summing mean species richness within habitats (alpha diversity), species change between the habitats of each locality (beta habitats), and species change among localities (beta localities):
γ = α + βhabitats + βlocalities
Using a completely randomized null model, we tested if the observed percentages of contribution of alpha and the two levels of beta diversity were statistically different from the expected values (1000 randomizations), assuming a random distribution of the individuals (Crist et al 2003). We used the PARTITION software (Veech & Crist 2007) to compute these values.
Results
Representativeness of spider inventories. We found 1657 individuals from 59 species/morphospecies, representing 25 genera and four families of orb-weaving spiders (Online Supplementary Material). The highest abundance and richness values were accounted by family Araneidae, which represented more than 72% of the individuals and 83% of the species. Contrary, family Nephilidae was represented by only two individuals and only one species [Nephila clavipes (L)]. The four families of orb-weaving spiders found in the region (Araneidae, Nephilidae, Tetragnathidae and Uloboridae) were collected in CP, while in ER and PG only Araneidae and Tetragnathidae families were observed. Genera with more species were Alpaida (fi ve spp.), Eustala (fi ve spp.), Larinia (four spp.), Micrathena (four spp.) and Parawixia (four spp.). In CP Metazygia gregalis (O. P.-Cambridge), Leucauge venusta (Walckenaer) and Eustala sp.1 were the most abundant taxa, accounting for 35.25% of the number of individuals. In ER the dominant taxa were Eustala sp.2, Alpaida veniliae (Keyserling) and Alpaida nonoai Levi (39.26% of total abundance), whereas Ocrepeira hirsuta (Mello-Leitão), A. veniliae and Parawixia bistriata (Rengger) were dominant in PG (49.64% of total abundance).
Total sampling effort represents an individuals:species ratio of 28:1. In CP we captured 776 individuals of 42 taxa (18.48:1 individuals:species ratio, 16.29:1 in woodland and 11.44:1 in savanna). In ER we found 307 individuals of 22 species/morphospecies (13.95:1 individuals:species ratio, 10.73:1 in woodland and 11.23:1 in savanna). And in PG we captured a total of 574 individuals of 37 species/ morphospecies (15.51:1 individuals:species ratio, 3.93:1 in woodland and 25.33:1 in savanna).
the other two localities, while no statistical difference was found in the species richness between CP and PG (Fig 2d).
Diversity and evenness. Variation of species diversity (Shannon index) and evenness (Pieolou index) follow the same trend than species richness only at the habitat level. Woodland has signifi cantly higher values of diversity (Fig 3a) and evenness (Fig 3b) only in CP, whereas in the other two localities woodland communities were also slightly more diverse and even than savanna communities, but we did not found statistically different values between these habitat types (Fig 3a, b). Among localities, CP has higher values of diversity (Fig 4a) and evenness (Fig 4b) than the other two localities, while no statistical difference was found in the values of these indices between ER and PG (Fig 4a, b).
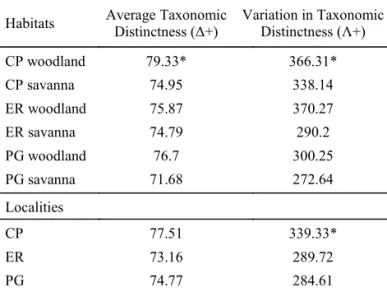
Taxonomic diversity. The Average Taxonomic Distinctness (Δ+) index had higher values of taxonomic spider diversity in woodlands than in savannas in the three localities (Table 1). However, only the value of woodland in CP was statistically higher from the value calculated with the randomization test, taking into account the species richness of each habitat. CP also has the higher value of Δ+ at the locality level, although not signifi cantly different from the expected by random.
A similar pattern was found with the index of Variation in Taxonomic Distinctness (Λ+), for which woodlands also had
Fig 2 Rarefaction curves for woodland and savanna communities of orb-weabing spiders in the three localities studied: a) Colonia Pellegrini; b) Estancia Rincón; c) Paraje Galarza; and d) a comparison among the three localities. The bars are standard errors.
0 2 4 6 8 10 12 14 16
0 50 100 150 200
Number of individuals ER savanna
0 5 10 15 20 25 30 35 40
0 100 200 300 400 500 600
CP woodland
ER woodland CP savanna
Species richness
0 5 10 15 20 25 30 35
0 100 200 300 400 500
PG woodland
PG savanna
0 5 10 15 20 25 30 35 40 45
0 200 400 600 800 1000
CP
PG
ER
a
b d
c
higher values than savanna, but only the value of woodland in CP was statistically higher from the value calculated with the randomization test. CP was the locality with the higher value of Λ+, and this value was signifi cantly different from the expected by random (Table 1).
Beta diversity. The value of the complementarity index was very similar for pairs of localities: 60.87% between CP and ER, 61.40% between CP and PG, and 62.79% between ER and PG (mean complementarity among localities: 61.69%). We also found slightly higher complementarity values when comparing the two habitat types (woodland and savanna) within each locality: 73.81% in CP, 72.73% in ER, and 70.27% in PG (mean = 72.27%). Interestingly, when comparing pairs of the same habitat type but found at different localities, we found higher beta diversity among woodlands (72.45% mean complementarity) than among savannas (63.82% mean complementarity).
Table 1 Orb-weaving spider taxonomic diversity values for habitat types and localities at the Ibera Marshlands Reserve, Corrientes, Argentina, according to the indices proposed by Clarke and Warwick (1998).
Habitats Average Taxonomic Distinctness (Δ+)
Variation in Taxonomic Distinctness (Λ+)
CP woodland 79.33* 366.31* CP savanna 74.95 338.14 ER woodland 75.87 370.27 ER savanna 74.79 290.2 PG woodland 76.7 300.25 PG savanna 71.68 272.64
Localities
CP 77.51 339.33*
ER 73.16 289.72
PG 74.77 284.61
Fig 4 Diversity (a) and evenness (b) of orb-weaving spider communities in the three localities studied. CP: Colonia Carlos Pellegrini; ER: Estancia Rincón; PG: Paraje Galarza. The bars are 95% confi dence intervals.
Fig 3 Diversity (a) and evenness (b) of orb-weaving spider communities between woodland and savanna habitats in the three localities studied. CP: Colonia Carlos Pellegrini; ER: Estancia Rincón; PG: Paraje Galarza. The bars are 95% confi dence intervals.
0 0.5 1 1.5 2 2.5 3
CP ER PG
Woodland
Savanna
0 0.1 0.2 0.3 0.4 0.5 0.6 0.7 0.8
CP ER PG
a
b
Shannon index
Pielou’
s index
Woodland
Savanna
2.3 2.4 2.5 2.6 2.7 2.8 2.9 3.0 3.1
CP ER PG
0.56 0.58 0.60 0.62 0.64 0.66 0.68 0.70 0.72 0.74 0.76
CP ER PG
a
b
Shannon index
Pielou’
s index
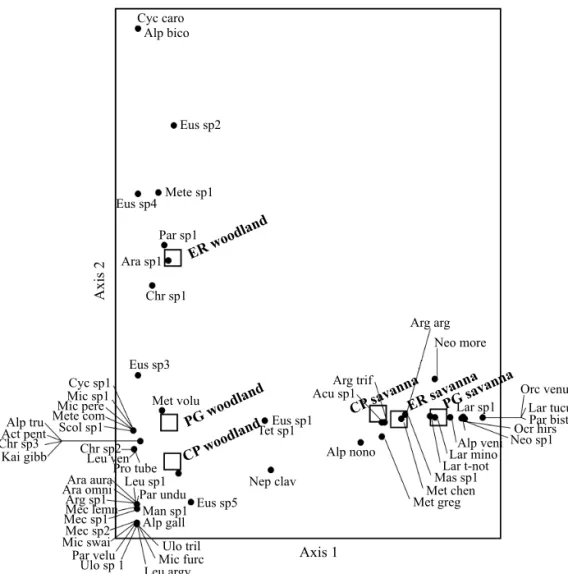
separates the three sites of woodlands, but has no infl uence on savannas. These two fi rst Axes explain a 59.20% of the variance in species data.
Partitioning of regional spider diversity. Mean observed alpha diversity (21.5 species) was signifi cantly lower (P < 0.001) than the value expected by random according to the null model (36.7 species). This observed alpha diversity contributes with only 36.44% to the gamma diversity of the orb-weaving spiders in the Iberá Marshlands (Fig 6). Consequently, beta diversity between habitats and beta diversity among localities have signifi cantly greater contributions than those expected by random.
Discussion
The number of orb-weaving spider species found in the Iberá Marshlands Reserve was higher than the number of species found in other investigations carried out in the Corrientes province, Argentina. For example, Rubio and collaborators (2008) found 29 species in two different protected habitats (hygrophilous woodland and savannah parkland) of the Mburucuyá National Park; and Avalos and collaborators (2007) reported 41 species in degraded forests *: statistically signifi cant different from the predicted value
Fig 5 Biplot of the DCA ordination for the orb-weaving spider communities in two habitat types at the three localities studied. CP: Colonia Carlos Pellegrini; ER: Estancia Rincón; PG: Paraje Galarza. The species names are abbreviated according to the key listed in the Online Supplementary Material.
Ulo tril Mic furc Leu argy Ulo sp 1
Par velu Mic swaiMec sp2 Mec sp1Mec lemn
Arg sp1 Ara omniAra aura
Pro tube Leu ven Chr sp2
Chr sp1
CP woodland
CP savannaER savannaPG savanna
PG woodland ER woodland Ara sp1
Par sp1
Kai gibb Chr sp3Act pent Alp tru
Acu sp1 Arg trif
Arg arg Neo more
Orc venu Lar tucu Par bist Ocr hirs Neo sp1 Scol sp1
Mete comMic pere Mic sp1
Cyc sp1
Lar sp1
Alp veni Lar mino Lar t-not Mas sp1 Met chen Met greg Leu sp1
Par undu Man sp1 Alp gall
Eus sp5
Nep clav Tet sp1Eus sp1 Eus sp3
Eus sp4
Eus sp2 Alp bico Cyc caro
Mete sp1
Met volu
Alp nono
Axis 1
Axis 2
Fig 6 The percentage of total orb-weaving species richness in the Iberá Marshlands explained by alpha- and beta-components of observed diversity. Three levels are represented in this analysis: within a habitat type in one locality (alpha), between habitat types (woodland and savanna) in each locality, and among localities. Values are expressed as the percent of the total species richness explained by each hierarchical level. The observed partitions are compared to expected values from a individual-based randomization null model.
0 10 20 30 40 50 60 70 80 90 100
Observed Null model
Beta between localities Beta between habitats Alpha diversity
%
from the humid Chaco, although these authors also reported the families Deinopidae and Theridiosomatidae. These two families inhabit mainly in cosmotropical environments, so their presence may be exceptional and dependent of their casual dispersion by means of the lotic fl oating vegetation (Rubio et al 2004, Avalos et al 2007). The number of species recorded in this study area is also larger to that observed by Blanco-Vargas and collaborators (2003) and Cepeda-Valencia & Florez-Daza (2006), both in the woodlands of the Colombian Andes. However, the number of species in this study in the Iberá marshlands was lower than that found by Silva (1996) in the Peruvian rainforest, if the same sampling techniques are considered. In our study Araneidae was the most abundant and species rich family of the orb-weaving spiders, a dominance that has also been reported by other authors (Silva 1996, Whitmore et al 2002, Benavides & Florez 2006).
richness (94%). Similar values have been obtained by other researchers: 68-89% (Coddington et al 1996), 86% (Blanco-Vargas et al 2003), 61-87% (Rubio et al 2008), 78-88% (Cardoso et al 2008). In the other two localities it seems that more sampling effort is needed in order to get a good representation of the expected species richness, particularly in the woodland of PG and in the savanna of CP. We did not found a clear trend between the percentage of inventory completeness according to the ACE estimator and the individuals:species ratio, so we propose that at least in this system sampling effort and inventory effi ciency are more intuitively evaluated considering the proportion of observed species richness relative to the expected richness using a non-parametric estimator. Nevertheless, this method estimates only the portion of the Iberá system orb-weaving spider fauna present in the sampled area, during the time of sampling and with the used, accessible methods. Expected values of richness are, therefore, estimates of the “instantaneous” species richness of studied localities, and they probably underestimate richness over larger scales (Coddington et al 1996).
The assessment of different facets of biodiversity at the locality and habitat levels offers a broad perspective on the orb-weaving spider communities. At the locality level, ER –located at southwest of the studied area– has the lower number of species and the lower taxonomic distinctness. CP –located at northeast of the studied area– was the locality with higher number of species, signifi cantly higher diversity and evenness, and also higher values of taxonomic distinctness. However, this locality had also the higher value of variation in taxonomic distinctness, indicating an over- or under-representation of some taxa. This possible uneven representation of taxa in the community structure, and its implications for ecological functioning, is an issue that should be studied in deep.
At the habitat level, the different facets of biodiversity showed a clear trend where woodlands have higher species richness, diversity, evenness and taxonomic distinctness than savannas. This may be explained by the complexity in vegetation structure in woodlands, giving that orb web building spiders rely on vegetation for their life cycle, either for fi nding food, building retreats or for web building. The structure of the vegetation is therefore expected to infl uence the diversity of spiders found in the habitat (Whitmore et al 2002). This indicates that structural diversity of the vegetation may, in some way, infl uence the spider diversity in the study area. Studies have demonstrated that a correlation exists between the structural complexity of habitats and species diversity (MacArthur 1964, Uetz 1979, Hatley & MacMahon 1980, Tews et al 2004, Pinkus-Rendón et al 2006, Jiménez-Valverde & Lobo 2007). Diversity generally increases when a greater variety of habitat types are present (MacArthur 1964). Uetz (1991) suggests that structurally more complex shrubs can support a more diverse spider community. Downie et al (1999) and New (1999) have demonstrated that spiders are extremely sensitive to small changes in the habitat structure; including habitat complexity, litter depth and microclimate characteristics. Thus, the physical structure of environments has an
important infl uence on the habitat preferences of spider species, especially web-building species (Uetz 1991, Hurd & Fagan 1992, Tsai et al 2006). This could explain the larger spider richness and diversity observed in woodlands, and particularly in CP, where vegetation seems more diverse. Also, grazing in the savannas could be a factor decreasing orb-weaving spider diversity, given that in general, as disturbance increases the spider species richness decreases (Shochat et al 2004, Pinkus-Rendón et al 2006).
When assessing beta diversity among localities, we observed that the proportion of shared species was low, thus the complementarity between localities is ca. 60%. This relatively high percentage is an indication that these localities are suffi ciently apart, showing a variation in their vegetation structure and/or bioclimatic characteristics (Coddington et al 1996). Distance does not seem to infl uence the complementarity between localities. Spider composition in ER is more different when compared with the two other localities. These results are also supported by its location in the Espinal Biogeographical Region, where the environment is slightly drier and the vegetation is sparser and lower than in the Paranaense Region (Cabrera & Willink 1973).
Beta diversity is higher between habitat types within localities (>70%). Also, complementarity shows higher values among woodlands than among savannas. This is corroborated in the DCA where savanna sites are found in a compact group because of their common species composition, while woodland sites are found more distant in the ordination space. Particularly, the woodland in ER is differentiated from the other woodlands because of its particular spider fauna (e.g. Alpaida bicornuta and Cyclosa cf caroli). These clear differences in species composition among habitats and localities explain the signifi cant contribution of beta diversity to the regional orb-weaving spider richness in the Iberá Marshlands (Fig 6).
Acknowledgments
We thank Gilberto Avalos for his help during the fi eld work, José Corronca and Miryam Damborsky for their support during the course of this investigation, Victoria Urcola for the suggestions in the English writing version, Esteban Meza-Torres for the characterization of the vegetation, Alberto Jiménez-Valverde for the critical reading to the manuscript, and anonymous reviewer for the constructive comments. This study was funded by a scholarship from the Secretaría General de Ciencia y Técnica - Universidad Nacional del Nordeste granted to GDR and by the research project “Artrópodos de la Reserva Provincial Iberá” leaded by María E. Bar and funded by the SGCyT, UNNE, Resolution Nº 333/04 and. Data analysis was supported by the SEP-CONACYT project 84127 (Mexico).
References
Avalos G, Rubio G D, Bar M E, González A (2007) Arañas (Arachnida: Araneae) asociadas a dos bosques degradados del Chaco húmedo en Corrientes, Argentina. Rev Biol Trop 55: 899-909.
Avalos G, Rubio G D, Bar M E, Damborsky M P (2006) Lista preliminar de la araneofauna (Arachnida: Araneae) del Centro-Norte de la Provincia de Corrientes, Argentina. Rev Iber Aracnol 13: 189-194.
Benavides L, Florez E (2006) Comunidades de arañas (Arachnida: Araneae) en microhábitats de dosel en bosques de tierra fi rme e Igapó de la Amazonía Colombiana. Rev Iber Aracnol 14: 49-62.
Blanco-Vargas E, Amat-García G D, Flórez-Daza E (2003) Araneofauna orbitelar (Araneae: Orbiculariae) de los Andes de Colombia: comunidades en habitats bajo regeneración. Rev Iber Aracnol 7: 189-203.
Boulinier T, Nichols J D, Sauer J R, Hines J E, Pollock K H (1998) Estimating species richness: the importance of heterogeneity in species detectability. Ecology 79: 1018-1028.
Cabrera A L, Willink A (1973) Biogeografía de América Latina. Monografía 13, Serie de Biología, Washington, Columbia, USA, Organización de Estados Americanos, 120p.
Cardoso P, Scharff N, Gaspar C, Henriques S S, Carvalho R, Castro P H, Schimdt J B, Silva I, Szüts T, de Castro A, Crespo L C (2008) Rapid biodiversity assessment of spiders (Araneae) using semi-quantitative sampling: a case study in a Mediterranean forest. Insect Conserv Divers 1: 71-84.
Carnevali R (1994) Fitogeografía de la Provincia de Corrientes. Instituto Nacional de Tecnología Agropecuaria. Corrientes, Argentina, Gob. Prov. Corrientes Ed., 324p.
Cepeda-Valencia J, Florez-Daza E (2006) Arañas tejedoras: uso de diferentes microhábitats en un bosque andino de Colombia. Rev Iber Aracnol 14: 39-48.
Clarke K R, Gorley R N (2001) PRIMER v5: User manual/tutorial. Plymouth Marine Laboratory, Plymouth.
Clarke K R, Warwick R M (1998) A taxonomic distinctness index and its statistical properties. J App Ecol 35: 523-531.
Clarke K R, Warwick R M (1999) The taxonomic distinctness measure of biodiversity: weighing of step lengths between hierarchical levels. Mar Ecol Prog Ser 184: 21-29.
Clarke K R, Warwick R M (2001) Change in marine communities: An approach to statistical analysis and interpretation. 2nd ed., PRIMER-E, Plymouth.
Coddington J A (1986) The monophyletic origin of the orb web, p.319-363. In Shear W A (ed) Spiders. Webs, behavior and evolution. California, Stanford University Press, 492p.
Coddington J A, Levi H W (1991) Systematics and evolution of spiders (Araneae). Annu Rev Ecol Syst 22: 565-592.
Coddington J A, Griswold C E, Silva D, Peñaranda D, Larcher S (1991) Designing and testing sampling protocols to estimate biodiversity in tropical ecosystems. In Dudley E C Proceedings of the Unity of Evolutionary Biology: Fourth International Congress of Systematic and Evolutionary Biology. Oregon, USA, Dioscorides Press., p.44-60.
Coddington J A, Young L H, Coyle F A (1996) Estimating spider species richness in a southern Appalachian cove hardwood forest. J Arachnol 24: 111-128.
Colwell R, Coddington J A (1994) Estimating terrestrial biodiversity through extrapolation. Philos Trans R Soc Lond B Biol Sci 345: 101-118.
Colwell R K, Mao Ch X, Chang J (2004) Interpolating, extrapolating, and comparing incidence-based species accumulation curves. Ecology 85: 2717-2727.
Colwell R K (2006) EstimateS: Statistical estimation of species richness and shared species from samples. Version 8. Persistent URL <purl.oclc.org/estimates>.
Corronca J A, Abdala C S (1994) La fauna araneológica de la Reserva Ecológica “El Bagual”, Formosa, Argentina. Aracnología 9: 1-6.
Crist T O, Veech J A, Gering J C, Summerville K S (2003) Partitioning species diversity across landscapes and regions: a hierarchical analysis of α, β, and γ diversity. Am Nat 162: 734-743.
Downie I S, Wilson W L, Abernethy V J, McCracken D I, Foster G N, Ribera I, Murphy K J, Waterhouse A (1999) The impact of different agricultural land-use on epigeal spider diversity in Scotland. J Insect Conserv 3: 273-286.
Gotelli N J, Colwell R K (2001) Quantifying biodiversity: procedures and pitfalls in the measurement and comparison of species richness. Ecol Lett 4: 379-391.
Giraudo A R (2003) Aves de los Esteros del Iberá: síntesis del proyecto, p.183-194. In Alvarez B B (ed) Fauna del Iberá. Argentina, EUDENE, 375p.
Henderson PA, Seaby R M (2002) Species diversity and richness III v 3.0.2. Pisces Conservation Inc.
Hurd L E, Fagan W F (1992) Cursorial spiders and succession-age or habitat structure. Oecologia 92: 215-221.
Jiménez-Valverde A, Lobo J M (2007) Determinants of local spider (Araneidae and Thomisidae) species richness on a regional scale: climate and altitude vs. habitat structure. Ecol Entomol 32: 113-122.
Lande R (1996) Statistics and partitioning of species diversity, and similarity among multiple communities. Oikos 76: 5-13.
MacArthur R H (1964) Environmental factors affecting bird species diversity. Am Nat 98: 387-396.
Magurran A E (2004) Measuring biological diversity. Oxford, Blackwell Science Ltd, 256p.
May R (1988) How many species are there on Earth? Science 241: 1441-1443.
Neiff J J (2004) El Iberá… ¿en peligro? Buenos Aires, Fundación Vida Silvestre Argentina, 136p.
Neiff J J, Poi de Neiff A S G (2006) Situación ambiental en la ecorregión Iberá, p.177-194. In Brown A, Martínez Ortíz U, Acerbi M, Corcuera J (eds) La situación ambiental argentina 2005. Buenos Aires, Fundación Vida Silvestre Argentina, 587p.
New T R (1999) Untangling the web: spiders and the challenges of invertebrate conservation. J Insect Conserv 3: 251-256.
Pinkus-Rendón M A, León-Cortés J L, Ibarra-Núñez G (2006) Spider diversity in a tropical habitat gradient in Chiapas, Mexico. Divers Distrib 12: 61-69.
Platnick N (2009) The world spider catalog, version 10.0. American Museum of Natural History, New York. Available from http:// research.amnh.org/entomology/spiders/catalog/index.html (accessed August 21, 2009)
Rubio G D, Corronca J A, Damborsky M P (2008) Do spider diversity and assemblages change in different contiguous habitats? A case study in the protected habitats of the Humid Chaco ecoregion, north-east Argentina. Environ Entomol 37: 419-430.
Rubio G D, Avalos G, Damborsky M P (2004) Primer registro de la familia Theridiosomatidae (Arachnida, Araneae) para Argentina. Rev Facena 20: 121-121.
Shen T, Chao A, Lin J (2003) Predicting the number of new species in further taxonomic sampling. Ecology 84: 798-804.
Shochat E, Stefanov W L, Whitehouse E A, Faeth S H (2004) Urbanization and spider diversity: influences of human
modifi cation of habitat structure and productivity. Ecol Appl 14: 268-280.
Silva D (1996) Species composition and community structure of peruvian rainforest spiders: a case study from a seasonally inundated forest along the Samiria river. Rev Suisse Zool vol hors série: 597-610.
ter Braak C J F, Smilauer P (2006) CANOCO for Windows version 4.54. Biometris—Plant Research International, Wageningen, The Netherlands.
Tews J, Brose U, Grimm V, Tielbölger K, Wichmann M C, Schwager M, Jeltsch F (2004) Animal species diversity driven by habitat heterogeneity/diversity: the importance of keystone structures. J Biogeogr 31: 79-92.
Tsai Z I, Huang P S, Tso I M (2006) Habitat management by aboriginals promotes high spider diversity on an Asian tropical island. Ecography 29: 84-94.
Uetz G W (1979) The infl uence of variation in litter habitats on spider communities. Oecologia 40: 29-42.
Uetz G W (1991) Habitat structure and spider foraging, p.325-348. In Bell S S, McCoy E D, Mushinsky H R (eds)Habitat structure. The physical arrangement of objects in space. London, Chapman and Hall, 438p.
Vane-Wright R I, Humphries C J, Williams P H (1991) What to protect? Systematics and the agony of choice. Biol Conserv 55: 235-254.
Veech J A, Summerville K S, Crist T O, Gering J C (2002) The additive partitioning of diversity: recent revival of an old idea. Oikos 99: 3-9.
Veech J, Crist T O (2007) PARTITION, software for the additive partitioning of species diversity. Version May 2007. Available in: http://www.users.muohio.edu/cristto/partition.htm.
Warwick R M, Clarke K R (1995) New “biodiversity” measures reveal a decrease in taxonomic distinctness with increasing stress. Mar Ecol Prog Ser 129: 301-305.
Warwick R M, Clarke K R (1998) Taxonomic distinctness and environmental assessment. J Appl Ecol 35: 532-543.
Whitmore C, Slotow R, Crouch T E, Dippenaar-Schoeman A S (2002) Diversity of spiders (Araneae) in a savanna reserve, Northern Province, South Africa. J Arachnol 30: 344-356.
Williams P H, Humphries C J, Vane-Wright R I (1991) Measuring biodiversity: taxonomic relatedness for conservation priorities. Aust Syst Bot 4: 665-679.
List of spider species/morphospecies and number of individuals from the Iberá marshlands, Corrientes, Argentina. Ar: Araneidae; Te: Tetragnathidae; Ne: Nephilidae; Ul: Uloboridae
Continue
Family Species/morphospecies Key Total
Ar Actinosoma pentacanthum (Walckenaer) Act pent 1
Ar Aculepeira sp1 Acu sp1 6
Ar Alpaida bicornuta (Taczanowski) Alp bico 7
Ar Alpaida gallardoi Levi Alp gall 66
Ar Alpaida nonoai Levi Alp nono 42
Ar Alpaida truncata (Keyserling) Alp trun 2
Ar Alpaida veniliae (Keyserling) Alp veni 165
Ar Araneus aurantiifemuris (Mello-Leitão) Ara aura 1
Ar Araneus omnicolor (Keyserling) Ara omni 9
Ar Araneus sp1 Ara sp1 20
Ar Argiope argentata (Fabricius) Arg arg 2
Ar Argiope sp. Arg sp1 1
Ar Argiope trifasciata (Forsskål) Arg trif 21
Te Chrysometa sp1 Chr sp1 17
Te Chrysometa sp2 Chr sp2 5
Te Chrysometa sp3 Chr sp3 1
Ar Cyclosa cf caroli (Hentz) Cyc caro 1
Ar Cyclosa sp1 Cyc sp1 1
Ar Eustala sp1 Eus sp1 105
Ar Eustala sp2 Eus sp2 67
Ar Eustala sp3 Eus sp3 10
Ar Eustala sp4 Eus sp4 3
Ar Eustala sp5 Eus sp5 10
Ar Kaira gibberosa O. P.-Cambridge Kai gibb 1
Ar Larinia minor (Bryant) Lar mino 33
Ar Larinia sp1 Lar sp1 4
Ar Larinia t-notata (Tullgren) Lar t-not 60
Ar Larinia tucuman Harrod, Levi & Leibensperger Lar tucu 1
Te Leucauge argyra (Walckenaer) Leu argüí 25
Te Leucauge sp. Leu sp1 20
Te Leucauge venusta (Walckenaer) Leu ven 166
Ar Mangora sp1 Man sp1 6
Ar Mastophora sp1 Mas sp1 1
Ar Mecynogea lemniscata (Walckenaer) Mec lemn 1
Ar Mecynogea sp1 Mec sp1 7
Ar Mecynogea sp2 Mec sp2 30
Ar Metazygia chenevo Levi Met chen 18
Ar Metazygia gregalis (O. P.-Cambridge) Met greg 163
Ar Metazygia voluptifica (Keyserling) Met volu 98
Ar Metepeira compsa (Chamberlin) Mete com 1
Ar Micrathena furcata (Hahn) Mic furc 1
Ar Micrathena peregrinatorum (Holmberg) Mic pere 1
Ar Micrathena sp1 Mic sp1 2
Ar Micrathena swainsoni (Perty) Mic swai 1
Ar Neoscona moreli (Vinson) Neo more 40
Ar Neoscona sp1 Neo sp1 16
Ne Nephila clavipes (L) Nep clav 2
Ar Ocrepeira hirsuta (Mello-Leitão) Ocr hirs 114
Ar Ocrepeira venustula (Keyserling) Ocr venu 34
Ar Parawixia bistriata (Rengger) Par bist 79
Ar Parawixia sp1 Par sp1 11
Ar Parawixia undulata (Keyserling) Par undu 40
Ar Parawixia velutina (Taczanowski) Par velu 1
Ar Pronous tuberculifer Keyserling Pro tube 5
Ar Scoloderus sp1 Scol sp1 5
Te Tetragnatha sp1 Tet sp1 57
Ul Uloborus sp1 Ulo sp1 1
Ul Uloborus trilineatus Keyserling Ulo tril 21