Soil drying and rewatering applied at three grain
developmental stages affect differentially growth and
grain protein deposition in wheat (
Triticum aestivum
L.)
José Beltrano1,2*, Marta Guillermina Ronco1,2 and María Cecilia Arango1
1Instituto de Fisiología Vegetal, Universidad Nacional de La Plata, C.C. 327, 1900 La Plata, Argentina; 2CICBA; *Corresponding author:
Received: 06/11/2005, Accepted: 03/02/2006
Water deficits cause large yield losses in wheat. Although anthesis is generally considered the most vulnerable period, water deficit during grain filling can also cause yield losses. The objective of this study was to investigate the effect of water stress and rewatering, at three different grain developmental stages, on physiological and grain filling parameters and on yield com-ponents. Wheat plants were subjected to water deficit and rewatering at the watery ripe, milk and soft dough stages. In the flag leaf, water stress decreased the relative water content, the chlorophyll and protein content and increased the leakage of sol-utes, at all three studied grain filling stages. Water stress at the watery ripe and milk stages reduced the final grain dry mass by 47 % and 20 %, respectively. This reduction was due to a decrease in the grain filling period and to a significant reduc-tion in the maximum rate of grain-fill. Water stress imposed at the watery ripe stage reduced not only the linear growth phase
but also its slope; grain number per spikeand the 1000-kernel weight were also significantly reduced. SDS-PAGE patterns of
grain proteins at the watery ripe stage did not differ between the controls, stressed or rewatered treatments. Protein patterns
at the milk stage changed substantially with water stress, mainly for the high molecular weight glutenin subunits and ω
glia-dins. Three new bands were observed with apparent molecular weights of 108.5 kDa, 84.8 kDa and 63 kDa. Rewatering re-verted water stress effects when it was imposed at the milk stage. Water deficit at the soft dough stage did not have any effect on protein grain patterns.
Key words: grain filling, growth rate, logistic model, protein profile, water stress.
O estresse hídrico e a reidrataçao aplicados em três estàgios de desenvolvimento dos gräos afetam diferentemente o crescimento e a deposiçao das proteinas dos gräos em trigo (Triticum aestivum L.): O estresse hídrico provoca na cultura do trigo grandes perdas de rendimento. Apesar da antese ser considerada, geralmente, a fase mais vulnerável, o déficit hídri-co durante todo o período de preenchimento também pode provocar perdas na produtividade da cultura. O objetivo do pre-sente estudo foi pesquisar o efeito do estresse hídrico e da reidratação durante três estágios, no desenvolvimento do grão de trigo, sob diferentes parâmetros fisiológicos e do preenchimento dos grãos, e sob os componentes do rendimento. As plan-tas foram submetidas ao estresse hídrico e reidratação durante as fases de grão aquoso, leitoso e pastoso. O estresse hídri-co reduziu o hídri-conteúdo relativo d’ água, o hídri-conteúdo da clorofila e das proteínas nas folhas bandeiras e aumentou a liberação dos solutos, nos três estádios do grão estudados. O estresse produzido durante os estádios aquoso e leitoso reduziu o peso fi-nal dos grãos em 47 % e 20 %, respectivamente. Essa redução foi devida a um encurtamento do período de preenchimento e
a uma significativa diminuição na taxa máxima de preenchimento dos grãos. O estresse hídrico no estádio aquoso, não
so-mente reduziu a fase linear da curva de crescimento, mas também sua pendente; além disso diminuiu significativaso-mente o número de grãos por espiga e o peso de mil grãos. No estádio aquoso, não foram observadas diferenças nos padrões protéi-cos (SDS-PAGE) dos grãos das testemunhas, plantas estressadas ou reidratadas, no entanto, o estresse modificou significati-vamente os padrões protéicos correspondentes ao estádio leitoso, principalmente nas subunidades de gluteninas de alto peso
molecular e ω gliadinas. Foram observadas três bandas novas com pesos moleculares aparentes em torno de 108,5 kDa; 84,8
kDa e 63kDa. A reidratação no estádio leitoso reverteu os efeitos do estresse. A estiagem durante o estádio pastoso não teve efeito em padrões protéicos dos grãos.
INTRODUCTION
Stress provoked by drought is a complex process, considered as one of the most important factors limiting crop yields in the world. The deficiency of available soil water often affects the yield of cereals. In Argentina, spring wheat (Triticum aestivum L.) can often undergo prolonged periods of water stress during grain filling.
In cereals, each yield component is set during a determined phenological phase. Numerous glasshouse and field experiments have demonstrated that water deficiency can affect yield components, depending on the developmental stage at which water deficit occurs (Innes et al., 1981; Blum and Pnuel, 1990). The intensity of the response depends on the stress severity and its duration, as well as the plant developmental stage. One view is that water stress is less detrimental to grain yield when occurring early in the crop cycle (Blum, 1996). It is well known that stress before anthesis has an influence on the number and size of ears. The number of grains per ear, ear length and final number of ears per square meter can also be reduced when dry conditions prevail over the entire period of grain development or at booting (Innes et al., 1981; Blum and Pnuel, 1990).
The two major components of wheat grain are protein and starch. In general, the proteins are synthesized essentially from nitrogen taken up before grain filling, whereas starch
is produced from the net assimilation of CO2 after anthesis.
Therefore, protein and starch deposition during the grain filling period do not proceed simultaneously, that is, the rate of protein accumulation may reach a peak before that of starch and may decline earlier (Herzog and Stamp, 1983). Thus, the variation of environmental factors such as high temperature and water stress during the post anthesis period mainly affects carbon supply and starch accumulation, and has little effect on nitrogen accumulation (Triboi et al., 2001). Beltrano et al. (1999) demonstrated that when drought is applied after anthesis, grains contained more proteins compared with control (non-stressed) and when the water stress was reverted by rewatering the protein content decreased, although to higher values than those of the control.
The duration of grain filling is determined principally by genotype, environmental factors (Sofield et al., 1977; Wheeler et al., 1996) and genotype - environment interactions (Panozzo et al., 1999). Kobata et al. (1992) found that a water stress imposed at anthesis, or over the first few days after anthesis, affects grain set and the grain filling rate, causing a reduction in yield components. Beltrano et al. (2000) have demonstrated that the mean grain filling rate was diminished
by stress and that rewatering produced an increase, although lower than control. In addition, Dencic et al. (2000) verified that the yield components of different genotypes are specifically affected by a temporary water shortage and that cultivar variation can occur in the trait for drought tolerance. Growth of the wheat grain is comprised of three phases, following a sigmoidal pattern from anthesis to maturity (Loss et al., 1989). Immediately after anthesis there is a short period known as the lag phase, around 4-7 days (Hunt et al., 1991), when grain number per spike is established. The number of endosperm cells formed during this period determines the potential grain size (Brocklehust, 1977). During the second phase, grain size and dry weight increase linearly, such that the rate of grain filling is approximately constant, but these changes depend on growth conditions and the cultivar (Sofield et al., 1977). The final phase of grain development coincides with the maximum grain dry weight and is referred to as physiological maturity of the grain. The grain filling process can be described by various mathematical functions such as quadratic, cubic polynomial or logistic functions (Duguid and Brûlé-Babel, 1994; Wheeler et al., 1996; Panozzo and Eagles, 1999; Li et al., 2000). Since the rate of grain filling changes with the time, its estimation is a complex problem. Zahedi and Jenner (2003) have analyzed the grain filling period using several mathematical models and they concluded that the ordinary logistic model was the most appropriate, since this function includes a lag, a linear and a plateau phase.
Generally, in drought experiments the plants are subjected to water stress at anthesis, at post-anthesis or during the whole growth period (Shpiler and Blum, 1991; Kobata et al., 1992; Karim et al., 2000), rather than at a specific phase of the grain filling period. Hence, the objectives of this study were: (i) to evaluate physiological parameters of plants submitted to water stress and subsequent rewatering at the watery ripe, milk, and soft dough stages; (ii) to estimate the grain filling parameters of plants subjected to water stress and subsequent rewatering at the three grain stages, using an ordinary logistic model; (iii) to evaluate yield components of water-stressed and rewatering plants at the different stages of grain development; (iv) to investigate changes of protein patterns as consequence of water stress treatments and rewatering during the grain filling period.
MATERIAL AND METHODS
The experiments were conducted at La Plata (34° SL, 54’ WL) Argentina. Plants were grown in a greenhouse between July to December, under natural day-length. The maximum photosynthetic photon flux density at the plant top was 1.150
μmol.m-2.s-1 in July and 2.100 μmol.m-2.s-1 in December. At
sowing fertilizer was applied equivalent to 50 kg N.ha-1.
Pests and diseases were controlled. In this paper, only data of experiments conducted in the first year are presented but these did not differ significantly from those of a repeat experiment conducted in the second year.
Treatments: Plants were subject to the following treatments: Control: plants were watered daily, to maintain soil water
potential (Ψs) close to –0.03 MPa. (Wc). Water stress:
plants were stressed by withholding watering (Ψs ≈ –1.2
MPa). It took up to approximately 3 days to reach this soil water potential, according to the environmental conditions (figure 1). The water stress was imposed at three different
grain stages: watery ripe stage (EC71) (Ws1); milk stage
(EC76) (Ws2) and soft dough stage (Ws3) (EC 85) (Zadocks
et al., 1974) and this Ψs wasmaintained until the end of the
experiment. Rewatering: plants at the three different grain
stages — watery ripe (Wr1); milk (Wr2) and soft dough
(Wr3) — were first exposed to water stress (Ψs≈ –1.2 MPa)
for approximately 3 days, according to the environmental
conditions, then watered until Ψs was similar to Wc,
normally within 7 h (Beltrano et al., 1997) and this Ψs
maintained until the end of the experiment (figure 1).
To control the water levels, Ψs was measured daily
during the entire experiment with a HR-33T dew-point
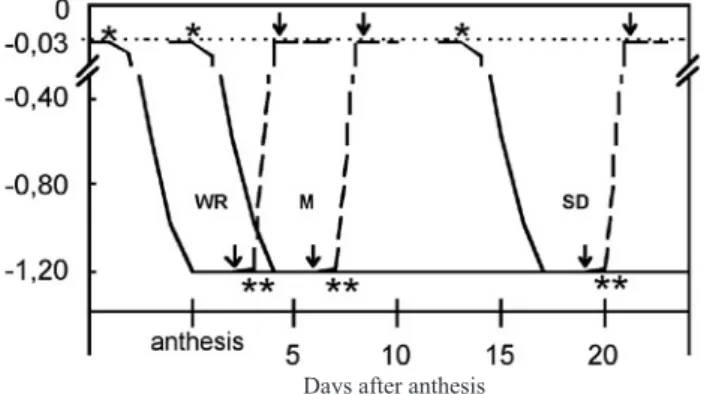
Figure 1. Soil water potential at different wheat grain filling stages: watery ripe stage (WR), milk stage (M), and soft
dough stage (SD). (*) Water stress initiated; (**) Rewatering
initiated. Arrows indicate the first water stress or rewatering sampling, at each grain stage. The dotted line shows the water potential at field capacity, the dashed line shows rewatering and the solid line shows soil drying.
psychrometer (Wescor Inc., Logan, UT, USA) with PST-55 probes, placed 15 cm deep in the soil at the beginning of the experiment. The amount of water lost was added to each pot
to return to the desired Ψs. The availability of the soil water
was previously determined and a curve of water retention was made.
Physiological parameters
To determine these parameters, 5 flag leaves of each treatment, were collected at midday at the three different
grain stages approximately 2 days after the Ψs reached –1.2
MPa in stresses plants or –0.03 MPa in control and rewatered plants, according to environmental conditions (figure 1).
Electrolyte leakage: After sampling, the flag leaves were immediately cut into discs of 0.8 cm diameter. The discs were washed briefly three times in deionized water for elimination of the solutes liberated during cutting of the discs. Five discs of each flag leaf were then placed in a vial filled with 10 mL deionized water and maintained at 20°C for 4 h. Electrolyte leakage was determined by measuring the conductivity of the vial solution, using a DIGICOND IV conductimeter (Luftman Co.), and data expressed as
μS.cm-1.
Leaf relative water content (RWC): The RWC was measured in 5 discs of each flag leaf. The flag leaf discs, obtained in a similar manner as that for electrolyte leakage, were weighed (wi), floated on distilled water at 4°C in the dark for 4 h,
blotted, weighed again (wr), and finally dried at 80°C for 48
h for dry weight determination (wd). RWC was calculated
according to the formula: RWC (%) = (wi-wd)/(wr-wd)100
Chlorophyll content: The degradation of chlorophyll, which was used as an index of senescence, was determined according to Morn and Porath (1980) using one disc of each flag leaf and 500 mg of glumes and awns of each treatment.
Data were expressed as μg chlorophyll.cm-2 (leaf) or μg
chlorophyll.mg-1 (ears: glumes and awns).
Leaf protein content: The protein content was measured in two discs of each leaf according to Bradford (1976), with bovine serum albumin as a standard. Data were expressed as μg protein.cm-2.
Grain analysis: At anthesis all spikes were tagged. Visual observations on time to anthesis (anthers extruded in approximately 50 % of the spikes) and time to maturity (approximately 90 % of spikes devoid of green coloration)
were used to estimate the duration of grain filling. Ten spikes were sampled from each treatment at 2- to 3-day intervals from anthesis up to harvest. Ears were threshed by hand. Grain dry mass was determined on five spikes after oven-drying at 80°C. The remaining grains were frozen in liquid nitrogen, lyophilized and stored at 4°C for subsequent nitrogen and SDS-PAGE analysis. The number of grains per spike was counted and grain mass determined. The 1000-kernel weight was calculated. Average rate of grain filling was estimated by grain mass at harvest and the duration of the filling period.
For each treatment (control, water stress and rewatering) and for each grain stage, the relationship between grain dry mass and days after anthesis was described by fitting to a 4-parameter logistic equation in the following form, according to Zahedi and Jenner (2003):
W = a+c/[1+exp(-b(t-m))]
Where W estimates grain weight (g); a is the initial
grain mass; c the final grain mass; b the rate of growth (a
slope parameter); t is the time variable (days after anthesis);
m is the point of maximum rate of the logistic curve.
The duration and maximum growth rate were calculated as follows:
Maximum growth rate: R = bc/4
Duration of grain filling: D = (bm+2. 944)/b
Nitrogen analysis: Total grain nitrogen content was determined by micro-Kjeldahl analysis according to the official method (AOAC, 1984) and expressed as percentage of N in grain dry matter. The nitrogen values were converted to protein percentage using a conversion factor of 5.7.
Sodium dodecyl sulphate-polyacrylamide gel electrophoresis (SDS-PAGE). Total proteins were extracted from 20 mg of freeze-dried milled grain with 500 µL sample buffer (0.125 M Tris-HCl, 4% SDS, 30% glycerol, 5 % 2-mercaptoethanol, 0.02 % Bromophenol blue, pH 6.8). The proteins were fractionated by SDS-PAGE according to the procedure of Laemmli (1970) using 12% polyacrylamide gels run in a Hoefer SE 600 standard dual cooled gel electrophoresis slab unit, under the following conditions: 6 hr, 240 V, 50 mA, 20°C. Gels were stained overnight with 0.025 % Coomassie brilliant blue R-250, destained in 40 % methanol and 7 % acetic acid and finally stored in 20 % acetic acid solution at 4°C. The gels were then scanned using an Umax Astra 1200S Scanner coupled to an IMB compatible computer. The scan of each lane was analyzed using the Sigma Gel 1.0 SSPS
software, and the molecular mass estimated by comparison with molecular size standards (LMW calibration kit for SDS Electrophoresis, Pharmacia).
Each gel pattern was scanned three times, with at least three replicate lanes of each sample in two different gels (six replicates) and the average values determined.
Statistical analysis: The statistical design of the assays was based on a completely randomized distribution with five replicates for each treatment (control, water stress and rewatering) and for each grain stage (watery ripe, milk
and soft dough stage). Physiological parameters, yield
components and protein grain content data were subjected to ANOVA. When the effect was significant (P<0.05), differences between means were evaluated for significance by the LSD test. For each grain stage and treatment (control, water stress and rewatering), the different grain filling attributes were analyzed simultaneously using a parallel
curve analysis (GENSTAT statistical package, 7th edition,
VSN International Ltd, Oxford, UK).
RESULTS
Effects of water stress and rewatering on physiological parameters: The relative water content (RWC) of flag leaves was significantly lower for water-stressed plants compared to control plants, either at the watery ripe, milk or soft
dough stage.The RWC of rewatered plants was similar to
well-watered ones (table 1).
The solute leakage from leaf discs under well-watered conditions did not differ significantly during the entire period of grain filling. In contrast, the water-stressed plants
(Ws1, Ws2 or Ws3) showed significantly increased electrolyte
leakage compared with the well-watered ones (table 1). The
loss of solutes from flag leaf discs of rewatered plants (Wr1,
Wr2 or Wr3) did not differ from that of the control.
Under water stress conditions the chlorophyll content of flag leaves decreased significantly at all three grain filling stages studied, although at the watery ripe and milk stages, the differences between control and water-stressed plants were more evident (table 1). The flag leaves of rewatered plants retained greater chlorophyll levels than stressed ones, but the values were lower than that of the control. The chlorophyll content of the ears (glumes and awns) did not differ among treatments at the 3 grain filling stages studied (table 1).
rewatered plants had considerably higher protein contents than water-stressed, but there was no significant difference between control and rewatered ones (table 1).
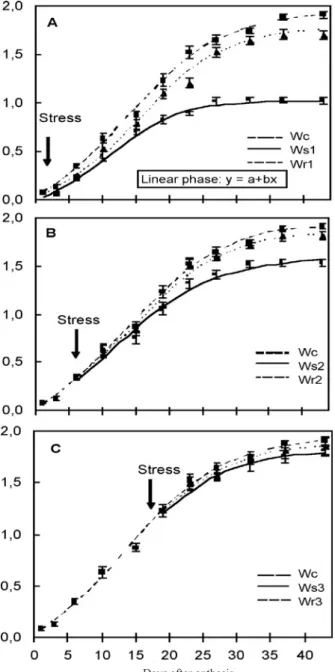
Effects of water stress and rewatering on grain analysis: The water stress and rewatering treatments carried out at the watery ripe, milk and soft dough stages correspond, respectively, to the lag phase of the growth curve, to the beginning of the linear phase and to the end of the linear phase. The grain filling attributes estimated by the ordinary logistic model are shown in table 2 and in figure 2.
At the watery ripe stage, grain mass per spike at harvest
was significantly reduced by the water stress treatment (Ws1)
(47 %) compared with the control (Wc) (figure 2A and table 2). Similarly, the duration of grain filling (26.14 days) was also shorter than for the control, with a significant reduction in the maximum rate and in the time from anthesis to the maximum rate (the inflection point) of grain filling (table 2). At Ws1 there was an evident reduction in the linear phase duration (figure 2A). The grain mass per spike between control and
Ws1 was similar until near 12 DAA, after which the grain
mass per spike (Ws1) began to decrease with respect to the
control, reducing significantly the linear phase (26 %) and its
slope (b= 0.0481, Ws1 and b= 0.0679, Wc). The rewatering
treatment reversed the detrimental effects of the stress and the grain filling attributes increased significantly compared to the water stress plants. The final grain mass, the maximum rate of grain filling (table 2) and the duration of the linear phase and
its slope in Wr1 were similar to the control (figure 2A).
When water was withheld at the milk stage (Ws2),
the estimated parameters were also significantly reduced (between 20 and 14 %) (table 2), except for the duration of grain filling that was similar to Wc. The duration of the linear phase was 3 days shorter than Wc, while its slope was similar to the control. On the other hand, there were significant differences in the grain mass (figure 2B). Rewatering reversed the water stress effects, and control values were reached.
Water stress applied to the plants at the end of the linear phase (soft dough stage) produced no detrimental effects on the parameters studied (table 2 and figure 2C).
When plants were subjected to soil drying at the watery ripe stage, the reduction in the duration and grain filling rate led to a decline in the 1000-kernel weight (values about 17 % lower than in well-watered plants). On the other hand, water stress at the milk and soft dough stages had no significant effect on the 1000-kernel weight (table 3). Moreover, the water stress at the watery ripe stage significantly reduced the number of spikes per plant (by 30 %) and the number of grain per spike (by 35 %), at maturity. At the milk stage, when water was withheld, both parameters decreased approximately 10 % whereas at the soft dough stage there was no significant difference. Rewatered plants, on the other hand, produced heavier grains than stressed plants and partially reversed the effect of the stress at the watery ripe stage and completely at the milk stage (table 3).
At watery ripe and milk stages, water stress treatment increased protein quantity per grain compared with
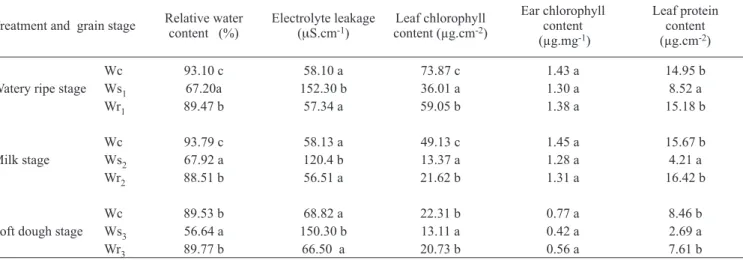
well-Table 1. Relative water content, electrolyte leakage, chlorophyll and protein content in flag leaves and ears (glumes and awns) of wheat plants submitted to water stress and rewatering at watery ripe, milk or soft dough stage. Within a column and grain stage, means followed by the same letter are not significantly different. P< 0.05 level.
Treatment and grain stage Relative water content (%) Electrolyte leakage (
μS.cm-1) content (µg.cmLeaf chlorophyll -2)
Ear chlorophyll content (µg.mg-1)
Leaf protein content (µg.cm-2)
Watery ripe stage
Wc 93.10 c 58.10 a 73.87 c 1.43 a 14.95 b
Ws1 67.20a 152.30 b 36.01 a 1.30 a 8.52 a
Wr1 89.47 b 57.34 a 59.05 b 1.38 a 15.18 b
Milk stage
Wc 93.79 c 58.13 a 49.13 c 1.45 a 15.67 b
Ws2 67.92 a 120.4 b 13.37 a 1.28 a 4.21 a
Wr2 88.51 b 56.51 a 21.62 b 1.31 a 16.42 b
Soft dough stage
Wc 89.53 b 68.82 a 22.31 b 0.77 a 8.46 b
Ws3 56.64 a 150.30 b 13.11 a 0.42 a 2.69 a
Table 2. Duration of grain filling, final dry mass and rate estimated by the logistic model for wheat plants submitted to water stress and rewatering at watery ripe, milk or soft dough stage. Within a column and grain stage, means followed by the same letter are not significantly different. P< 0.05 level.
Treatment and grain stage Duration of grain mass filling (days)
Final grain dry mass (g.spike-1)
Maximum rate grain filling
(g.day-1)
Time to maximum rate
(days)
Watery ripe stage
Wc 35.39 b 1.862 b 0.0748 b 13.57 b
Ws1 26.14 a 0.978 a 0.0544 a 10.56 a
Wr1 34.37 b 1.645 b 0.0736 b 14.43 b
Milk stage
Wc 35.39 a 1.862 b 0.0748 b 13.57 b
Ws2 33.98 a 1.479 a 0.0624 a 11.56 a
Wr2 34.53 a 1.792 b 0.0741 b 14.75 b
Soft dough stage
Wc 35.39 a 1.862 a 0.0748 a 13.57 a
Ws3 34.02 a 1.766 a 0.0744 a 13.84 a
Wr3 34.99 a 1.816 a 0.0747 a 14.03 a
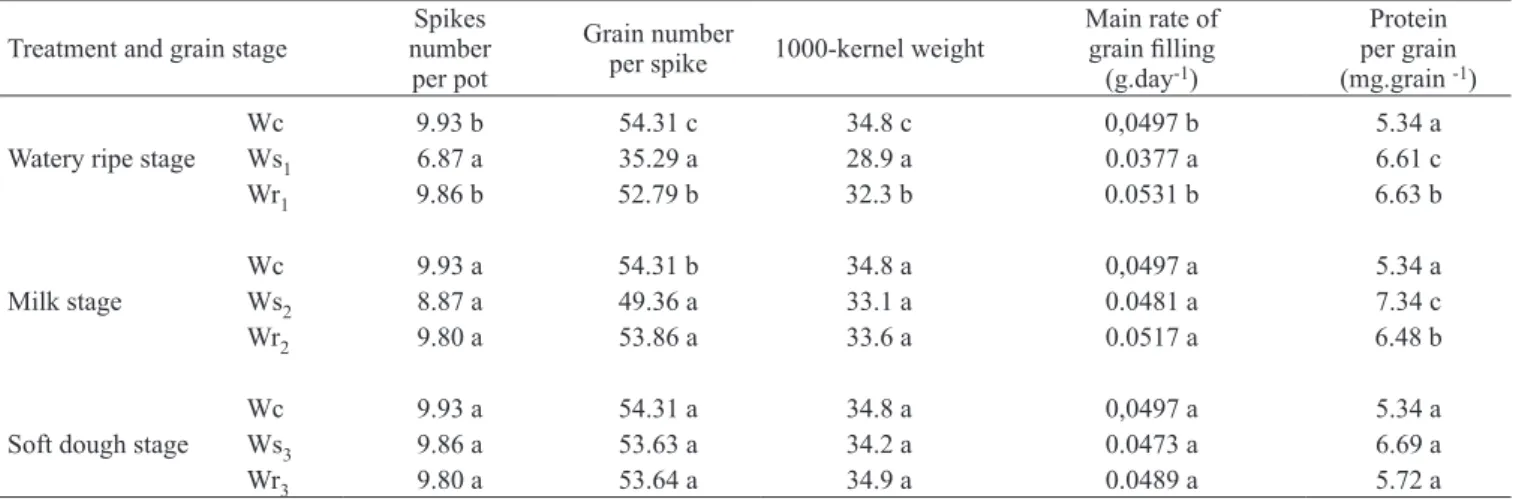
Table 3. Yield components and protein per grain of wheat plants submitted to water stress and rewatering at watery ripe, milk or soft dough stage. Within a column and grain stage, means followed by the same letter are not significantly different. P< 0.05 level.
Treatment and grain stage numberSpikes per pot
Grain number
per spike 1000-kernel weight
Main rate of grain filling
(g.day-1)
Protein per grain (mg.grain -1)
Watery ripe stage
Wc 9.93 b 54.31 c 34.8 c 0,0497 b 5.34 a
Ws1 6.87 a 35.29 a 28.9 a 0.0377 a 6.61 c
Wr1 9.86 b 52.79 b 32.3 b 0.0531 b 6.63 b
Milk stage
Wc 9.93 a 54.31 b 34.8 a 0,0497 a 5.34 a
Ws2 8.87 a 49.36 a 33.1 a 0.0481 a 7.34 c
Wr2 9.80 a 53.86 a 33.6 a 0.0517 a 6.48 b
Soft dough stage
Wc 9.93 a 54.31 a 34.8 a 0,0497 a 5.34 a
Ws3 9.86 a 53.63 a 34.2 a 0.0473 a 6.69 a
Wr3 9.80 a 53.64 a 34.9 a 0.0489 a 5.72 a
watered plants. When the stress was reversed by rewatering, the protein quantity per grain was lower compared to stressed plants, but higher than the control. At the soft dough stage, however, there were no differences between treatments. (table 3).
The SDS-PAGE protein patterns of grains at the watery ripe stage did not show notable changes in the storage protein subunits (figure 3A). However, protein patterns at the milk stage differed in terms of relative mobility and band intensity between treatments. An evident difference in HWM-GS
subunits and ω gliadins was observed in stressed samples
compared to well-watered ones (figure 3B). First, there was an increment in the color intensities of the bands of apparent molecular mass between 105 kDa and 87.5 kDa. Second,
3 new bands appeared with an apparent molecular mass of 108.5 kDa and 84.8 kDa corresponding to HWM-GS
subunits and 63 kDa corresponding to ω gliadins. This is
consistent with the increase in protein content per grain (1.17
mg.grain-1) for stressed plants compared to the control plants
(0.99 mg.grain-1). Rewatering partially reversed the stress
effect, decreasing the protein content per grain (1.01 mg.grain
-1). The SDS-PAGE results showed that at the soft dough stage
the treatments did not modify the protein patterns. The band at 108.5 kDa was observed in all treatments (figure 3C). In the water stress treatment, bands with apparent molecular mass between 105 kDa and 84 kDa (HWM-GS subunits) and
between 63 kDa and 58 kDa (ω gliadins subunits), that were
DISCUSSION
The results presented in this work indicate that the grain filling data for wheat varied significantly when water stress was imposed at different times during the grain filling period. It is known that water stress during the grain filling period does not change the grain number. However, our
Figure 2. Logistic function representing changes in dry mass during wheat grain filling. A. Watery ripe stage. Wc: Control;
Ws1: Water stress; Wr1: Rewatering; B. Milk stage. Wc:
Control; Ws2: Water stress; Wr2: Rewatering; C. Soft dough
stage. Wc: Control; Ws3: Water stress; Wr3: Rewatering.
Arrows indicate the moment of water stress. Symbols and vertical bars represent observed means ± standard errors.
Figure 3. Protein patterns of polyacrylamide gel electrophore-sis in the presence of sodium dodecyl sulfate (SDS-PAGE) of wheat grain. A: Watery ripe stage. B: Milk stage. C: Soft dough stage. Line 1, Control; Line 2, Water stress; Line 3, Rewatering; Line 4, apparent molecular mass markers (kDa);
marker [>] indicates position of new bands at the
correspond-ing stage. a, HWM-GS; b, ω gliadin; c, LWM-GS.
experiments show that water stress did affect grain setting when imposed only a few days after anthesis (watery ripe stage), probably due to the abortion of the upper spikelets of the spike. Saini and Aspinall (1981) found that drought conditions led to the death of the floret and this occurs at the terminal and basal floret of the spike, probably due to
male sterility caused by water stress. Kobata et al (1992) found that water deficit imposed when plants were at 50 % anthesis markedly affected grain yield. They concluded that this reduction resulted from a diminished grain size, but not grain number, indicating that water deficit did not affect floret abortion. Our results are in disagreement with those of Kobata et al. (1992), since we found that the water stress at the watery ripe and milk stages significantly decreased the yield components (1000-kernel weight, final grain mass and grain number per spike). At maturity, the grain dry mass of plants subjected to water stress at the watery ripe stage was approximately 47% lower than for the control. This was due to a 24 % reduction in the rate of grain filling and a 20 % reduction in the duration of grain filling. Aggarwal and Sinha (1984) and Wardlaw and Willenbrink (2000) concluded that drought following heading has little effect on the rate of grain filling, but its duration (time from fertilization to maturity) is shortened and grain dry mass at maturity is reduced. Moreover, Altenbach et al. (2003) reported that high temperatures and drought shorten the period between anthesis and harvest maturity.
The logistic model, used to describe grain growth over the entire grain filling period, provided a good fit to the grain filling data for all the treatments used in these experiments. In our study, it was demonstrated that water stress imposed at the lag phase (watery ripe stage) produced significant variations in grain growth curves, principally for the duration and slope of the linear phase as well as for the final grain dry mass. When the plants were submitted to water stress at the beginning of the linear phase (milk stage), the duration and slope of the linear phase were similar to those for well-irrigated plants, though the final dry grain mass was smaller than for the control. Li et al. (2000) reported a longer lag phase under well-watered in comparison with water-limited conditions, associated with larger kernel weight. Anderson et al. (1985) determined that while the number of cells in the endosperm is established during the lag phase, one or two weeks after anthesis the grain begins to accumulate starch and protein rapidly, increasing its dry mass in a nearly linear manner. If water stress occurs during the lag phase, the final grain mass decreases mainly as a consequence of the smaller number of cells formed in the endosperm. If the drought occurs at the beginning of the linear phase, diminished synthesis and translocation of photoassimilates due to premature leaf senescence leads to a reduction in the accumulation of starch and, consequently, there is a decrease in yield (Al-Khatib and Paulsen, 1984;
Karim et al., 2000). In contrast, if stress occurs at the end of the linear phase, when starch and protein accumulation is almost concluded, there is no effect on the final yield. On the other hand, our data show that rewatering can partially reverse the drought stress effect when applied at the watery ripe stage, or completely, when applied at the milk stage.
Blum et al. (1991) and Wardlaw and Willenbrink (2000) found that the response to drought was the earlier mobilization of non-structural reserve carbohydrates from the stem and leaf sheaths, which is responsible for the formation of most of the grain dry mass at maturity. Moreover, the decline
in net CO2 exchange of the leaves, stems and ears of wheat
following anthesis is accelerated under drought. Our results show that the loss of chlorophyll, the decrease in leaf protein content and the increase in leakage of cell solutes, each an indicator of senescence in green tissues, were promoted by water stress, as reported previously (Baisak et al., 1994; Beltrano et al., 1994; Beltrano et al., 1999). Moreover, Pinter et al. (1996) found that the leaf senescence occurred 2 or 3 weeks later under well-watered conditions in comparison with drought-stressed plants. Furthermore, our data demonstrate that rewatering maintained the chlorophyll and protein content in flag leaves and, consequently, premature ear senescence was prevented.
It has been reported that drought imposed a few days after anthesis increased total grain protein, and this was not completely reversed by rewatering (Beltrano et al., 1999). Under these conditions, the deposition of starch is more sensitive than the deposition of protein. An increase in the percentage of grain protein may occur without an increase in protein content per se (Morgan and Riggs, 1981; Brooks et al., 1982). Water stress at post-anthesis may cause the premature cessation of starch deposition. In contrast, protein accumulation appears largely unaffected, such that an increase in grain protein percentage may result (Bhullar and Jenner, 1985; Jenner et al., 1991). In the field, protein and starch deposition during grain filling do not occur simultaneously; the rate of protein accumulation may reach its peak before that of starch, and may decline earlier (Herzog and Stamp, 1983). This difference in the pattern of deposition has been used to explain a higher percentage of grain protein under unfavorable environmental conditions that shorten the duration of grain filling period.
The protein content per grain increased in response to post-anthesis drought. The levels of HMW-GS subunits and
ω gliadins increased proportionally with protein content.
gliadins, analysed by SDS-PAGE, were synthesized and accumulated during the initial stages of grain development, between 5-8 days after anthesis. As the grain matures, additional protein and an increase in the absolute quantity of these fractions were detected, as found by Benetrix et al., 1994; Gupta et al., 1996 and Rhazi et al., 2003. During the late stages of grain development, the soluble polymeric proteins, formed during early stages, polymerize into insoluble polymeric proteins of high molecular weight. At these stages, significant changes in the distribution of polymer size have been observed. The increase in the rate of large polymer formation coincides with an increment in the quantity of HMW-GS and LMW-GS subunits (Gupta et al., 1996; Daniel and Triboï, 2002; Rhazi et al., 2003). Daniel and Triboï (2002) showed that under water stress conditions, modifications in insolubilisation and oxidation properties appeared early. Drought modified the onset of the rapid insolubilisation protein. Ours results demonstrate that during the accumulation period, the composition of the glutenin subunits was modified, with a significant increment in HMW-GS. When a water stress occurred a few days after anthesis, these modifications appeared earlier and an increase in the relative proportion of these fractions was found. This is in agreement with Panozzo et al. (2001) who found that the proportion of highly polymeric glutenin was greater for the non-irrigated environment. Indeed, drought conditions would produce an earlier accumulation of HMW-GS and ω gliadins subunits, that would aggregate at later stages.
Acknowledgments: The authors would like to thank O. Peluso and L. Wanhan (CONICET) for technical assistance, M.C. Ferragine for the abstract translation to Portuguese, Prof. S. Fasano for statistical assistance, Prof. A. Buckar for English correction, and the Universidad Nacional de La Plata, FONCYT and CICBA for financial support.
REFERENCES
Aggarwal PK, Sinha SK (1984) Effect of water stress on grain growth and assimilate partitioning in two cultivars of wheat contrasting in their yield stability in a drought-environ-ment. Ann. Bot. 53:329-340.
Al-Khatib K, Paulsen GM (1984) Mode of high temperature injury to wheat during grain development. Physiol. Plant. 61:363-368.
Altenbach SB, DuPont FM, Kothari KM, Chan R, Johnson EL, Lieu D (2003) Temperature, water and fertilizer influ-ence the timing of key events during grain development in a US spring wheat. J. Cereal Sci. 37:9-20.
Anderson PM, Oelke EA, Simmons SR (1985) Growth and development guide for spring barley. Univ. Minnesota Ag-ric. Ext. Folder. www-F0-02547.
AOAC (Association of Official Analytical Chemists) (1984) Official Methods of Analysis of the Association of Official
Analytical Chemists. 4th edn. Washington DC, USA.
Baisak R, Dharanidhar R, Patel BBA, Manoranjan K (1994) Alteration in the activities of active oxygen-scavenging enzymes of wheat leaves subjected to water stress. Plant Cell Physiol. 35:489-495.
Beltrano J, Carbone A, Montaldi ER, Guiamet JJ (1994) Eth-ylene as promoter of wheat grain maturation and ear se-nescence. Plant Growth Regul. 15:107-112.
Beltrano J, Montaldi ER, Bartoli C, Carbone A (1997)
Emis-sion of water ethylene in wheat (Triticum aestivum L.) ears:
effects of rewatering. Plant Growth Regul. 21:121-126. Beltrano J, Ronco MG, Montaldi ER (1999) Drought stress
syndrome in wheat is provoked by ethylene evolution im-balance and reversed by rewatering, aminoethoxyvinyg-lycine or sodium benzoate. J. Plant Growth Regul. 18:59-64.
Beltrano J, Ronco MG, Arango MC, Montaldi ER (2000)
Grain filling and grain protein deposition in wheat (
Triti-cum aestivum L.) under water stress conditions. Effect of the rewatering. In: Abstracts of the 6th International Wheat Conference. Budapest, Hungria, pp. 205.
Benetrix F, Kaan F, Autran JC (1994) Changes in protein complexes of durum wheat in developing seed. Crop Sci. 34:462-468.
Bhullar SS, Jenner CF (1985) Differential responses to high temperatures of starch and nitrogen accumulation in the grain of four cultivars of wheat. Aust. J. Agric. Res 12: 363-375.
Blum A, Pnuel Y (1990) Physiological attributes associated with drought resistance of wheat cultivars in a Mediterra-nean environment. Aust. J. Agric. Res. 41:799-810. Blum A, Shpiler G, Gonal G, Mayer J, Sinmena B (1991) Mass
selection of wheat for grain filling without transient pho-tosynthesis. Euphytica 54:111-116.
Blum A (1996) Crop responses to drought and the interpreta-tion of adaptainterpreta-tion. Plant Growth Regul. 20:135-148. Bradford MM (1976) A rapid and sensitive method for the
quantitation of microgram quantities of protein utilizing the principle of protein-dye binding. Anal. Biochem. 71: 248-254.
Brocklehust P (1977) Factors controlling grain weight in wheat. Nature 266:348-349.
Brooks A, Jenner CF, Aspinall D (1982) Effects of water def-icit on endosperm starch granules and on grain physiology of wheat and barley. Aust. J. Plant Physiol. 9:423-436. Daniel C, Triboï E (2002) Changes in wheat protein
aggre-gation during grain development: effects of temperatures and water stress. Eur. J. Agron. 16:1-12.
Duguid SD, Brûlé-Babel AL (1994) Rate and duration of grain
filling in five spring wheat (Triticum aestivum L. )
geno-types. Can. J. Plant Sci. 74:681-686.
Gupta RB, Masci S, Lafiandra D, Bariana HS, Mac Ritchie F (1996) Accumulation of protein subunits and their pol-ymers in developing grains of hexaploid wheats. J. Exp. Bot. 47:1377-1385.
Herzog H, Stamp P (1983) Dry matter and nitrogen accumu-lation in grain at different ear positions in ”Gigas” semid-warf and normal spring wheat. Euphytica 32:511-520. Hunt L, van der Poorten G, Pararajasimgham S (1991)
Postan-thesis temperature effects on duration and rate of grain fill-ing in some winter and sprfill-ing wheat. Can. J. Plant Phys-iol. 71:609-617.
Innes P, Blackwell I (1981) The effect of drought on the wa-ter use and yield of two spring wheat genotypes. J. Agric. Sci. 96:603-610.
Jenner CF, Ugalde TD, Aspinall D (1991) The physiology of starch and protein deposition in the endosperm of wheat. Aust. J. Plant Physiol. 18:211-226.
Karim A, Hamid A, Rahman S (2000) Grain growth and yield performance of wheat under subtropical conditions: II. Effect of water stress at reproductive stage. Cereal Res. Commun. 28:101-107.
Kobata T, Palta JA, Turner NC (1992) Rate of development of post-anthesis water deficits and grain filling of spring wheat. Crop Sci. 32:1238-1242.
Laemmli U (1970) Cleavage of structural proteins during the assembly of the head of bacteriophage T4. Nature 227: 681-685.
Li A, Hou Y, Wall GW, Trent A, Kimball BA, Pinter PJ Jr
(2000) Free-air CO2 enrichment and drought stress effects
on grain filling rate and duration in spring wheat. Crop Sci. 40:1263-1270.
Loss S, Kirby E, Siddique K, Perry M (1989) Grain growth and development of old and modern Australian wheats. Field Crops Res. 21:131-146.
Morgan AG, Riggs TJ (1981) Effects of drought on yield and on grain and malt characters in spring barley. J. Sci. Food Agric. 32:339-346.
Morn R, Porath D (1980) Chlorophyll determination in in-tact tissues using N,N-dimethylformamide. Plant Physi-ol. 65:478-479.
Panozzo JF, Eagles HA (1999) Rate and duration of grain filling and grain nitrogen accumulation of wheat cultivars grown in different environments. Austr. J. Agric. Res. 50: 157-162.
Panozzo JF, Eagles HA, Wootton M (2001) Changes in pro-tein composition during grain development in wheat. Aus-tr. J. Agric. Res. 52:485-493.
Pinter PJ, Kimball BA, Garcia RL, Wall GW, Hunsaker DJ,
Lamorte RL (1996) Free-air CO2 enrichment: Responses
of cotton and wheat crops. In: G Koch and H Mooney (eds), Carbon dioxide and the terrestrial ecosystem, pp.215-249. Academic Press, Sn Diego, USA.
Rhazi L, Cazalis R, Aussenac T (2003) Sulfhydryl-disulfide changes in storage proteins of developing wheat grain: in-fluence on the SDS-unextractable glutenin polymer for-mation. J. Cereal Sci. 38:3-13.
Saini HS, Aspinall D (1981) Effect of water deficit on
spo-rogenesis in wheat (Triticum aestivum L.). Ann. Bot. 43:
623-633.
Shpiler L, Blum A (1991) Heat tolerance for yield and its components in different wheat cultivars. Euphytica 51: 257-263.
Sofield I, Evans LT, Cook MG, Wardlaw IF (1977) Factors influencing the rate and duration of grain filling in wheat. Aust. J. Plant Physiol. 4:785-797.
Triboi E, Triboi-Blondel AM (2001) Environmental effects on wheat grain growth and composition. Aspects App. Biol. 64:91-101.
Wardlaw IF, Willenbrink J (2000) Mobilization of fructan reserves and changes in enzyme activities in wheat stems correlate with water stress during kernel filling. New Phy-tol. 148:413-422.
Wheeler T, Hong T, Ellis R, Batts G, Morrison J, Hadley P (1996) The duration and rate of grain growth, and harvest
index of wheat (Triticum aestivum L.) in response to
tem-perature and CO2. J. Exp. Bot. 47:623-630.
Zahedi M, Jenner CF (2003) Analysis of effects in wheat of high temperature on grain filling attributes estimated from mathematical models of grain filling. J. Agric.Sci. 141:203-212.