Available online at http://www.anpad.org.br/bar
BAR, v. 2, n. 2, art. 5, p. 63-78, july/dec. 2005
Objective Tests and Their Discriminating Power in Business
Courses: a Case Study
Edgard B. Cornachione Jr.*
E-mail address: [email protected]
Faculdade de Economia, Administração e Contabilidade - Universidade de São Paulo São Paulo, SP, Brazil
A
BSTRACTEvaluating students’ learning experiences outcomes cannot be considered a simple task. This paper aims at investigating students’ overall performance and the discriminating power of particular tests’ items in the context of business courses. The purpose of this paper is to contribute with this issue while analyzing it, with scientific approach, from an accounting information systems standpoint: two experiments based on a database management system (DBMS) undergraduate course, involving 66 and 62 students (experiments E1 and E2, respectively). The discriminant analysis generated discriminant functions with high canonical correlations (E1= 0.898 and E2= 0.789). As a result, high percentages of original grouped cases were correctly classified (E1= 98.5% and E2= 95.2%) based on a relatively small number of items: 7 out of 22 items from E1 (multiple-choice), and 3 out of 6 from E2 (short-answer). So, with only a few items from the analyzed instruments it is possible to discriminate “good” or “bad” academic performance, and this is a measure of quality of the observed testing instruments. According to these findings, especially in business area, instructors and institutions, together, are able to analyze and act towards improving their assessment methods, to be of minimum influence while evaluating students’ performance.
Key words: objective tests; assessment; performance; discriminant analysis; item analysis.
Received 15 October 2004; received in revised form 05 December 2004.
Copyright © 2005 Brazilian Administration Review. All rights reserved, including rights for
translation. Parts of this work may be quoted without prior knowledge on the condition that
the source is identified.
* Corresponding author: Edgard B. Cornachione Jr.
I
NTRODUCTIONA part of formal education is represented by efforts of getting to know the results of students’ learning experiences. In this sense, assessment represents a relevant branch of educational research, mainly because evaluating and measuring the outcomes of students’ learning experiences is not a simple task.
Individuals participating in a specific educational environment, especially of higher education, naturally share its culture and values. In this sense, institutions and their direct representatives, instructors, usually rely on tests as an objective and reliable way of dealing with assessment issues, and students are accustomed to this practice.
However, students’ performance may be influenced by several factors, including subject matter, attendance, study time, motivation, method, pressure, external activities etc. Considering this approach, one of these influencing factors, focused on in this paper, is the type and quality of the instrument adopted for testing purposes by instructors and institutions.
The Problem
The number of students participating in formal higher education environments (colleges, universities etc.) and the quality pursued by these institutions require assessment alternatives which combine different approaches and instruments (Ratcliff et al., 1996).
In some settings, tackling an increasing number of students per class is not a simple task for instructors. In this sense, testing instruments receive instructor’s attention as a relevant tool while tracking each student’s performance throughout the course.
Although relying on objective testing instruments may not give the same deep perception gained through other assessing alternatives (e.g., projects, presentations), these objective instruments still bear the characteristic of being useful while dealing with large numbers of participants at the same time, and sometimes they stand as part of the formal procedure of a variety of higher education institutions.
But it is important to stress that when appropriately prepared, objective instruments can fulfill assessing requirements with high quality: “Even multiple-choice tests can be organized in ways that assess understanding” (Bransford, Brown, & Cocking, 2000, p. 140).
Depending on the subject matter there are several distinct ways of assessing a student’s learning experience outcomes (e.g., social sciences, engineering, biological etc.). But, this paper focuses on a particular area of business: accountancy. Furthermore, it focuses on a particular branch, related to management systems: a database management systems (DMBS) course within an accounting undergraduate program.
Considering this, while adopting objective instruments to assess students’ performance, institutions and instructors must be aware of the quality and reliability of these instruments. Otherwise, the final results (students’ performance) may be influenced by the instrument itself, which could lead to a biased assessment. This kind of assessment issue is a major concern within this higher education context, and an alternative way to provide help to this problem is analyzing and improving objective testing instruments.
This problem was observed within a particular scenario at one of the most important universities in Brazil, which is a public institution: the University of Sao Paulo (USP). Furthermore, this kind of situation can be found in other similar higher education settings, which represents the relevance of this type of study.
The importance of this research can be stressed considering the accountancy area: USP has a distinguished position, due to the fact that it offers the sole Brazilian doctorate program in accounting, and one of the few masters’ programs in this area (the top-ranking one).
Purpose and Goals
This paper aims to investigate students’ overall performance and the discriminating power and condition of particular test items within a specific context of the business field (accountancy), at the University of Sao Paulo (Brazil).
This objective is tied to the fact that, considering business courses, some instructional methods are not discussed on a regular basis (with certain exceptions), mainly those of assessment. Thus, the purpose of this paper is to contribute to this issue while analyzing it, with a scientific approach, from an accounting information systems standpoint.
The dissemination of this kind of procedure, among instructors, institutions, and researchers in this area, may influence better assessment approaches, and, also, more reliable, valid and powerful testing instruments.
Research Questions
The research questions present in this paper, considering undergraduate accounting students, within the same DBMS course at University of Sao Paulo (Brazil), are presented next:
. RQ1: Are there significant differences between students’ performance (grade) while comparing
specific assessment instruments (tests) of the same experiment?
. RQ2: Are there significant correlations between performance (grade) and specific items (questions)
from tests?
. RQ3: Are there items (questions) of the same experiment with more discriminating power (DP) than
others?
. RQ4: Is there a discriminating function for each assessment instrument, with good classifying
conditions?
L
ITERATURER
EVIEWAssessment is a relevant aspect of the educational process, not only focusing on what students have learned, but also supporting their learning experiences. According to Bransford et al. (2000, p. 244) “assessment and feedback are crucial for helping people learn”.
Another way of facing assessment in the learning context is through linking it to performance. As registered by Gagné (1985, p. 255): “the performance that accompanies the learning of new capability is simply a verification that learning has occurred”.
In this sense, instructors usually rely on assessment to give feedback to their students as well as to have more objective information on how students are doing in the class. Accordingly, instructors use formative and summative assessment instruments and solutions in an intertwined way to achieve these basic goals.
While discussing formative and summative assessment, Anderson and Krathwohl (2001, p. 245) present their concepts, respectively: “teachers assess students for two basic reasons: (1) to monitor student learning and make necessary adjustments in instruction … and (2) to assign grades to students following some period of instruction”.
According to the authors, summative evaluation is more formal, involving instruments such as tests, projects and term papers because instructors tend to be more comfortable with this “objective” means while formally assigning grades to their students.
On the other hand, while discussing authentic assessment, Zeliff and Schultz (1996, p. 87) criticize common objective assessment means such as true/false, multiple-choice, and short-answer questions:
these measures are appropriate for evaluating lower level cognitive learning but often give a choice of answers. Choices give students the opportunity to rely on the probability of selecting the correct answer. Objective evaluation may not, therefore, be an accurate means of assessment. (Zeliff & Schultz, 1996, p. 87)
However, these authors (Zeliff & Schultz, 1996, p. 88) while discussing assessment strategies within some fields stated that “in accounting, authentic assignments are hard to find”. Thus, challenging assessment methods, beyond objective instruments, would be welcome if well planned by instructors, and bearing the institution’s support.
Two major concerns when discussing assessment issues may be considered: validity and reliability. As declared by Zeliff and Schultz (1996, p. 88): “Validity in assessment refers to the degree to which the results (scores) represent the knowledge or ability intended to be measured… Reliability measures refer to the consistency of the measurement over time and/or by multiple evaluators”. But, connecting these quality measures with tests while discussing the evolution of assessment, Mundrake (2000, p. 41) stresses that tests can bear these conditions of reliability and validity: “Properly constructed tests can be highly reliable and valid measurements of student performance; however, they are difficult to construct and even more difficult to maintain and interpret”.
Considering this particular context (reliability and validity of tests) we may find the connection to the problem focused on by this paper. Especially within this business area (in this case, accountancy), instructors also face this problem of assigning grades to their students, and, in order to do so, they may utilize some formal and objective testing instrument as part of the overall grade.
Thus, a good testing instrument may be part of the assessment process. However, to construct a good testing instrument and to be conscious about its effectiveness, while measuring the students’ learning experience, requires instructors not only to prepare a test, but also to check and improve their instruments (Dodds, 1999).
The idea is to count the number of correct answers from the two groups of students (higher and lower overall scores) reaching the DP value (see Figure 1). This value will range from -1 to +1. According to Matlock-Hetzel (1997) “the higher the DP, the better the item because such a value indicates that the item discriminates in favor of the upper group.”
Figure 1: Discriminant Power
However, the discriminant power (DP) may be considered a basic indicator of an item’s quality. A more robust analysis may be used in order to help determining the item’s discriminating condition. This paper uses a set of statistical procedures (e.g., correlations, discriminating power, and discriminating analysis) to reach a conclusion on the discriminating aspects of test items.
R
ESEARCHM
ETHODThis research was developed considering quantitative methods (Muijs, 2004, p. 1-4), and all primary data were collected through direct measurement (Rea & Parker, 1997, p. 2-3).
In order to achieve the established goals, this research relies on data collected during the second academic semester of 2003, when two different experiments were developed with the same group of students from a selected course (database management system within the accounting undergraduate program).
The first experiment involved a long test (22 items) relying on multiple-choice items, with a regular-to-difficult level of questions. The second experiment was a short (6 items) test, based on short-answer questions, with regular-to-easy questions. Experiment 1 was conducted by the middle part of the course, and Experiment 2 by the end of the course.
It is important to mention that for each experiment two different sets of tests were prepared and randomly distributed to the students (students answered only one test of each experiment).
Datasets and Statistical Procedures
Considering Experiment 1 (multiple-choice approach, regular-to-difficult level, and long), the number of participating students was 66. In this case, two equivalent tests were prepared (Test 1 and Test 2) involving 22 similar items (questions). The dataset here consists of 22 answers and the overall performance (grade), for each participating student.
The number of participating students in Experiment 2 (short-answer questions approach, regular-to-easy level, and short) was 62. Again, two equivalent tests were prepared (Test 1 and Test 2) involving 6 similar items (questions). This dataset consists of 6 answers and the overall performance (grade), for each participating student.
(
)
⎟
⎠
⎞
⎜
⎝
⎛
−
=
2
n
n
n
After collecting the data, quantitative methods and statistical procedures were employed in order to support the analysis. All calculations and statistical tests were developed with SPSS® (version 11.0) adopting the 0.05 significance level (α = 0.05).
Besides the discriminant power index (DP), the main statistical procedures used in this study were: Descriptive Statistics, Correlation Analysis (Pearson and Spearman), Analysis of Variance (ANOVA), and Discriminant Function Analysis.
Preliminary Normality Tests
A set of preliminary tests was performed in order to evaluate dataset quality, mainly in terms of the normality assumptions required by parametric statistical procedures.
Analyzing the collected data, it was possible to observe that the Kolmogorov-Smirnov normality test (Levin & Rubin, 1997, p. 832-834) conducted with the dependent variable grade (score) indicated a good approximation to the normal distribution (see Table 1).
Table 1: Normality Tests (Kolmogorov-Smirnov): “Grade”
Experiment 1 Experiment 2
Tests 1 and 2: 0.079* (p=0.200; n=66) 0.106* (p=0.083; n=62)
* - Significant at the 0.05 level.
When analyzing the data, splitting tests of each experiment, it was possible to observe that the dependent variable grade (score) also passed this specific normality test (see Table 2), with even better indicators.
Table 2: Normality Tests (Kolmogorov-Smirnov): “Grade”
Experiment 1 Experiment 2
Test 1: 0.093* (p=0.200; n=33) 0.155* (p=0.056; n=31) Test 2: 0.120* (p=0.200; n=33) 0.133* (p=0.173; n=31)
* - Significant at the 0.05 level.
These results support the decision of adopting parametric statistical procedures while conducting the planned analyses of this research.
D
ATAA
NALYSISAs mentioned, each experiment considered two similar tests (Test 1 and Test 2), with the same type of questions and complexity level. Tests were randomly distributed to the students, in such a way that each student took only one test for each experiment.
Descriptive Statistics
Table 3: Descriptive Statistics
Mean Std.Dev. Median n
Grade (% score)
Experiment 1 0.6006 0.1485 0.6042 66
Experiment 2 0.7010 0.1952 0.7143 62
These scores stress the difficulty level of each experiment: Experiment 1 (regular-to-difficult) with an average score of 60.06% of average score, and Experiment 2 (regular-to-easy) with an average score of 70.01%. It is worth stating that the multiple-choice experiment (Experiment 1) bears a lower standard deviation (0.1485) when compared to that of the short-answer questions (0.1952).
Comparison of Grades
After computing the descriptive statistics from the collected data, the percentage scores of each testing instrument were submitted to an analysis of variance (ANOVA) procedure (Pagano, 2001, p. 348-367). This procedure was used in order to test the existence of statistically significant differences between the grades from each test in the same experiment.
The overall score (percentage) for experiment 1 was 60.06%, and the average scores for each of its tests were: 0.5922 (Test 1) and 0.6091 (Test 2). Table 4 presents the results of ANOVA based on data from tests 1 and 2 of Experiment 1.
Table 4: ANOVA (Experiment 1)
Sum of
Squares
df Mean Square
F Sig.
GRADE Between Groups
.005 1 0.005 0.212 0.647
Within
Groups
1.428 64 0.022
Total 1.433 65
Table 4 shows no significant differences between grades (scores) from tests 1 and 2, in this experiment (p>0.05). Moreover, in this case, the significance value (p=0.021) of the Levene statistic (5.564) does not exceed the 0.05 level, suggesting that the variances of both tests are not equal (homogeneity-of-variance assumption failure).
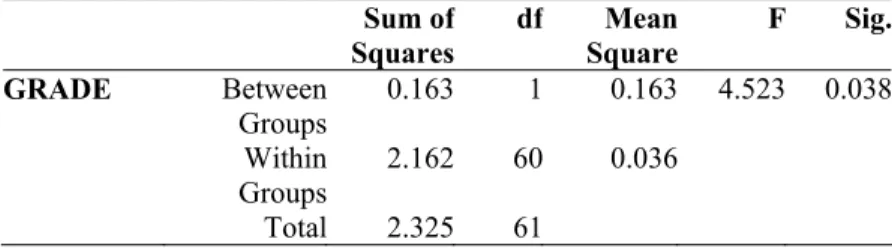
Considering Experiment 2, the overall score (percentage) was 70.10%, and the average scores for each of its tests were: 0.6498 (Test 1) and 0.7523 (Test 2). Table 5 presents the results of ANOVA based on these data from tests 1 and 2 of Experiment 2.
Table 5: ANOVA (Experiment 2)
Sum of Squares
df Mean Square
F Sig.
GRADE Between Groups
0.163 1 0.163 4.523 0.038
Within Groups
2.162 60 0.036
Considering Experiment 2, Table 5 shows a significant difference between the scores from test 1 and 2 (p<0.05). In addition, the significance value (p=0.958) of the Levene statistic (0.003) exceeds the 0.05 level, suggesting that the variances of both tests are equal (homogeneity-of-variance), in this case.
So, considering Experiment 2, depending on the test, students would raise the chances of getting better grades (instrument influence). This effect was not observed in Experiment 1.
Correlations
Considering this dataset, correlations (Moore, 1997, p. 84-88) were computed in order to find whether specific items of each test instrument correlate to students’ overall performance (grade).
Both parametric (Pearson’s r) and nonparametric (Spearman’s rho) correlations were calculated, due to the fact that distributions of some independent variable (tests’ items) did not present strong evidence to satisfy the normality distribution assumption. But, this analysis is primarily focusing on the Pearson’s r coefficient of correlation, because both methods presented extremely similar results.
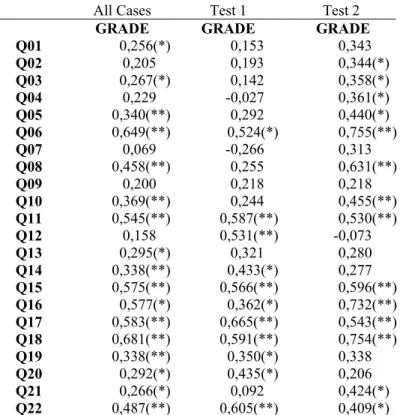
Table 6, presented next, shows all the coefficients of correlations (questions and grade) under three specific conditions: (a) all cases together, (b) only cases from Test 1 (n= 33), and (c) only cases from Test 2 (n= 33).
Table 6: Questions (Items) & Grade (Score) – Experiment 1
All Cases Test 1 Test 2
GRADE GRADE GRADE
Q01 0,256(*) 0,153 0,343
Q02 0,205 0,193 0,344(*)
Q03 0,267(*) 0,142 0,358(*)
Q04 0,229 -0,027 0,361(*)
Q05 0,340(**) 0,292 0,440(*)
Q06 0,649(**) 0,524(*) 0,755(**)
Q07 0,069 -0,266 0,313
Q08 0,458(**) 0,255 0,631(**)
Q09 0,200 0,218 0,218
Q10 0,369(**) 0,244 0,455(**)
Q11 0,545(**) 0,587(**) 0,530(**)
Q12 0,158 0,531(**) -0,073
Q13 0,295(*) 0,321 0,280
Q14 0,338(**) 0,433(*) 0,277
Q15 0,575(**) 0,566(**) 0,596(**)
Q16 0,577(*) 0,362(*) 0,732(**)
Q17 0,583(**) 0,665(**) 0,543(**)
Q18 0,681(**) 0,591(**) 0,754(**)
Q19 0,338(**) 0,350(*) 0,338
Q20 0,292(*) 0,435(*) 0,206
Q21 0,266(*) 0,092 0,424(*)
Q22 0,487(**) 0,605(**) 0,409(*)
Obs.: Correlation is significant at the 0.05 (*) or 0.01 (**) level.
It is important to stress the fact that, when only cases from Test 1 were considered, questions 04 and 07 presented negative correlations to the grade (score). Another negative correlation was also found (question 12) cases from Test 2. However, these negative correlations could not be considered significant (all p-value are above 0.05).
According to Table 6, it is also interesting to note that when analyzed independently, tests 1 and 2 present different correlation conditions: Test 2 has 14 significant correlations, while Test 1 has 11. Also, when analyzed together (tests 1 and 2), cases from Experiment 1 presented 17 significant correlations.
Analyzing the coefficients of correlations from Experiment 2, all questions presented significant correlations to grade. When analyzing cases from Test 2, only question number 6 did not present significant correlations to test grade (see Table 7).
Table 7: Questions (Items) & Grade (Score) – Experiment 2
All Cases Test 1 Test 2
GRADE GRADE GRADE
Q01 0,466(**) 0,453(*) 0,466(**)
Q02 0,652(**) 0,616(**) 0,649(**)
Q03 0,689(**) 0,667(**) 0,709(**)
Q04 0,407(**) 0,381(*) 0,396(*)
Q05 0,720(**) 0,671(**) 0,774(**)
Q06 0,374(**) 0,443(*) 0,331
Obs.: Correlation is significant at the 0.05 (*) or 0.01 (**) level.
The lowest significant correlation, considering all tests from Experiment 2 together (tests 1 and 2), was 0.374 (question 6), and the highest coefficient was 0.720 (question 5), indicating the observed range.
Based on these computed correlations it is possible to analyze the variation of grade along with the variation of specific question scores. This is still a part of the analysis focusing on the quality of test items.
Discriminant Power
As mentioned before, the discriminant power (DP) represents a key quality indicator of test items. Considering the DP values for each item, it is possible to know which question is more appropriate when discriminating good and bad performance.
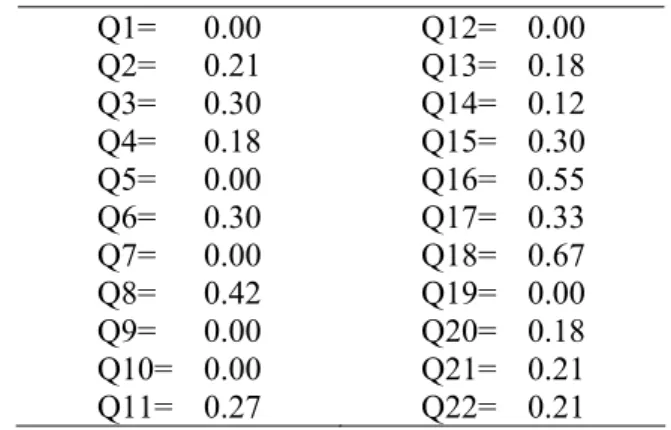
Based on the dataset of this research, all discriminant power values for Experiment 1 were computed and are shown in Table 8.
Table 8: Discriminant Power Values (Experiment 1)
Q1= 0.00 Q2= 0.21 Q3= 0.30 Q4= 0.18 Q5= 0.00 Q6= 0.30 Q7= 0.00 Q8= 0.42 Q9= 0.00 Q10= 0.00 Q11= 0.27
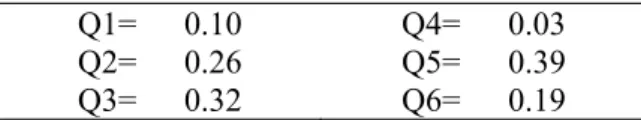
The same procedure was developed considering data from Experiment 2, and the discriminant power values are reproduced in Table 9.
Table 9: Discriminant Power Values (Experiment 2)
Q1= 0.10 Q2= 0.26 Q3= 0.32
Q4= 0.03 Q5= 0.39 Q6= 0.19
Considering experiments 1 and 2, it is important to highlight that no negative discriminant power indicator was found. The highest DP value in Experiment 1 was 0.67 (question 18), and in Experiment 2 it was 0.39 (question 5).
But, in order to precisely find the relevant questions of each testing instrument, with certain statistical confidence, another statistical procedure was employed: discriminant analysis (Johnson & Wichern, 2002, p. 581-646).
Discriminant Analysis
The main objective here is to obtain a discriminant function with calculated coefficients for each independent variable (individual questions’ scores). Depending on the quality of this discriminant function, it is possible to classify (discriminate) good and bad overall performance, from specific test questions (items). This will indicate the quality of these questions with regards to students’ overall performance.
Experiment cases received the same statistical treatment, involving the manual classification of good and bad performance. The assumption here is that if the student’s grade was above the sample (experiment) score mean, it was considered good performance, and if it was below the mean, it was considered bad performance. So, a new categorical variable (independent) was created, receiving this classification information (0= bad, and 1= good performance).
After this manual classification, two methods were employed: the default discriminant analysis method (independents together), and the stepwise method. The main difference is that with the second method it is possible to generate a canonical discriminant function with only the most relevant independent variables (bearing powerful discriminating conditions).
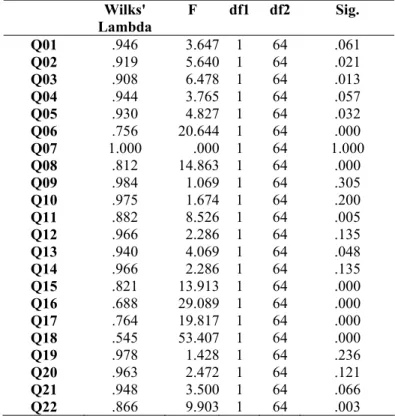
Observing the results of tests of equality of group means (Test 1 and Test 2) from Experiment 1, it is possible to note that all Wilks’ Lambda values are greater than 0.5, and close to 1 (a value of 1 indicates no group differences, so the smaller the Wilks’ Lambda, the more important the independent variable to the discriminant function).
Table 10: Experiment 1: Tests of Equality of Group Means
Wilks' Lambda
F df1 df2 Sig.
Q01 .946 3.647 1 64 .061
Q02 .919 5.640 1 64 .021
Q03 .908 6.478 1 64 .013
Q04 .944 3.765 1 64 .057
Q05 .930 4.827 1 64 .032
Q06 .756 20.644 1 64 .000
Q07 1.000 .000 1 64 1.000
Q08 .812 14.863 1 64 .000
Q09 .984 1.069 1 64 .305
Q10 .975 1.674 1 64 .200
Q11 .882 8.526 1 64 .005
Q12 .966 2.286 1 64 .135
Q13 .940 4.069 1 64 .048
Q14 .966 2.286 1 64 .135
Q15 .821 13.913 1 64 .000
Q16 .688 29.089 1 64 .000
Q17 .764 19.817 1 64 .000
Q18 .545 53.407 1 64 .000
Q19 .978 1.428 1 64 .236
Q20 .963 2.472 1 64 .121
Q21 .948 3.500 1 64 .066
Q22 .866 9.903 1 64 .003
Discriminant analysis (default method) with data from Experiment 1 generated a canonical discriminant function with a high canonical correlation (0.898), which measures the association of discriminant scores and the groups (Tatsuoka, 1971, p. 157-191).
Only one discriminant function was generated, with an engeinvalue equal to 4.170 (first canonical discriminant function). The engeinvalue is a measure of the relative relevance (quality) of each discriminant function. So, in this case, it is of relative importance, because only one function was obtained.
Analyzing the obtained discriminant function, it was possible to identify a significant (p=0.000) Wilks’ Lambda of 0.193 (close to 0, that indicates different group means), demonstrating a good function.
Next, the discriminant function for Experiment 1 is presented, with all the coefficients for each question (item):
Table 11: Experiment 1: Discriminant Function (default)
The group centroids of functions were calculated (bad performance = -2.011 and good performance = 2.011), resulting in a cut-value of 0. The centroids are the mean values of each group. After replacing the values of a specific case in this function, if the obtained score is above the cut-value (based on the centroids), the function classifies the case as part of a specific group (e.g., good performance), and if it is below this number, the case will be classified as part of the other group.
As a result of this discriminant function, 98.5% of the original grouped cases were correctly classified (only one misclassified case, among 66 cases). When loaded with data from case number 57, the function returned a score that was above the cut-value, but this case should not be classified as part of the good performance group.
In addition, based on another procedure (Stepwise), the obtained discriminant function consisted of only seven items (among all the 22 questions contained in the tests), with a canonical correlation of 0.861, and the same effectiveness (98.5% of correctly classified cases).
Again, only one discriminant function was generated, with an engeinvalue equal to 2.877 (first canonical discriminant function). Analyzing this discriminant function, it was possible to identify a significant (p=0.000) Wilks’ Lambda of 0.258 (close to 0, indicating different group means). Next, the other discriminant function is presented, based on the stepwise method, for Experiment 1:
Table 12: Experiment 1: Discriminant Function (stepwise)
027
.
4
742
.
0
787
.
1
525
.
1
205
.
1
677
.
0
960
.
0
983
.
0
−
+
+
+
+
+
+
+
=
21 18 17 16 8 3 2Q
Q
Q
Q
Q
Q
Q
y
The centroids of the groups (-1.670, bad performance, and 1.670, good performance) were calculated and, after tests, only one case (case 57) was misclassified (as occurred with the default method).
The main point is that with only these seven questions it is possible to classify students’ performance in tests as part of one of the two predefined groups: good and bad performance. In this experiment, there is no need for 22 items, because seven questions would be enough to discriminate between good and bad performance
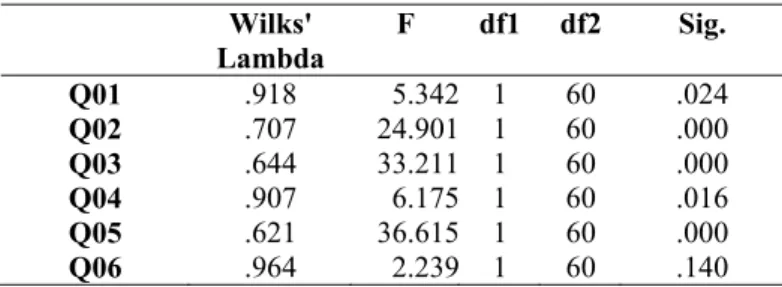
Experiment 2 received the same treatment, and the results of tests of equality of group means (Test 1 and Test 2) also presented Wilks’ Lambda values close to 1, which indicates no group differences. The lowest Wilks’ Lambda was 0.644 (question 3), and the highest was 0.964 (question 6). All questions, except question 6, have significant p-values.
Table 13: Experiment 2: Tests of Equality of Group Means
Wilks' Lambda
F df1 df2 Sig.
Q01 .918 5.342 1 60 .024
Q02 .707 24.901 1 60 .000
Q03 .644 33.211 1 60 .000
Q04 .907 6.175 1 60 .016
Q05 .621 36.615 1 60 .000
Q06 .964 2.239 1 60 .140
Wilks’ Lambda value of 0.377. The calculated group centroids were: -1.036 (bad performance) and 1.224 (good performance).
Table 14: Experiment 2: Discriminant Function (default)
746
.
4
640
.
0
052
.
2
857
.
0
504
.
1
761
.
1
440
.
0
−
+
+
+
+
+
+
=
6 5
4 3
2 1
Q
Q
Q
Q
Q
Q
y
Performing another discriminant analysis, using the stepwise method, it was possible to find a canonical discriminant function with three questions (among all the six contained in the tests), presenting a canonical correlation of 0.771, bearing 87.1% of correctly classified cases.
Only one discriminant function was generated (see Table 15), with an engeinvalue equal to 1.469, a significant (p=0.000) Wilks’ Lambda of 0.405, and groups’ centroid values of –1.231 (bad performance), and 1.154 (good performance).
Table 15: Experiment 2: Discriminant Function (stepwise)
Q
Q
Q
y
=
+
1
.
806
2+
1
.
446
3+
2
.
349
5−
3
.
277
As observed in Experiment 1, in this case it was possible to find a small number of test items responsible for most of the discrimination between good and bad performance.
This is key information because, as seen, a significant part of the studied objective tests presents no relevant contribution while measuring students’ performance. In other words, students may be facing questions (items) bearing no relevance to their learning experiences.
C
ONCLUSIONAfter all the analyses and considerations developed in this paper it is important to recall the basic research questions in order to answer them properly.
RQ1: Are there significant differences between students’ performance (grade) while comparing
specific assessment instruments (tests) of the same experiment?
Statistical tests presented no significant differences between students’ performance (scores) while comparing distinct assessment instruments (tests 1 and 2) from Experiment 1. Nevertheless, considering Experiment 2, significant differences were found between students’ grades from Test 1 and Test 2.
In this case (Experiment 2), it was possible to see that the testing instrument (directly) influenced the student’s score. Thus, there is evidence, considering the limitations of this research, to highlight the relevance of follow-up procedures to help instructors and institutions while dealing with testing instruments improvement.
RQ2: Are there significant correlations between performance (grade) and specific items (questions)
from tests?
Analyzing Experiment 2, all questions showed significant (positive) correlations (r) with grade, varying from 0.374 (question 6) to 0.720 (question 5).
This type of analysis (correlations) may act as an indicator of the quality of specific items of a given testing instrument. Both instructor and institution may improve assessment instruments by replacing the bad items (those without significant correlations, or bearing low significant correlations).
RQ3: Are there items (questions) of the same experiment with more discriminating power (DP) than
others?
After calculating all the discriminating power (DP) values, it was possible to find items of the same experiment with more discriminating power than others, but all the discriminant power (DP) values for Experiment 1 and 2 were positive.
In Experiment 1 the range of DP values was from 0.00 to 0.67 (question 18), and, in Experiment 2 the range was from 0.10 (question 1) to 0.39 (question 5).
This information (DP) is more specific while analyzing items from a testing instrument (e.g., when compared to correlations), and may also support instructors and institutions concerned with the quality of assessment.
RQ4: Is there a discriminating function for each assessment instrument, with good classifying
conditions?
Even considering the existence of significant correlations between several questions and grade, for each instrument analyzed here, the discriminant analysis presented a relatively small number of them bearing enough discriminant conditions: 31.8% of the items (Experiment 1), and 50% of them (Experiment 2).
This means that with only some of the questions would it be possible to discriminate students’ performance with the same effectiveness of 98.5% (Experiment 1), or with a lower, but also high, effectiveness of 87.1% (Experiment 2). In other words, 7 out of 22 items (Experiment 1), and 3 out of 6 (Experiment 2), would be enough to classify bad or good performance.
These findings reinforce the perception of instrument type and quality running between two boundaries: with items capable of discriminating good and bad performance (based on the learning experiences outcomes), and those without this kind of items or questions. And, it is also possible to observe multiple arrangements between these examples (limits), as noted here (based on the analyzed instruments).
According to these findings, especially in the business field, instructors and institutions together are able to analyze and act towards improving their assessment methods and techniques, mainly in order to be of no influence (or minimum influence) while evaluating students’ performance. In this sense, as shown throughout this paper, the instrument is relevant, deserving special attention.
The decision of adopting an objective instrument is related to the freedom of the instructor in terms of preparing and combining assessment techniques. Some educational settings, where assessment is regulated and performed by the institution (centralized), offer less flexibility to the instructor while assessing students. On the other hand, it is possible to find educational settings where the instructor bears more power in terms of combining assessment methods. In both cases, dealing with certain objective testing instruments, as part of the whole assessment dimension, it is not only a matter of choice. It brings the responsibility of acting towards students’ learning experience, what is more important than the grading itself.
solved only by the instructor. The institution should participate actively, supporting the process of ensuring quality to the whole assessment process.
In conclusion, while stating the problem focused on this paper, there is enough demand for research on this particular educational line of inquiry: assessment. Not only is it a matter of students’ outcomes, but the assessing instrument must also gather the minimum conditions to evaluate students’ learning experiences while helping them to learn.
R
EFERENCESAnderson, L. W., & Krathwohl, D. R. (Org.). (2001). A taxonomy for learning, teaching, and assessing: a revision of Bloom’s taxonomy of educational objectives. New York: Addison Wesley Longman.
Bransford, J. D., Brown, A. L., & Cocking, R. R. (Org.). (2000). How people learn: brain, mind, experience, and school. Washington, DC: National Academy Press.
Dodds, J. Writing good tests for students grading or research purposes: some basic precepts and principles. In: Meeting of the Southwest Educational Research Association, San Antonio (p. 22.). (ERIC Document: ED428114). Retrieved August 31, 2005, from http://www.eric.ed.gov.
Gagné, R. M. (1985). The conditions of learning and theory of instruction, (4th ed.). New York: CBS College.
Johnson, R. A., & Wichern, D. W. (2002). Applied multivariate statistical analysis, (5th ed). Upper Saddle River: Prentice Hall.
Kehoe, J. (1995). Basic item analysis for multiple-choice tests (p. 5). Washington, DC. (ERIC Development Team Report AE/Digest ED398237). Retrieved August 31, 2005, from http://www.eric.ed.gov.
Levin, R. I., & Rubin, D. S. (1997). Statistics for management, (7th ed.). Upper Saddle River: Prentice Hall.
Matlock-Hetzel, S. (1997). Basic concepts in item and test analysis. In: Meeting of the Southwest Educational Research Association, San Antonio (21p.). (ERIC Document: ED406441). Retrieved August 31, 2005, from http://www.eric.ed.gov.
McClave, J. T., Benson, P. G., & Sincich, T. (2001). Statistics for business and economics, (8 th ed.). Upper Saddle River: Prentice Hall.
McKeachie, W. J. (2002). Teaching tips, (11th ed.). Boston: Houghton Mifflin.
Moore, D. S. (1997). The active practice of statistics. New York: W. H. Freeman.
Muijs, D. (2004). Doing quantitative research in education with SPSS. London: Sage.
Mundrake, G. A. (2000). The evolution of assessment, testing, and evaluation. In: Rucker, J. (Org.). Assessment in business education, 38, NBEA Yearbook. Reston: NBEA.
Ratcliff, J. L. et al. (1996). Realizing the potential: improving postsecondary teaching, learning and assessment. University Park: National Center on Postsecondary Teaching, Learning, and Assessment. (ERIC Document: ED404939). (p. 55). Retrieved August 31, 2005, from http://www.eric.ed.gov.
Rea, L. M., & Parker, R. A. (1997). Designing and conducting survey research, (2nd ed.). San Francisco: Jossey-Bass.
Tatsuoka, M. M. (1971). Multivariate analysis. (pp.157-191). New York: John Wiley.