333 R. Econ. contemp., Rio de Janeiro, v. 12, n. 2, p. 333-353, maio/ago. 2008
* Article received on November 7, 2006, and approved on August 19, 2008.
** M. Sc. in Applied Economics, International Logistic Analyst, e-mail: [email protected]
*** Associate Professor, Departament of Agricultural Economics, Federal University of Viçosa, e-mail: [email protected]
THE EFFECTS OF TARIFFS ON THE WHOLE
MILK POWDER TRADE BETWEEN
BRAZIL AND ARGENTINA:
A GAME THEORETIC ANALYSIS
*Gabriel Leão Oliveira
**Wilson da Cruz Vieira
***ABSTRACT In this paper we analyzed the effects of tariffs on the whole milk pow-der trade between Brazil and Argentina from 1990 to 2004. The methodology in-cluded estimation of whole milk powder demands for Brazil and Argentina as mo-nopolists, members of Mercosul, and world exporters; and simulation of Cournot games considering the trade of this product under alternative tariff policies. The results show that although the tariff impositions create trade distortions, this kind of policy was important to protect Brazil against illegal practices of trade and to increase its competitiveness against traditional international competitors.
Key words: whole milk powder, trade, tariff, Mercosul JEL Code: F13; F15
EFEITOS DE TARIFAS NO COMÉRCIO DE LEITE EM PÓ ENTRE O BRASIL
E A ARGENTINA: UMA ANÁLISE COM TEORIA DOS JOGOS
INTRODUCTION
Over the past decades, there has been a world tendency towards the devel-opment of economic blocks motivated by the process of economic open-ness to international trade and globalization. In 1988 Brazil and Argentina set in motion a process of integration for a common market by the end of 1994. In 1992 Paraguay and Uruguay were invited to join the Southern Common Market Treaty (Mercosul). A Custom Union was created under the Ouro Preto Protocol signed in December 1994. In that occasion, the intrablock tariffs were eliminated and a Common External Tariff (CET) was instituted.
In general, the trade liberalization affects the economic sectors differen-tially in each country. In the case of Brazil, while the manufactured sector expanded its intrablock exports after the implementation of Mercosul, some agricultural/food sectors did not respond to the new situation with the speed and depth required in order to provide economic expansion, as was the case with the dairy sector.
According to Lopes (1992), at the beginning of the integration process, the dairy sector was one of the most sensitive sectors in Brazil. This vulner-ability was a consequence of the Brazilian government’s intervention in this sector for over 40 years through the control of milk prices and imports. Af-ter the liberalization of the Brazilian milk market in 1991, the production expanded to non-traditional milk producing areas, and milk production increased substantially.
The Common External Tariff for dairy products became effective in Mercosul at the end of 1994. It was accorded that the powdered milk’s CET would be gradually reduced from 32% in 1995 to 16% in 2001. However, from 1994 to 1998, the overvalued exchange rate stimulated the entrance of milk powder in Brazil. In 1995, whole milk powder (WMP) Brazilian im-ports reached the record level of 211 thousand tons, representing 105.5% of the national production. According to Sapya (2005), during the 1995-1999 period, about 72% of the Argentinean powdered milk exports was destined to Brazil.
import-ing subsidized milk from the European Union (EU) and reselling it to Brazil. In an attempt to avoid these imports at artifi cial prices, the Brazilian gov-ernment implemented changes in the dairy products trade. Milk powder entered the “exception list” of the Mercosul’s Common External Tariff. Bra-zil imposed an anti-dumping duty on milk powder imports from New Zea-land, the EU and Uruguay. Argentina negotiated a minimum export price of US$ 1,900 per metric ton for powdered milk exports to Brazil and also agreed to maintain the same tariff lines in order to avoid imports from oth-er countries entoth-ering through its toth-erritory and eventually reaching Brazil.
The main objective of this paper is to analyze the effects of tariffs on the whole milk powder trade between Brazil and Argentina under the perspec-tive of the game theory during the 1990-2004 period. Specifi cally, we esti-mated whole milk powder demands for Brazil and Argentina — as mo-nopolists, as members of Mercosul, and as world exports — and simulated sceneries considering the whole milk powder trade for Brazil and Argentina under alternative tariff policies.
In the next section, we present the methodology used in this paper. This methodology includes the trade between two countries modeled as Cournot games, the formulation of these games as mixed complementarity prob-lems, the specifi cation of demand functions to be estimated by econometric methods, and the data and procedures used in this paper. The third section presents the results and discussion. Finally, in the fourth section, we present the concluding remarks.
1. METHODOLOGY
1.1 Cournot’s duopolistic game
In a game between two countries, each country can improve its trade terms with the use of tariffs. However, in its absence, the game cannot be in the Nash Equilibrium (NE), since each country improves its payoff with the imposition of tariffs. Therefore, the NE with positive tariffs tends to be infe-rior to the situation of free trade for both countries.
In a static Cournot model, countries have to choose their output levels at the same time and cannot make credible commitments, so no one can con-vince the other that it will produce a large output. In the absence of govern-ment intervention, these countries behave as Cournot duopolists. In this paper, we made the following assumptions: the countries produce identical products, so that the sum of their outputs equals the total output; the coun-tries’ inverse demand curve is linear; and these countries produce at a con-stant marginal cost.
Consider a Cournot game between two countries with a homogeneous product. They face the following inverse demand curve:
P(Q) = a – bQ, Q = q1 + q2 (1)
where a and b are positive constants, q1 is the output of Country 1 and q2 the output of Country 2. Each country has a constant marginal cost of pro-duction, c.
Imagine that Country 1’s government imposes a specifi c tariff, t, on Country 2’s exports. Country 1’s profi t is:
∏1 =Pq1 – cq1 = aq1 – bq12 – bq1q2 – cq1 (2)
where equation (2) is obtained by substituting for P using equation (1). Since there is no use of tariffs in Country 2, its profi t is:
∏2 =aq1 – bq22– bq2q1– cq2 – tcq2 (3)
Country 1’s Cournot best-response function is determined by differenti-ating ∏1 (equation 2) with respect to q1 and setting the result equal to zero. After rearranging terms, this condition is:
q1 =(a – bq2 – c) /2b (4)
Similarly, Country 2’s best-response function is:
The Nash-in-quantities equilibrium is obtained by solving equations (4) and (5) simultaneously for q2 and q1 (the intersection of the two
best-re-sponse functions):
q1*=(a – c (1 – t)) /3b (6)
q2*=(a – c (1 +2t)) /3b (7)
The government in Country 1 sets t to maximize its welfare. In choosing
t, Country 1 must take into account the countries’ equilibrium response to t, which is given in equations (6) and (7). Thus, Country 1’s problem is:
Max t ∏1* = aq1*(t) – bq1*(t)2 – bq1*(t)q2*(t) – cq1*(t)
If we substitute q1* and q2* by their equations (6) and (7), we get:
Max t ∏1*= a[(a – c (1– t))/3b]– b[(a – c (1 – t))/3b]2 – b[(a – c (1– t))/3b]
[(a – c (1+ 2t))/3b] – c [(a – c (1– t))/3b] (8)
Rearranging the terms, we have:
Max t ∏1* = (a – c + ct)2 / 9b (9)
When coming across the tariff imposition of Country 1, the profi t maxi-mization function of Country 2 is:
Max t ∏2*= aq2*(t) – bq2*(t)2– bq2*(t) q1*(t) – cq2*(t) – tcq2*(t)
Or, equivalently, after substitution of q1*and q2* by their equations (6) and (7):
Max ∏2*= a[(a – c (1 + 2t))/3b] – b[(a – c (1 + 2t))/3b]2 – b[(a – c (1 + t
2t))/3b]
[(a – c (1 – t))/3b] – c [(a – c (1 + 2t))/3b]– tc [(a – c (1 + 2t))/3b] (10)
which can be simplifi ed to:
Max t ∏2*= (a – c – 2ct)2/9b (11)
Coun-try 2. The modeling of games between two countries presented previously can be extended in several directions. In this paper, we considered the inclu-sion of the variable income into the demand function of the players. This variable was considered exogenous in this new version of the model. As a result of that, the countries face a new inverse demand curve, that is:
P(Q) = a – bQ + dY, Q = q1 + q2 and Y = y1 + y2 (12)
where y1 is Country 1’s income, y2 is Country 2’s income, and d is the (pos-itive) coeffi cient of the total income, Y. The other variables were previously presented. Under this assumption, the countries’ profi t is:
∏1 = (a – bq1 – bq2 + dy1 + dy2) q1 – cq1 (13)
∏2= (a – bq2 – bq1 + dy1 + dy2) q2 – cq2 – tcq2 (14)
Including the variable income into equations (4), (5), (6), (7), (8), (9), (10) and (11), Countries 1 and 2 face their new maximization problems:
Max t ∏1*= (a + dy1+ dy2 – c + ct)2 / 9b (15)
Max t ∏2*= (a + dy1+ dy2 – c – 2ct)2/9b (16)
If a third player is considered, the same analysis can be used to derive the Nash-Cournot Equilibrium. In deriving Country 1’s best-response func-tion, we must consider the expected level of output presented by the other countries. All the countries decide the total output simultaneously. Thus, when three players play a Cournot game, the Nash Equilibrium presents dif-ferent payoffs. See Gibbons (1992) and Carlton and Perloff (2000) for the modeling of a game with three or more players.
1.2 Mixed complementarity problem
speed in solving economic models, which result from the fact that Kuhn-Tucker’s fi rst-order optimality conditions are used to set up the models. For details, see Rutherford (1995).
The formulation of a Cournot game as a Mixed Complementarity Prob-lem assumes that the Nash-Cournot Equilibrium defi nes the market price and the level of production for each country, taking the fi rst-order condi-tions into account for all countries (Ventosa et al. 2002).
Given the linear inverse demand of powdered milk defi ned by equation (12), and considering the possibility that both countries use the same tariff, the countries’ profi t functions are:
∏1 = aq1 – bq12 – bq1q2 + dy1q1 + dy2q1 – cq1 – tcq1 (17)
∏2 = aq2 – bq22 – bq2q1 + dy1q2 + dy2q2 – cq2 – tcq2 (18)
To solve the Cournot’s duopolistic model as a MCP it is necessary to ob-tain the following Kuhn-Tucker conditions:
Marginal conditions:
∂∏1
–––– = a – 2bq1 – bq2 + dy1 + dy2 – c1 (1 + t1) ≤ 0 (19) ∂q1
∂∏2
–––– = a – 2bq2 – bq1 + dy1 + dy2 – c2 (1 + t2) ≤ 0 (20)
∂q1
Nonnegativity conditions:
q1≥ 0; q2≥ 0 (21)
Slackness conditions:
q1 [a – 2bq1 – bq2 + dy1 + dy2 – c1 (1+ t1)] = 0 (22)
q2 [a – 2bq2 – bq1 + dy1 + dy2 – c2 (1+ t2)] = 0 (23)
Accord-ing to Flakowski (2004), it is important to notice that only positive defi ned variables can be made complementary to inequalities or equations. How-ever, it is not necessary to match free variables to equations; it is only re-quired to have the same number of equations as free variables. For details, see Ferris and Munson (2000). In this paper, the level of production for each player, the total production and the market price are defi ned as positive variables. Those variables are associated to the equations of each country’s profi t, the equation of total production and the equation of market demand, respectively.
1.3 Econometric model
Before solving the Mixed Complementarity Problem, it is necessary to esti-mate the market demands for whole milk powder (WMP). First, we esti-mated individual market demands for Brazil and Argentina. After that, we estimated a market demand to simulate a game between both countries. Finally, we estimated a market demand to simulate a game between Brazil, Argentina and a third player, the Rest of the World.
Specifi cally, those market demands were defi ned as: (a) Whole Milk Powder (WMP) demand for Brazil:
QB = β11 – β21 PB + β31 RB +u1 (24)
(b) WMP demand for Argentina:
QA = β12 – β22 PA + β32 RA +u2 (25)
(c) WMP combined demand for Brazil and Argentina:
QAB = β13 – β23 PAB + β33 RA + β43 RB + u3 (26)
(d) WMP demand for Brazil, Argentina and the Rest of the World:
QM = β14 – β24 PI + β34 RM +u4 (27)
PA = WMP domestic price in Argentina, 1990-2004 (US$/ton); PB = WMP domestic price in Brazil, 1990-2004 (US$/ton); PAB = WMP average price in Brazil and Argentina, 1990-2004 (US$/ton); PI = Oceania international WMP price (FOB), 1990-2004 (US$/ton); RA = Argentina’s real gross domes-tic product (GDP), 1990-2004 (million pesos); RB = Brazil’s real gross do-mestic product, 1990-2004 (million reals); RM = world’s gross dodo-mestic product real variation, 1990-2004 (annual percent change); βij (i = 1, 2, 3, 4; j = 1, 2, 3, 4) are the parameters to be estimated, and the error terms are represented by μi (i = 1, 2, 3, 4).
According to economic theory, we assumed that the parameters associ-ated with prices are negative and those associassoci-ated with income are positive. We assumed also that the error terms present mean zero and variance is constant.
1.4 Data and procedures
The demand equations for whole milk powder considering annual data cov-ering the 1990-2004 period were estimated using the E-views econometric software. The time series data of WMP production and exports for Brazil, Argentina, New Zealand, and Australia were collected from the United States Department of Agriculture (USDA) through the Foreign Agricultural Ser-vice (FAS). In this paper, we considered demanded quantity as the produced amount once the WMP stocks for Brazil and Argentina are held at insignifi -cant levels. The time series data on WMP prices (US$/ton) for Brazil and Argentina were collected from the Secretaria de Comércio Exterior (SECEX) and the Secretaría de Agricultura, Pesca y Alimentación de la República Ar-gentina (SAPyA), respectively. The time series of international WMP prices were obtained from the USDA. The Argentinean real GDP (used as proxy of the income) was taken from the Instituto Nacional de Estadística y Censos
(INDEC). The Brazilian real GDP and the world’s gross domestic product real variation were taken from the Instituto de Pesquisa Econômica Aplicada
(IPEADATA).
Con-ference on Trade and Development (UNCTAD). The parameters used for the numeric resolution of the games as mixed complementarity problems were the ones implemented by the GAMS software (General Algebraic Modelling System) using the PATH solver. The codes for implementation of Cournot’s duopolistic game in GAMS can be found in the Appendix (fi gure 1a).
In this paper, we considered the main changes in the whole milk powder trade between Brazil and Argentina from 1990 to 2004 as a reference to de-fi ne the different scenarios. In the de-fi rst two scenarios, we proposed to mea-sure the effects of an autarchy on the WMP production for Brazil and Argen-tina in each domestic market. The third scenario simulated games between both countries on WMP production, starting with free trade all the way to the highest level of protection through prohibitive tariffs. Finally, the last scenario intended to simulate a three player game, considering Brazil, Ar-gentina and the Rest of the World (New Zealand and Australia) as world exporters of whole milk powder.
2. RESULTS AND DISCUSSION
Before estimating the equations of the whole milk powder market demands, we tested the time series for unit roots. Dickey-Fuller’s unit root test indi-cated that the time series used to estimate the Brazilian market demand (equation 24), the combined demand for Brazil and Argentina (equation 26), and the combined demand for Brazil, Argentina and the Rest of the World (equation 27) are stationary at the 5% level. However, by the Dick-Fuller test, the QAtime series (Argentinean market demand) is stationary only at the 15% level. Unlikewise, the Phillips-Perron’s unit root test indi-cated that this time series (QA) is stationary at the 5% level. Based on these results, we considered all time series used in this paper stationary.
2.1 Scenarios 1 and 2: Brazil and Argentina as monopolists
the R2 value indicates that the variables used in the model explain 89.99% of the total variation in WMP demand.
The negative value of the price coeffi cient indicates that a US$ 1 increase per WMP ton reduces the demanded quantity in 68.9 tons. The demand price elasticity price of –0.5217 indicates that the 10% increase in the WMP price reduces its demanded quantity in 5.22%. Martins (1992) obtained milk demand price-elasticities between –0.1 and –0.6. According to Gomes (2002), the low milk demand price-elasticity in Brazil, around –0.5, com-bined with the growing supply price elasticity helps to explain the great os-cillations on the milk price received by the Brazilian milk producers.
Assuming the monopolist maximizes profi t, the profi t maximizing out-put level is found by setting marginal cost equal to marginal revenue. At this point, Brazil output level reached 214.84 thousand tons. From 1990 to 2004, Brazil consumed an average of 323.77 thousand tons of milk powder per year. The WMP consumption increased from 185 thousand tons in 1991 to 428 thousand tons in 2004 (USDA 2005). Under the same assumptions, the optimal market price is equal to US$ 3,398.47. Over the period from 1990 to 2004, the average price was US$ 1,861/ton. The lowest price in the Brazilian market, US$ 1,390/ton, in 1991, is 37% inferior to the highest price found in 2000, US$ 2,210. These results show that if there was a monopoly in the Brazilian WMP market, there would be a consumer’s surplus reduc-tion due to an increase in the product price and a decrease in the quantity supplied.
Table 1a: Estimation Results for WMP market demand in Brazil
Dependent Variable: QB
Sample: 1990-2004
Variable Coeffi cient Std. Error t-Statistic Prob.
Intercept 267.4043 44.8179 5.9664 0.0000*
PB –0.0689 0.0277 –2.4833 0.0288**
RB 0.1444 0.0139 10.3425 0.0000*
R2 0.8999 F-statistic 53.9549
Adjusted R2 0.8832 Prob (F-statistic) 0.0000
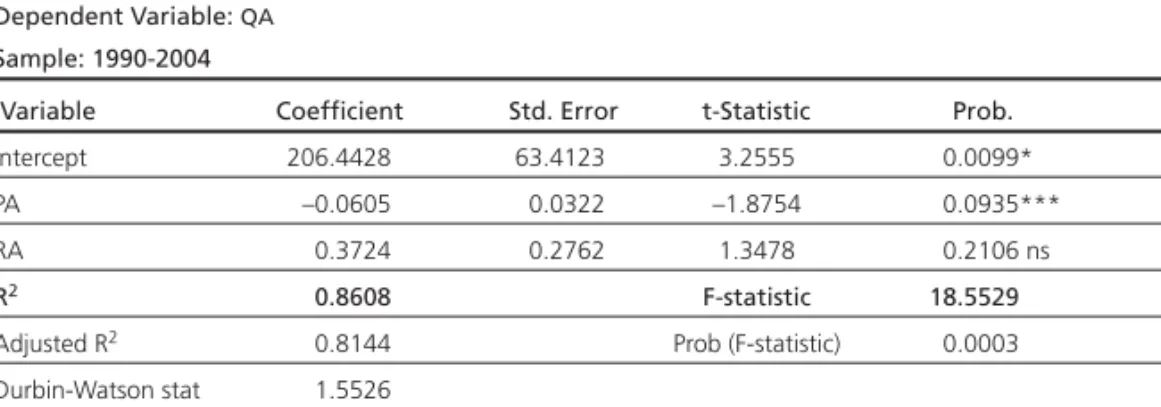
Afterward, Argentina was considered a monopolist in its domestic mar-ket. The coeffi cients of the Argentinean WMP market demand are present-ed in table 2a. The variables Intercept and domestic market price (RA) are statistically signifi cant at a 1% and 10% level, respectively. The R2 value indicates that 81.44% of the variation in the demanded quantity of Argen-tinean whole milk powder is explained by the predetermined variables of the model. The negative value of the market price (PA) indicates that a US$ 1 increase per WMP ton reduces the demanded quantity in 60.5 tons. In terms of the demand price-elasticity, the value of –0.7319 denotes that a 10% increase in the market price reduces the WMP demanded quantity in 7.32%.
In this scenario, where Argentina is considered an autarchy, the point where marginal revenue equals marginal cost and maximizes the profi ts is equal to 160.97 thousand tons of WMP. The whole milk powder consump-tion in Argentina increased from 83 thousand tons in 1990 to its highest value of 243 thousand tons during 1997-1998. Under monopoly, the WMP market price practiced by Argentina is US$ 3,284/ton. This value is signifi -cantly superior to the highest price of US$ 2,540/ton in 1993, and the lowest price of US$ 1,440, found during the Argentinean economic crisis of 2002. From 1990 to 2004, the average consumption of WMP in Argentina was equivalent to 165.13 thousand tons per year, while the domestic price pre-sented the average value of US$ 1,997.67/ton. As observed before for Brazil, the autarchy in the Argentinean market reduces the output level and in-creases the domestic price.
Table 2a: Estimation Results for WMP market demand in Argentina
Dependent Variable: QA
Sample: 1990-2004
Variable Coeffi cient Std. Error t-Statistic Prob.
Intercept 206.4428 63.4123 3.2555 0.0099*
PA –0.0605 0.0322 –1.8754 0.0935***
RA 0.3724 0.2762 1.3478 0.2106 ns
R2 0.8608 F-statistic 18.5529
Adjusted R2 0.8144 Prob (F-statistic) 0.0003
2.2 Scenario 3: Cournot duopolistic game between Brazil and Argentina
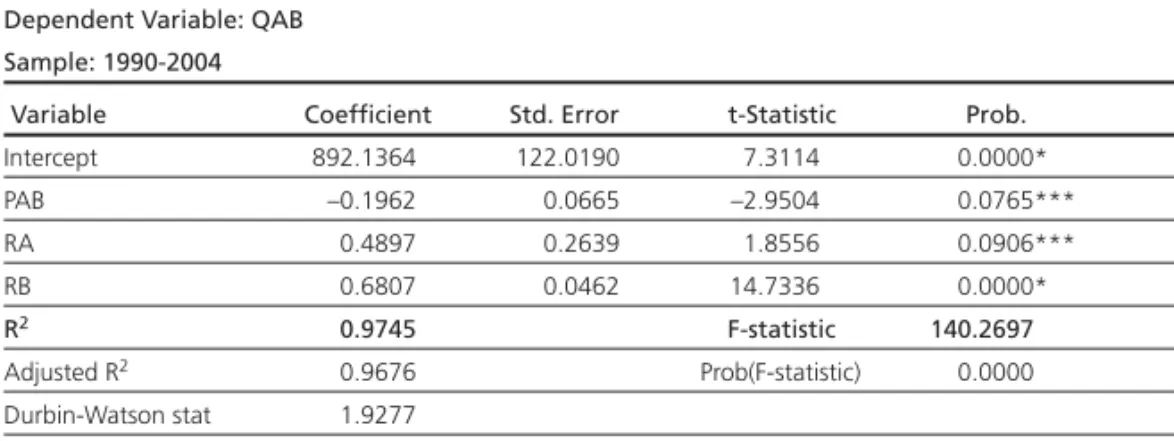
The fi rst simulation of this scenario assumed the absence of WMP import tariffs between Brazil and Argentina. These countries, while members of Mercosul, established a Common External Tariff for non-member coun-tries. We formulated a Cournot game assuming Brazil and Argentina as duopolists. The estimation results of equation (26) are presented in table 3a. The variables Argentinean income (RA) and market price (PAB) are statisti-cally signifi cant at a 10% level. The variables Intercept and Brazilian income (RB) are statistically signifi cant at the 1% level. The high R2 value indicates that the model accounts effi ciently for the behavior of the dependent vari-able. The negative coeffi cient of market price (PAB) points out that a US$ 1 increase per WMP ton reduces the demanded quantity by 196.2 tons. The demand price-elasticity indicates that a 10% increase in the WMP price re-duces the amount in 9.13%, ceteris paribus.
The Brazilian income coeffi cient (0.6807), higher than the Argentinean income coeffi cient (0.4897), indicates that an increase in consumer’s income in the fi rst country has a larger effect in the total demanded quantity. In fact, Brazilian’s economic stabilization plan reduced the infl ation and provided a real increase in income. As a result, it contributed signifi cantly to an in-crease in the consumption of dairy products by people of lower income, as a consequence of their high price elasticity.
The results of the fi rst simulation using GAMS were obtained consider-ing the estimated coeffi cients of equation (26). The market price established in this game is equal to US$ 1,983.22 per WMP ton. Argentina and Brazil produced 226.76 and 236.14 thousand tons, respectively.
Table 3a: Estimation results for WMP market demand between Argentina and Brazil
Dependent Variable: QAB
Sample: 1990-2004
Variable Coeffi cient Std. Error t-Statistic Prob.
Intercept 892.1364 122.0190 7.3114 0.0000*
PAB –0.1962 0.0665 –2.9504 0.0765***
RA 0.4897 0.2639 1.8556 0.0906***
RB 0.6807 0.0462 14.7336 0.0000*
R2 0.9745 F-statistic 140.2697
Adjusted R2 0.9676 Prob(F-statistic) 0.0000
During the fi rst stage of the Real Plan (1994-1998) the WMP production in Brazil increased 42.86%, reaching 240 thousand tons of whole milk pow-der in 1998 (USDA 2005). However, the high level of WMP domestic con-sumption and the overvalued exchange rate stimulated the increase of the WMP Brazilian imports over this period.
In spite of presenting favorable conditions of development, the great transformations in the Argentinean dairy sector did not occur until the end of the 1980’s because of an inappropriate economic environment. The stabi-lization plan, combined with the implementation of Mercosul, promoted an expressive increase in Argentinean WMP production and exports. Over the period from 1990 to 2004, Argentina’s WMP production increased 254.84%, reaching the record level of 244 thousand tons in 1999 (USDA 2005).
In 2001, WMP was included in Brazil’s Common External Tariff excep-tion list. After that, a 27% tax is charged in addiexcep-tion to the import tariff of 18.5% to all markets, including Mercosul members. The new game between Argentina and Brazil was simulated considering the WMP import tariff changes adopted by Brazil. In this second simulation, the imposition of tar-iffs in the WMP trade fl ow between Brazil and Argentina was considered. The new market price was US$ 2,077.86/ton, 4.86% higher than the fi rst simulation. Under these conditions, Brazil produced 254.72 thousand tons of WMP. According to USDA (2005), Brazil WMP output level was equivalent to 256 thousand tons in 2000.
After the inclusion of the whole milk powder in the exception list of the Common External Tariff, Argentina reduced its production in 13.9%, to 229.61 thousand tons. Brazil’s currency devaluation in January 1999 and the continuous growth of the Brazilian WMP production led Argentinean WMP to become less competitive. In fact, according to Spaya (2005), the Argentin-ean whole milk powder production fell from 244 thousand tons in 1999 to 208 thousand tons in 2000, representing a 14.75% decrease.
Brazil, Argentina’s production is 252.84 thousand tons. Even equalizing the import tariff level, Argentina does not overcome its fi rst game’s output level in which the use of tariffs did not exist for either country. However, without cooperation it may be diffi cult for the two countries to realize the superior free trade outcome. In a non-cooperative game, if both countries begin with free trade, each country has an individual incentive to deviate and imple-ment tariffs.
In the fi nal simulation of this scenario, we considered what would be prohibitive WMP tariff for both countries. When the Brazilian WMP import tariff increased to 327% there was no incentive to the international trade. In other words, this was the fi rst tariff level at which the second player did not produce any amount. When the Argentinean WMP import tariff reached 232%, Brazil was not motivated to produce whole milk powder. In fact, ac-cording to Gibson et al. (2001), in some countries the import tariffs on dairy products reach prohibitive tariff levels. Japan, for instance, has an average import tariff for dairy products equivalent to 322%.
As it can be observed, the adoption of tariff practices in the whole milk powder trade by Brazil and Argentina reduces the total amount of produc-tion for both countries. As the market price behaves inversely to the total output level, the price goes up as the tariff level increases. The fi nal out-come, after retaliation occurs, is very likely to cause reductions in the wel-fare of both countries. This occurs because each trade policy results in a decline of the consumer’s surplus of both countries.
2.3 Scenario 4: three player Cournot game (Brazil, Argentina and the Rest of the World)
The simulation of the fourth scenario illustrates a three player Cournot game considering tariff imposition and free trade. In this game, Brazil and Argentina are considered as world WMP exporters inserted together in the international trade against a third player formed by New Zealand and Aus-tralia. According to Sapya (2005), New Zealand and Australia were the main WMP exporters in 2003, representing a share of 37% and 14% of the world’s total net WMP exports, respectively. The estimated parameters of the de-mand equation are presented in table 4a.
equa-tion (27) indicates that the three independent variables explain 88.16% of the variation in the world’s demanded quantity of WMP. The demand price-elasticity value of 0.5785 indicates that a 10% increase in the market price reduces the WMP demanded quantity in 5.78% .
Considering the estimated coeffi cients, two Cournot games were simu-lated among the three players. The fi rst game was simusimu-lated considering the current WMP tariff levels adopted by the countries. According to Unctad (2005), the whole milk powder import tariffs for Brazil, Argentina and the Rest of the World (Australia and New Zealand) correspond to 27%, 16% and 5%, respectively. Under these conditions, Argentina, Brazil and the Rest of the World produced 208.38, 387.79 and 423.77 thousand tons of whole milk powder, respectively.
Although Argentina produced and exported record levels of whole milk powder during the 1990’s, it stagnated in the subsequent years. The eco-nomic recession that began in 2000 and the following ecoeco-nomic crisis in 2002 hit the Argentinean dairy sector very hard. However, the strong de-valuation of 2002 and very fi rm world prices in the past years are driving a strong recovery of that sector in Argentina. According to Saypa (2005), Ar-gentina produced approximately 204 thousand tons of WMP in 2002, 2.15% above the estimated amount for this player.
In Brazil, in spite of the vertiginous growth of milk production in the 1990’s, the output level was still insuffi cient to supply the domestic con-sumption. After 2001, Brazilian exports of whole milk powder began to ob-tain prominence positions. The dairy sector registered its fi rst trade surplus
Table 4a: Estimation Results for WMP market demand between Argentina, Brazil and the Rest of the World
Dependent Variable: QM
Sample: 1990-2004
Variable Coeffi cient Std. Error t-Statistic Prob.
Intercept 1529.992 294.1752 5.2001 0.0003*
PI –0.313798 0.140538 –2.2328 0.0473**
RM 28.19297 78.42446 0.3595 0.7260 ns
@trend 128.0171 23.86531 5.2384 0.0003*
R2 0.8816 F-statistic 27.2906
Adjusted R2 0.8492 Prob (F-statistic) 0.0000
in 2004, as the value of dairy exports surpassed that of imports. The increase of import tariffs, the exchange rate depreciation, the prohibition of import-ed powderimport-ed milk in the fimport-ederal government’s social programs and the in-crease in fi tosanitary measures support higher Brazilian WMP production. In the fi rst game of this scenario, Brazilian’s production achieved a similar value to the observed amount of 390 thousand tons in 2003, as indicated in USDA (2005).
The estimated production of player Rest of the World was 22% inferior to the average volume produced by Australia and New Zealand from 1990 to 2004, about 543 thousand tons of whole milk powder (USDA 2005). This difference can be attributed to the fact that Australia and New Zealand, be-sides having higher production costs than Brazil and Argentina, are tradi-tional exporters of powdered milk. Therefore, they have consolidated mar-ket positions for their powdered milk through preferential trade agreements (PTAs) and international sale contracts. Since we did not consider these is-sues in the simulations, the model did not capture such effects.
The international price of WMP in the fi rst game of this scenario was US$ 2,044.77/ton. The American dollar depreciation relative to the Euro, the New Zealand and the Australian dollar can be considered as a decisive factor in the increase of WMP prices. According to OCDE (2005), the international WMP price increased from US$ 1,340 in 2001 to US$ 2,108.65 in 2004.
In the second simulation of this scenario, we intended to quantify the impact if free trade was assumed among the three countries. In other words, what would happen if the three players eliminated import tariffs? Under these conditions, Brazil reduced its output level by 31 thousand tons. It is noticed that the compensatory measures against Argentina and New Zea-land and the inclusion of WMP in the “exception list” of the Common Ex-ternal Tariff of Mercosul allowed Brazil to improve its terms of trade.
5 thousand tons and reaffi rming New Zealand’s position as the world’s larg-est WMP net exporter.
When a country like Brazil sets trade policies to improve its terms of trade, there is a subsequent reduction in world effi ciency. The elimination of tariffs provided an increase of consumer’s surplus through the combina-tion of lower prices and larger output level. The total amount produced by the three players increased 4% after trade liberalization, while the market price of US$ 1,914.42/ton is 6.35% inferior to the game with tariffs.
3. CONCLUSIONS
Since the implementation of Mercosul, the calendar of negotiations among member countries has been intensely focused on dealing with trade con-fl icts. Over the last years, whole milk powder has created trade divergences between Brazil and Argentina. In this paper, we analyzed the effects of tariffs on whole milk powder trade fl ow between Brazil and Argentina from 1990 to 2004. We formulated tariff games among countries as Mixed Comple-mentarity Problems and developed their implementation in GAMS.
When there were no tariff impositions between Argentina and Brazil, the fi rst country reached a higher output level. Then, after the Brazilian govern-ment implegovern-mented WMP import tariffs over Argentina, Brazil got a better payoff due to changes in its terms of trade. As expected in the hypothesis of retaliation, Argentina would produce more than Brazil and the market price would be higher.
In the three player game with current WMP tariff levels, Brazil got its highest output of all scenarios. Once free trade was considered, players Ar-gentina and the Rest of the World increased their output level while Brazil reduced its production.
APPENDIX
Figure 1a: Codes for Cournot duopolist game with tariffs as a MCP in GAMS
Scalars
a intercept /4151.996996/
b inclination/4.664788/
c1 marginal cost country 1 /624/
c2 marginal cost country 2 /780/
t1 import tariff to country 1 /0.455/
t2 import tariff to country 2 /0/
d income coeffi cient /7.132913/
Positive Variables
q1 output level country 1
q2 output level country 1
qt total output
p demand function
yt total income
y1 income country 1
y2 income country 2
Equations
profi t1 profi t condition country 1
profi t2 profi t condition country 2
price demand condition
output output condition
income total income condition
income1 income condition country 1
income2 income condition country 2
profi t1.. 2*b*q1 + b*q2 – d*y1 – d*y2 = g = a – c1*(1 + t1);
priofi t2.. b*q1 + 2*b*q2 – d*y1 – d*y2 = g = a – c2*(1 + t2);
price.. p = g = a – b*q1 – b*q2 + d*y1 + d*y2;
output.. q1 + q2 = g = qt;
income.. y1 + y2 = g = yt;
income1.. y1 = g = 0;
income2.. y2 = g = 0;
Cournot model
profi t1.q1
profi t2.q2
price.p
output.qt
income.yt
income1.y1
REFERENCES
CARLTON, D. W.; PERLOFF, J. M.Modern Industrial Organization. 3. ed. New York: Addison Wesley Longman, p. 505, 2000.
FERRIS, M.C.; MUNSON, T. S. Complementarity Problems in GAMS and the PATH Solver, Jour-nal of Economic Dynamics and Control, 24: p. 165-188, 2000.
FLAKOWSKI, S. M. Formulating and solving models as mixed complementarity problems in GAMS. CHEER, v. 16, p. 16-25, 2004.
GIBBONS, R.Game Theory for Applied Economists. Princeton: Princeton University Press, p. 211, 1992.
GIBSON, P.; WAINIO, J.; WHITLEY, D.; BOHMAN, E. M. Profi les of tariffs in global agricultural markets. Washington: USDA (Agriculture Economic Report, p.796), 2001.
GOMES, S. T. Situação atual e tendências da competitividade de sistemas de produção. In: O agronegócio do leite e políticas públicas para o seu desenvolvimento sustentável (Vilela, D. ed.), Juiz de Fora: Embrapa Gado de Leite, p. 67-81, 2002.
LOPES, M. R.Prioridades para a integração das políticas agrícolas no Mercosul. São Paulo: Insti-tuto de Estudo Avançados, p. 72, 1992.
MARTINS, R. S.Análise política de preço do leite no Brasil, 1960-1987. Master Degree Disserta-tion, Federal University of Viçosa, Viçosa, Brazil, p. 70, 1992.
OECD – Organization for Economic Co-operation and Development, Statistics Portal.: <www.oecd.org>, 2005.
RUTHERFORD, T. Modeling general equilibrium problems. Working Paper, Department of Economics, University of Colorado, 1994.
SAPYA – Secretaría de Agricultura, Pesca y Alimentación de la República Argentina, 2005 Cadenas Alimentarias: Lácteos. http://www.alimentosargentinos.gov.ar.
UNCTAD – United Nations Conference on Trade and Development, 2005. Trade Analysis and Information System, www.untacd.org.
USDA – United States Department of Agriculture/Foreign Agricultural Service – FAS, 2005 PS & D Offi cial statistics results. Washington, www.fas.usda.gov