289 R. Econ. contemp., Rio de Janeiro, 9(2): 289-311, mai./ago. 2005
FUND MANAGERS IN CHILE?
*Armando Barrientos
*Aziz Boussofiane
**ABSTRACT The paper measures and evaluates technical efficiency among pension fund managers in Chile. Recent pension reform has established pension fund man-agement market in nine countries in Latin America. The new pension providers compete for affiliates on the basis of fees, rates of return, and quality of service, and are subject to extensive regulation. Applying data envelopment analysis to data from Chile 1982-1999, the paper examines issues of efficiency, competition, and regulation. The analysis concludes that pension fund managers operate below the estimated “efficiency frontier”, and there is no evidence of a sustained upward trend in technical efficiency over time.
Key words: pension reform, pension fund managers, efficiency, competition, regulation
JEL Code: H55
QUÃO EFICIENTES SÃO OS ADMINISTRADORES DE FUNDOS DE PENSÃO NO CHILE?
RESUMOEste artigo se propõe a avaliar e medir a eficiência técnica dos adminis-tradores de fundos de previdência privada no Chile. A recente reforma sofrida pela previdência deu lugar a um mercado de gestão de fundos de aposentadoria em nove países da América Latina. Esses novos gestores de fundos de pensão competem por investidores através do custo de suas tarifas, dos índices de rendimento oferecidos e da qualidade do serviço prestado, estando sujeitos a uma regulamentação rigorosa. Aplicando a análise por envoltória de dados (DEA) aos dados obtidos para o Chile
* Artigo recebido em 6 de julho de 2004 e aprovado em 13 de abril de 2005.
** Professor do Institute for Development Policy and Management, University of Manchester, Oxford Road. IDPM, University of Manchester, Oxford Road, Manchester M13 9 QH, UK, e-mail [email protected]
entre 1982 e 1999, examinamos aqui as questões de eficiência, competitividade e regulamentação. Nossa análise conclui que os administradores de fundos de previ-dência privada operam abaixo do nível de eficiência desejado, e não há previsão de que venha a ocorrer nenhuma melhora consistente na eficiência técnica desses fun-dos num futuro próximo.
Palavras-chave: reforma da previdência; administradores de fundos de pensão; eficiência; competitividade; regulamentação
INTRODUCTION
The spread of pension reform in Latin America in the 1990s has replaced unfunded semipublic pension schemes with individual retirement saving plans managed by private pension fund managers (Barrientos, 1998;
Mesa-Lago and Bertranou, 1998; Queisser, 1998b).1 The establishment of a
pen-sion fund management market is one of the most consequential elements of the reform, with implications for financial and insurance markets, and for
the welfare of pensioners (Barrientos, 1999).2 Pension fund managers
per-form key functions. They collect workers’ contributions into a pension fund, invest this fund in a range of financial assets, provide disability and survivor insurance, arrange pension benefits for those retiring, and provide a range of supporting services. To an important extent, the success or failure of pension reform hinges on whether pension fund managers are effective as pension providers. However, research on the performance of pension fund managers in the region is scant, and the efficiency of pension fund managers has not been addressed explicitly. This paper applies data envel-opment techniques to measure and evaluate the technical efficiency of pen-sion fund managers, and to assess the structure and performance of the pension fund management market in Chile.
Under the 1981 pension reform in Chile, dependent workers are re-quired to contribute a fraction of their earnings to an individual retirement
account with a pension fund manager, or Administradoras de Fondos de
Pensiones (AFP). These corporations are set up with the exclusive purpose of
managing retirement accounts, and are regulated by the Superintendencia
de Administradoras de Fondos de Pensiones (SAFP).3 The designers of
The literature on the emerging pension fund management market in Latin America is limited. Some contributions address market design issues (James and Vittas, 1996; James, Ferrier et al., 1998); regulation (Queisser, 1998a; Vittas, 1998); fees (Paredes, 2000; James, Smalhout et al., 2001); fi-nance (Yermo, 2000); and issues of market efficiency and competition, which have been covered in evaluations of pension reform as a whole in Chile and Latin America (Diamond, 1993; Edwards, 1996; Barrientos, 1998; Mesa-Lago and Bertranou, 1998; Queisser, 1998b; Schmidt-Hebbel, 1999; Mesa-Lago, 2002). Few contributions focus on the operation of the pension fund management market (Superintendencia de Administradoras de Fondos de Jubilaciones y Pensiones, 1996; Bertín, 1997; Barrientos, 1998; James, Ferrier et al., 1998; Queisser, 1998b; Sinha, Martínez et al., 1998; Barrientos, 1999), and the efficiency of pension fund managers has not been tackled directly, despite the key role of pension fund managers in the re-formed pension environment.
This paper examines the efficiency of pension fund managers. It uses data envelopment analysis to measure and evaluate the technical efficiency of pension fund managers in Chile over the period from 1982 to 1999. We focuse is the country with on Chile because it has the longest experience with pension reform, and because it provided a model of the structure of the market other countries have followed closely. The estimated measures of technical efficiency provide evidence on the performance of the pension fund management market over time, the limits on competition, and the ef-fects of fees regulation on the market strategies of the pension fund manag-ers. We found that the potential technical efficiency gains in the market are significant, and that there is no evidence of a sustained upward trend in technical efficiency over time.
The paper is organized as follows: section one outlines and discusses the performance of pension fund managers in Chile to date, identifying key ef-ficiency, competition, and regulation issues. Section Two introduces Data
Envelopment Analysis (DEA) and justifies its applicability to the pension
1. THE PERFORMANCE OF PENSION FUND MANAGERS IN CHILE:
EFFICIENCY AND REGULATION ISSUES
This section examines the performance of fund managers in Chile and iden-tifies key efficiency, competition, and regulation issues.
(a) Competition in the pension fund management market
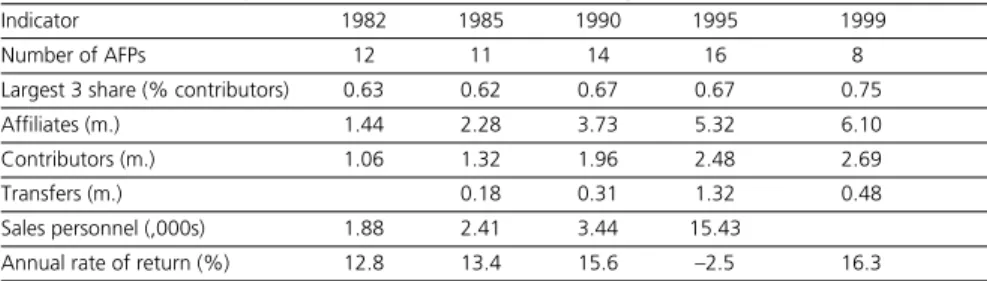
Table 1 below shows key performance indicators for the pension fund man-agement market in Chile. These indicators provide conflictive signals on the extent of competition in the market.
The number of pension fund managers oscillated around 12 in the
pe-riod up to the early 1990s, when a relaxation in entry regulations5 led to a
rise in the number of pension fund managers to 22 in 1993. A subsequent consolidation in response to strong market pressure and adverse invest-ment returns resulted in only eight fund managers remaining in the market. Entry requirements for pension fund managers include a minimum capital
requirement, a reserve of 1 percent of the pension fund,6 and “fit and
proper” licensing by the SAFP (Yermo, 2000). The evolution in the number
of pension fund managers suggests that market entry is not too difficult, and that aggressive marketing from new entrants can secure some market share initially.
The market is very concentrated. The three largest pension fund manag-ers accounted for 63 percent of active contributors in 1982, their share ris-ing to 67 percent in 1990, and to 75 percent in 1999. Market concentration can be explained by economies of scale in the management of retirement
accounts.7 Miranda (1994) measured economies of scale in the Chilean
Table 1: Key Indicators of the Pension Fund Management Market in Chile
Indicator 1982 1985 1990 1995 1999
Number of AFPs 12 11 14 16 8
Largest 3 share (% contributors) 0.63 0.62 0.67 0.67 0.75
Affiliates (m.) 1.44 2.28 3.73 5.32 6.10
Contributors (m.) 1.06 1.32 1.96 2.48 2.69
Transfers (m.) 0.18 0.31 1.32 0.48
Sales personnel (,000s) 1.88 2.41 3.44 15.43
Annual rate of return (%) 12.8 13.4 15.6 –2.5 16.3
pension fund management market. Using data from a panel of pension fund managers for the period from 1982 to 1993, he estimated that, for ev-ery 1 percent rise in the number of active contributors, operational costs rise in the range of 0.6 to 0.8 percent. James et al. find substantial economies of size in asset management, and estimate, in the case of Chile, that scale economies are fully exploited when a pension fund manager “has three mil-lion affiliates and [assets of] US$ 15 bilmil-lion — half the current Chilean mar-ket” (2001, p.267).
The design of pension plans in Chile encourages an individual choice of pension fund manager, as a means of ensuring that competitive forces pre-vail. In order to facilitate this choice, pension products are standard, fees are
uniform for all affiliates to a single AFP, and secondary products are closely
regulated. Pension plan participants in Chile are expected to compare rates of return, fees and service quality between the different pension fund man-agers, and to transfer their accounts to the one with the best deal.
The number of transfers would seem to indicate a healthy measure of competition, but the variation in the number of transfers over time is largely explained by regulatory changes. Initially, participants wishing to
transfer to another AFP had to make a request in person at a branch office,
but in February 1988, the regulations were relaxed to allow participants to request a transfer through a signed form. This led to a rapid rise in transfers, further encouraged in 1992 by the aggressive marketing efforts of new
mar-ket entrants.8 In 1987, there were 181,048 transfers, equivalent to 10 percent
of active contributors, but, by 1995, the number, of transfers had skyrock-eted to 1.32 million transfers, equivalent to 53 percent of active contribu-tors. The reinstatement of the requirement to apply for the transfer in per-son at a branch office reduced transfers to 0.48 million in 1999, equivalent to 18 percent of active contributors.
employed by fund managers. Pension plan participants appear to be fairly insensitive to differences in performance indicators between pension fund managers. This may be due to the high information costs required to make
pension plan choice decisions,9 or to the fact that these performance
differ-entials between pension fund managers are too small to matter. The conclu-sion is that competition is limited in the penconclu-sion fund management market.
(b) Trends in the cost structure of pension fund managers
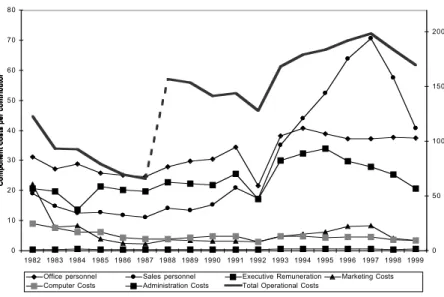
Information on the performance and efficiency of pension fund managers can also be extracted from the examination of their cost structure. Figure 1 shows the evolution of operational costs per active contributor. These in-clude costs of personnel (in administration, sales and management), as well as those associated with administration, computing and marketing. To fa-cilitate comparison across time, the series are reported in constant US$ and
per active contributor.10 Total operational costs per active contributor
de-cline from 1982 to 1987, reflecting the spread of large setup costs across a rising number of contributors. In 1987, pension fund managers began to reinsure against disability and survivor liabilities, which is reflected in a step change in their cost structure. Operational costs decline steadily from 1988 to 1992, but they show a rising trend after 1992, accelerating later on due to the impact of new entrants. The introduction of stricter regulations on transfers in 1998 stems the rise in costs. Overall operational costs show a sustained increase over time. This runs counter expectations that
competi-tion would force pension fund managers to reduce costs.11
(c) Fee structure, regulation, and market strategies
Fee income is the main source of revenue for the pension fund managers.12
It would be expected that the steady rise in their operational costs would come up against restrictions on the revenue side, but regulation effectively lifts these potential restrictions. The regulatory framework defines what ser-vices can attract fees, and the type of fees (fixed or proportional), but pen-sion fund managers are free to decide whether or not to implement these charges, and to what degree. Fees can be levied on fund management, retire-ment account deposits, transfers, deposits and withdrawals from voluntary savings accounts, withdrawals from voluntary severance accounts, and pen-sion benefit payments.
Fund managers are, as a result, free to set a fee structure that is out of line
with their cost structure, but which maximises their market advantage vis a
vis other financial institutions (Barrientos, 1998). Pension fund managers
have been reluctant to use the full range of permitted fees. In order to fore-stall retaliation measures, they are reluctant to charge fees for transfers. In order to compete more effectively with insurance companies offering pen-sion annuities, they have been slow to charge for the management of
retire-ment accounts.13 They have never charged fees on voluntary savings and on
Figure 1: Operational costs per contributor (US$ December 1998) Figure 1. Operational costs per contributor (US$ December 1998)
0 10 20 30 40 50 60 70 80
1982 1983 1984 1985 1986 1987 1988 1989 1990 1991 1992 1993 1994 1995 1996 1997 1998 1999
C o m p o n e n t c o s ts p e r c o n tr ib u to r 0 50 100 150 200
severance savings accounts, in order to maximise their attractiveness rela-tive to savings accounts offered by banks. As a result, the full operational costs of fund managers fall upon regular contributors to individual
retire-ment accounts mainly through earnings — related variable fees.14 There is a
significant misalignment of their revenue and cost structures, with adverse effects on competition and performance.
Two broad market strategies have evolved in the pension fund manage-ment market. Some pension fund managers have sought to maximise mar-ket share in order to exploit economies of size in the marmar-ket. At the other end of the spectrum, some pension fund managers have chosen to remain relatively small, and to focus their marketing efforts on finding and retain-ing high earners. This is made easier where affiliates have a strong allegiance nurtured by trade unions and other organizations. Those managers rely on a misalignment of costs and revenues. Mean operational costs are likely to decline in contributory earnings, but fee income rises directly with con-tributory earnings. Smaller pension fund managers can therefore absorb high operational costs by focusing on high earners, and a selective market-ing strategy allows them to survive and prosper. A segmentation in market strategy could well be detrimental to competition, as well as to improve-ment in market efficiency.
In sum, standard indicators of performance in the pension fund man-agement market help identify a number of issues regarding efficiency, com-petition, and regulation in the market. The following sections seek to ellaborate on these.
2. EFFICIENCY MEASUREMENT AND DATA
Data Envelopment Analysis (DEA) is a nonparametric technique which has
subject to:
t ⌺ur yrj0
r = 1
———— ≤ 1, j = 1, ..., n; ur, vi > ε; ∀r and i
fund managers in Latin America, especially as these are restricted by regula-tion to provide standard services, and to apply similar fees and charges to their affiliates.
(a) CCR and BCC models
In DEA, efficiency is defined as the ratio between a weighted sum of outputs
and a weighted sum of inputs, where sets of weights for each of the observed production units are found by solving the following model proposed by
Charnes, Cooper and Rhodes (1978), referred to as the CCR model
(Bous-sofiane and Dyson, 1991):
t ⌺ur yrj0
r = 1
Max h0 = ————m (1)
⌺vi xij0 i = 1
m ⌺vi xij0
where n indexes units, t indexes outputs, m indexes inputs, and
yrj = amount of output r from unit j,
xij = amount of input i to unit j.
ur = the weight given to output r,
vi = the weight given to input i,
ε = a small positive number.
In this model, the efficiency of unit j0 is maximised subject to the effi-ciencies of all units in the set, having an upper bound of 1. The weights are treated as unknowns, assumed to be nonnegative, and will be chosen to maximise the efficiency of unit j0 . The unit observed is relatively efficient if
the efficiency measure h0 equals 1, and inefficient if less than 1. The
effi-ciency of all other observed units is then measured in turn.
t
h0 = Max ⌺ur yrj0 (2)
r = 1
subject to:
t
⌺vi xij0 =100, r = 1
t m
⌺uryrj –⌺vixij ≤0 j = 1, ..., n, r = 1 i = 1
– ur≤ – –ε, r =1, ..., t, vi≤ – ε–, i =1, ..., m.
With this linearization, the denominator has been set to a constant (arbi-trarily set at 100), and the numerator is maximised for each unit in turn. Alternatively, the dual can be solved:
t
+ m –
Min 100 Z0– ε⌺sr – ε⌺si (3)
r = 1 i = 1
subject to:
– n
xij0 = Z0–si–⌺xijλj =0, i = 1, ..., m, j= 1
+ n
– sr +⌺xrjλj = yrj0, r = 1, ..., t,
j= 1
– +
λj , si, sr ≥ 0 ∀j, r and i, Z0 unconstrained
Estimation of (3) generates an efficiency score for each of the units ob-served relative to all the others, which can be interpreted as an “efficient production frontier”. The aggregate efficiency estimated for a unit equals the product of its pure technical and scale efficiency. An alternative model was provided by Banker, Charnes and Cooper (Banker, Charnes et al.,
1984), who extend the CCR model to assess pure technical and scale
effi-ciencies of units. Their model takes account of the effects of returns to scale within the units observed and identifies the most productive scale size for
each unit. It has the additional restriction that the sum of the multipliers lj
m
+
t
–
Min h – ε关⌺si+ ⌺sr兴 (4)
i= 1 r= 1
subject to:
n
+
hxrj0 – ⌺xijλj – sr= 0, i = 1, ..., m, j = 1
n
+
⌺yrjλj – sr= yr0, r = 1, ... t,
j = 1
n
+ –
⌺yrjλj = 1, λj , sj, sr≤ 0 j = 1
(b) Data
A key issue in the implementation of DEA is the selection of inputs and
out-puts. A production unit will use a variety of resources to produce a unit of output of standard quality. Ideally, one would want to include all inputs and all outputs produced by the firm, but, in practice, the selection of in-puts and outin-puts is restricted to those that can be measured with some ac-curacy. The selection of inputs and outputs is also restricted by the size of the sample of units observed. Boussofiane et al. (1991) suggest that the product of the number of inputs and outputs is a reasonable indicator of the minimum number of units needed to prevent a distortion of the efficiency measure.
A further issue with the selection of inputs and outputs refers to the un-derlying conceptualization of production in financial services. The issue here is to identify what it is that financial providers produce. Related
litera-ture applying DEA to the banking sector has identified two different
fund managers resemble banks, but of the two approaches mentioned the intermediation approach is inappropriate, especially given the dedicated nature of retirement savings accounts, the restricted liquidity of retirement savings, and the strict investment regulations. The production approach is preferable. Pension fund managers employ labour services, use capital equipment and buildings, and employ marketing services to attract and re-tain affiliates.
The analysis below focuses on two measures of output: total revenue and
the number of contributors. Inputs are marketing and sales costs, office
per-sonnel and executive pay, and administration and computing costs. As
dis-cussed above, competition among pension fund managers makes market share heavily dependent upon non-price advantage, that is, marketing and sales force capacity. This is captured by the first input variable. The nature of the business requires administrative competence, with a significant in-formation technology component. This explains the selection of the other two variables.15
3. MEASURING THE TECHNICAL EFFICIENCY OF PENSION
FUND MANAGERS
(a) The efficiency of pension fund managers over time
Applying DEA to the data for pension fund managers for the period from
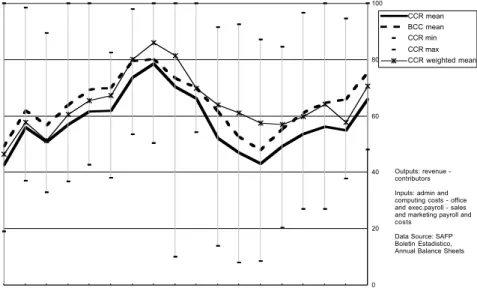
1982 to 1999 generates efficiency scores for each fund manager in the mar-ket in each year. The average efficiency scores for the marmar-ket over the period are presented in figure 2.
It will be useful to focus initially on the unweighted mean efficiency
score generated using the CCR model. The time series shows three distinct
phases. The first, running from 1982 to 1989, is characterized by rising tech-nical efficiency. This is consistent with rapid growth in contributors, en-abling pension fund managers to exploit economies of size, to better utilize capital equipment and branch network, and to distribute the large setup costs across a more widely. At the end of the first year in 1982, pension fund managers could have provided the same services with 42.7 percent of the inputs, but, by 1989, efficiency rises to 78.5 percent, and inefficiency is down by almost two thirds. The second phase starts in 1990 and ends in
1994, and is characterized by a marked decline in technical efficiency. At the trough in 1994, the pension fund management market had returned to the inefficiency levels of 1982. An important contributory factor is the expan-sion in the number of fund managers in the market and the associated rise in sales and marketing costs. The third phase begins in 1995, with a steady improvement in market efficiency accelerating after 1998. This is consistent with a reduction in administration costs after 1994, and the precipitous fall in sales costs following changes in transfer regulations.
There is a wide range of annual efficiency scores, indicated by the dis-tance between minimum and maximum scores, with very poor and very good performers. The dispersion in performance rises with the entry of new pension fund managers into the market in 1992. Comparison between the
unweighted CCR mean score and a CCR mean weighted by the share of
con-tributors provides some information on the relative technical efficiency of large and small pension fund managers over time. To the extent that larger fund managers have better efficiency scores, weighting the scores improves the average technical efficiency score. Interestingly, this applies only to a subset of years, roughly the period from 1987 to 1994.
0 20 40 60 80 100
1982 1983 1984 1985 1986 1987 1988 1989 1990 1991 1992 1993 1994 1995 1996 1997 1998 1999
CCR mean BCC mean CCR min CCR max CCR weighted mean
Outputs: revenue - contributors Inputs: admin and computing costs - office and exec.payroll - sales and marketing payroll and costs
The BCC efficiency scores show a similar trend to that of the CCR scores, but generate consistently higher efficiency scores. This is because the
effi-ciency scores obtained using the CCR model fail to distinguish between
technical and scale inefficiency, but the efficiency scores generated by the
BCC model incorporate scale effects. The mean BCC efficiency scores for the
market as a whole range from a low of just below 50 percent in 1982 to a peak of 80.2 percent in 1989. At the end of the period under examination, the mean score suggests that the level of services could have been provided with a quarter fewer resources.
The examination of mean efficiency scores over time supports two im-portant conclusions. Firstly, there are substantial potential efficiency gains in the pension fund management market. The efficiency scores indicate that the same services could have been provided with a fraction of the resources used by the pension fund managers. At the end of the period under exami-nation, pension fund managers could have produced the same level of out-put with around 35 percent fewer resources. Secondly, whilst there is sig-nificant variation in technical efficiency over time for the market as a whole, there is no indication of a sustained upward trend in technical efficiency. Breaks in the trend of mean efficiency scores are consistent with regulatory changes, and the impact of new entrants on the structure of costs of pension fund managers, especially sales and marketing costs.
(b) Pension fund managers efficiency and market strategies
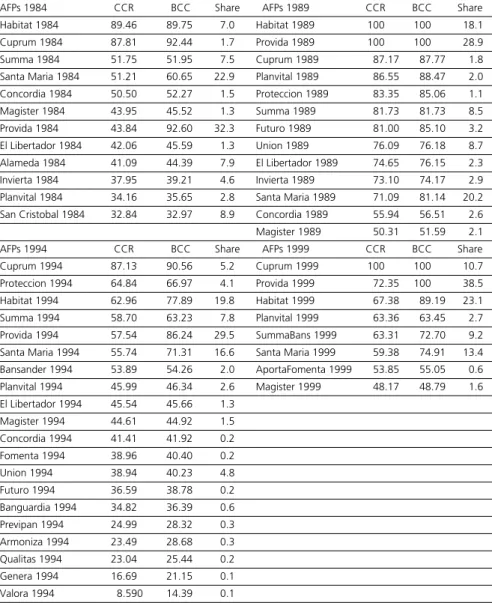
Table 2 shows, for selected years, CCR efficiency scores for individual
Table 2: Efficiency scores and market share of pension fund managers, 1984, 1989, 1994, 1999
AFPs 1984 CCR BCC Share AFPs 1989 CCR BCC Share
Habitat 1984 89.46 89.75 7.0 Habitat 1989 100 100 18.1
Cuprum 1984 87.81 92.44 1.7 Provida 1989 100 100 28.9
Summa 1984 51.75 51.95 7.5 Cuprum 1989 87.17 87.77 1.8
Santa Maria 1984 51.21 60.65 22.9 Planvital 1989 86.55 88.47 2.0
Concordia 1984 50.50 52.27 1.5 Proteccion 1989 83.35 85.06 1.1
Magister 1984 43.95 45.52 1.3 Summa 1989 81.73 81.73 8.5
Provida 1984 43.84 92.60 32.3 Futuro 1989 81.00 85.10 3.2
El Libertador 1984 42.06 45.59 1.3 Union 1989 76.09 76.18 8.7
Alameda 1984 41.09 44.39 7.9 El Libertador 1989 74.65 76.15 2.3
Invierta 1984 37.95 39.21 4.6 Invierta 1989 73.10 74.17 2.9
Planvital 1984 34.16 35.65 2.8 Santa Maria 1989 71.09 81.14 20.2
San Cristobal 1984 32.84 32.97 8.9 Concordia 1989 55.94 56.51 2.6
Magister 1989 50.31 51.59 2.1
AFPs 1994 CCR BCC Share AFPs 1999 CCR BCC Share
Cuprum 1994 87.13 90.56 5.2 Cuprum 1999 100 100 10.7
Proteccion 1994 64.84 66.97 4.1 Provida 1999 72.35 100 38.5
Habitat 1994 62.96 77.89 19.8 Habitat 1999 67.38 89.19 23.1
Summa 1994 58.70 63.23 7.8 Planvital 1999 63.36 63.45 2.7
Provida 1994 57.54 86.24 29.5 SummaBans 1999 63.31 72.70 9.2
Santa Maria 1994 55.74 71.31 16.6 Santa Maria 1999 59.38 74.91 13.4
Bansander 1994 53.89 54.26 2.0 AportaFomenta 1999 53.85 55.05 0.6
Planvital 1994 45.99 46.34 2.6 Magister 1999 48.17 48.79 1.6
El Libertador 1994 45.54 45.66 1.3
Magister 1994 44.61 44.92 1.5
Concordia 1994 41.41 41.92 0.2
Fomenta 1994 38.96 40.40 0.2
Union 1994 38.94 40.23 4.8
Futuro 1994 36.59 38.78 0.2
Banguardia 1994 34.82 36.39 0.6
Previpan 1994 24.99 28.32 0.3
Armoniza 1994 23.49 28.68 0.3
Qualitas 1994 23.04 25.44 0.2
Genera 1994 16.69 21.15 0.1
Valora 1994 8.590 14.39 0.1
Authors’ own calculations for efficiency scores, and Superintenencia de Administradoras de Fondos de Pensiones (several issues) for contributors data.
con-tributors to affiliates. Theres is another group of fund managers who choose to remain relatively small and focus on attracting and retaining high earn-ers. They have higher spending on sales and marketing per contributor, but enjoy a stable contributor base (high ratio of contributors to affiliates), as higher earners are less likely to have contributory gaps and are offered in-centives to stay with their fund manager. The higher costs faced by the latter group can be absorbed by higher earnings–related fees and charges. This way, smaller fund managers with lower efficiency scores can survive and prosper in the market. Magister, which has remained in the market despite
low efficiency scores through the selected years, is a good example.16 The
market segmentation produced by these two different market strategies has showed a tendency to decline over time, as fewer smaller fund managers re-main in business.
(c) Determinants of pension fund managers technical efficiency
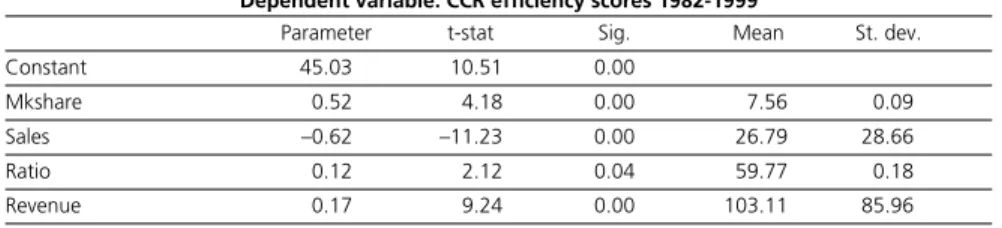
The discussion above suggests the influence of different factors on the tech-nical efficiency of pension fund managers. The extent to which fund man-agers are able to exploit size economies in the market is a key factor, but regulation, and the managers’ response to the regulatory environment are also important. The impact of contrasting market strategies by larger and smaller fund managers is important here, as these have different implica-tions for technical efficiency. The determinants of technical efficiency are investigated by regressing variables capturing market structure, regulation, and market segmentation, on efficiency scores. The dependent variable is
the vector of CCR efficiency scores for the entire period. The independent
variables include the market share of fund managers measured as the
per-centage of total contributors in a particular year (mkshare), which captures
the influence of market structure. The impact of regulation is proxied by two variables, the ratio of contributors to affiliates (ratio), and a measure of
sales spending per contributor (sales). As noted above, pension fund
man-agers can absorb higher costs if they are able to select high earners, but at the cost of higher sales expenditure per contributor. Finally, a measure of
rev-enue per contributor (revenue) is also included to attempt to control for the
trend in these variables over time.17 The regression results are reported in
The estimated parameters indicate that higher market share is associated with higher efficiency scores, reflecting the impact of size economies on pension fund managers’ costs. The parameters associated with the variables proxying responses to regulation have different signs. Higher sales spending per contributor is strongly associated with lower efficiency scores, but a higher ratio of contributors to affiliates has a positive effect on efficiency scores. These results suggest that larger pension fund managers, because they are able to take advantage of size economies, have higher efficiency scores and contribute to the technical efficiency of the market. On the other hand, relatively smaller pension fund managers who rely on segmenting the market and attracting high earners have a detrimental effect on market technical efficiency, except to the extent that they are able to generate fund manager–contributor attachment.
4. CONCLUSION
The paper has investigated the technical efficiency of the pension fund management market in Chile. Pension reform in Latin America has created pension fund management markets in nine countries so far. In the re-formed pension systems in Latin America, pension fund managers are ex-pected to compete to attract and retain affiliates, but are subject to extensive regulation. The efficiency of the new pension providers will be key to the success of the reforms, to their impact on the economies of the region, and to the well-being of pensioners.
We began by discussing standard indicators of performance in the mar-ket, and identifying key issues of efficiency, competition, and regulation. The indicators give a mixed picture of the performance of pension fund
Table 3. Regression results
Dependent variable: CCR efficiency scores 1982-1999
Parameter t-stat Sig. Mean St. dev.
Constant 45.03 10.51 0.00
Mkshare 0.52 4.18 0.00 7.56 0.09
Sales –0.62 –11.23 0.00 26.79 28.66
Ratio 0.12 2.12 0.04 59.77 0.18
Revenue 0.17 9.24 0.00 103.11 85.96
managers. Despite a significant variation in the number of managers point-ing to the absence of significant barriers to entry and exit, and the rise in account transfers, it would appear that competition is limited. The issue is whether competition is limited by the presence of size economies, informa-tion asymmetries, or regulainforma-tion. Examinainforma-tion of the trends in operainforma-tional costs of pension fund managers shows no sustained downward trend, and changes in operational costs over time appear to be largely a response to regulatory environment. The regulation of fees enables a misalignment of fund managers’ revenues and costs, and a segmentation in market strate-gies, where a group of fund managers maximises market share and size economies, while another group focuses on selecting high earners. The im-pact of segmentation on technical efficiency requires investigation.
This paper measured the technical efficiency of pension fund managers in Chile over time using Data Envelopment Analysis Techniques. The find-ings suggest that there are significant potential technical efficiency gains in the pension fund management market in Chile. There are important changes over time, but no continuous trend towards an improvement in technical efficiency. At the start of the reform, pension fund managers could have produced the same output with 40 percent of the resources uti-lized. Technical efficiency improved during the 1980s, but new entrants in the early 1990s, and the rise in sales and marketing costs associated with their entry, led to a decline in market efficiency. Regulations restricting transfers introduced in 1998 have been successful in scaling down sales and marketing costs and improving efficiency scores. At the end of the period, pension fund managers could have produced the same output with 65 per-cent of the resources utilized.
fo-cus on attracting and retaining high earners. Inefficiency in the pension fund management market has strong adverse implications for future pen-sion outcomes.
NOTES
1. Pension reform has been implemented in Chile (1981), Peru (1993), Argentina and Co-lombia (1994), Uruguay (1996), Bolivia and Mexico (1997), Costa Rica and El Salvador (1998). Similar reforms have been implemented in Poland, Hungary and Kazakhstan. 2. The reforms have established markets from scratch, as only Brazil had a significant
pen-sion fund management market before the recent reforms (Yermo, 2000). 3. See Margozzini (1995) for a description of the legal and regulatory framework. 4. The World Bank stated in its 1994 report that “... decentralized plans have more
incen-tive to operate efficiently than centralized plans that have a monopoly in a compulsory system” (World Bank, 1994, p. 224). Mesa-Lago argues this statement is a myth (2002). The fragility of financial institutions in Latin America is a factor that explans the extent of regulation.
5. The restoration of democracy in 1990 enabled trade unions and regional bodies to set
AFPs.
6. This reserve, or encaje, was initially 5 percent of the pension fund.
7. The general literature suggests that economies of scale are present in banking and other financial institutions. A recent survey of research in this area concluded that the average cost curve of banking institutions shows a flat U-shape (Berger, Hunter et al., 1993). Among US banks with over US $1 billion in assets, average costs appear to be lowest, in the range of US$ 2 to 10 billion. Mitchell (1996) studies the cost structure of different pension savings institutions, and finds significant economies of scale in pension fund provision. For employer sponsored pension plans in the USA, costs rise by 0.27 percent for every 1 percent rise in assets, and 0.8 percent for every 1 percent rise in contributors. Strictly, these are economies of size rather than economies of scale. In financial institu-tions, size differences normally involve more than a simple scale factor, and include output, as well as input, efficiency gains (Berger, Hunter et al., 1993).
8. Transfer fees are allowed by regulation, but have seldom been applied by pension fund managers.
9. See Valdés-Prieto (1992) for a discussion of the complexity of the information required, and Diamond (1993) for a more general discussion of market failure in the context of insurance markets.
10. Affiliates are those who have opened a retirement account at any time since 1981, while active contributors are those who make regular contributions to their accounts. 11. Reviewing trends in Chile, the 1994 World Bank report anticipated that the “entry of
12. For the market as a whole, nearly 95 percent of fee income came from this source in 1995.
13. In December 1999, two pension fund managers charged fixed fees for withdrawals un-der the phased withdrawal and deferred life annuity retirement pensions. Two other fund managers charged variable fees on the retirement fund.
14. At the start of the reform in 1981, pension fund managers charged fixed and variable fees on pension fund balances. One effect of this was to dramatically reduce the pension fund of workers who, due to unemployment or inactivity, ceased to contribute regu-larly. Adverse public perception led to inactive contributors being exempted from fees. Most fees fall upon regular contributors. The main fee is charged as an additional con-tribution, which includes a disability and survivor insurance premium. This fee has fluctuated between 2.4 and 3 percent of earnings. In December 1999, for example, the average additional contribution was 2.4 percent and the insurance premium, was 0.65 percent. The net variable fee was therefore 1.75 percent of earnings.
15. The data used in the analysis below were extracted from the balance sheets of the pen-sion fund managers reported annually to the regulator, and from published penpen-sion system information. (Superintendencia de Administradoras de Fondos de Pensiones, several issues).
16. Magister has benefited from a strong association with the teachers trade union, and Cuprum from a similar association with copper workers trade unions.
17. The ratio of contributors to affiliates, and sales spending, have a tendency to rise over time.
REFERENCES
ABUHADBA, M. (1994) “Aspectos organizacionales y competencia en el Sistema Previsional”. Mimeo. Santiago.
BANKER, R. D., CHARNES, A., COOPER, W. W. (1984) “Some models for estimating technical and scale inefficiencies”. In: Data Envelopment Analysis, Management Science, 30, 1078-1092.
BARRIENTOS, A. (1998) Pension Reform in Latin America. Aldershot: Ashgate.
——— (1999) “The emerging pension fund management market in Latin America”. Journal of Pensions Management, 5 (1), 60-68.
BERGER, A. N., HUNTER, W. C., TIMME, S. G. (1993) “The efficiency of financial institutions”.
Journal of Banking and Finance, 17, 221-249.
BERTÍN, H. (1997) “Tres años del régimen de capitalización individual: rentabilidad, efi-ciencia y solvencia de las AFJP”. Serie Estudios Especiales 11. Buenos Aires: Superin-tendencia de Administradoras de Fondos de Jubilaciones y Pensiones.
BOUSSOFIANE, A., DYSON, R. G. (1991) “Applied Data Envelopment Analysis. European Journal of Operational Research, 52, 1-15.
DIAMOND, P. (1993) “Privatization of social security: lessons from Chile”. Working Paper 4.510: NBER.
EDWARDS, S. (1996) “The Chilean pension reform: a pioneering program”. Working Paper 5.811, Cambridge MA: National Bureau of Economic Research.
FERRIER, G. D., LOVELL, C. A. (1990) “Measuring cost efficiency in banking: econometric and linear programming evidence”. Journal of Econometrics, 46, 229-245.
FIELDS, J. A., MURPHY, N. B. (1989) “An analysis of efficiency in the delivery of financial ser-vices: the case of UK insurance agencies”. Journal of Financial Services Research, 2, 343-356.
———, ———, TIRTIROGLOU, D. (1993) “An international comparison of scale economies in banking”. Journal of Financial Services Research, 7, 111-125.
JAMES, E., FERRIER, G., SMALHOUT, J., VITTAS, D. (1998) “Mutual Funds and Institutional Investments: what is the most effective way to set up individual accounts in a social secu-rity system?”. Mimeo. Washington DC: The World Bank.
———, SMALHOUT, J., VITTAS, D. (2001) “Administrative costs and the organization of indi-vidual account systems: a comparative perspective”. In: R. Holzmann, J. E. Stiglitz (eds.),
New ideas about Old Age Security. Towards Sustainable Pension Systems in the 21st
Cen-tury. Washington DC: The World Bank, 254-307.
———, VITTAS, D. (1996) “Mandatory saving schemes: are they the answer to the old age se-curity problem?”. In: Z. Bodie, O. S. Mitchell, J. A. Turner (eds.), Securing Employer-based Pensions. An International Perspective. Philadelphia: University of Pennsylvania Press, 151-192.
MARGOZZINI, F. (1995) “The Industria de AFP”. In: S. Baeza, F. Margozzini (eds.), Quince años después: una mirada al sistema privado de pensiones. Santiago: Centro de Estudios Públicos, 99-130.
MESA-LAGO, C. (2002) “Myth and Reality of Pension Reform: the Latin American Evidence”.
World Development, 30 (8), 1309-1321.
——-, C., BERTRANOU, F. (1998) Manual de Economía de la Seguridad Social. Montevideo: Centro Latinoamericano de Economía Humana.
MIRANDA, E. (1994) “Evidencia de economías de escala en las administradoras de fondos de pensiones. Estudios de Administración, 1 (1), 45-79.
MITCHELL, O. S. (1996) “Administrative costs in public and private retirement systems”. Working Paper 5.734. Cambridge, MA: National Bureau of Economic Research.
NASSER KATIB, M., MATTHEWS, K. (1999) “A Nonparametric approach to efficiency mea-surement in the Malaysian banking sector”. Discussion Papers in Economics 99: 113. Cardiff: Cardiff Business School.
PAREDES, R. (2000) “Gastos de Comercialización de las Administradoras de Fondos de Pen-siones (AFP)”. In: A. d. A. d. F. d. PenPen-siones (ed.), AFP Chile: logros y desafíos. Santiago: Asociación de Administradoras de Fondos de Pensiones, 329-367.
QUEISSER, M. (1998a) “Regulation and supervision of pension funds: principles and prac-tices”. International Social Security Review, 51. (2/98), 39-55.
——— (1998b) “The second-generation pension reforms in Latin America”. Working Pa-per AWP 5.4, Paris: OECD.
SCHMIDT-HEBBEL, K. (1999) “Latin America’s Pension Revolution: a review of approaches and experience”. Mimeo. Washington DC: Central Bank of Chile.
SINHA, T., MARTÍNEZ, F., BARRIOS-MUÑOZ, C. (1998) “Performance of publicly mandated private pension funds in Mexico: simulations with transaction costs”. Mimeo. Mexico
DF: Instituto Tecnológico Autónomo de Mexico.
SUPERINTENDENCIA DE ADMINISTRADORAS DE FONDOS DE JUBILACIONES Y PENSIONES
(1996) Reformas a los sistemas de pensiones. Argentina, Chile, Peru. Buenos Aires: SAFJP. ——— (several issues) Boletín Estadístico (several issues).
VALDÉS-PRIETO, S. (1992) “Selección de AFP y regulación de la información. Working Paper 140. Santiago: Instituto de Economía, Pontificia Universidad Católica de Chile.
VITTAS, D. (1998) “Regulatory controversies of private pension funds”. Mimeo. Washington
DC: The World Bank.
WORLD BANK (1994) Averting the Old Age Crisis: policies to protect the old and promote growth. Londres: Oxford University Press.