Con
fi
rmatory Factor Analysis and Temporal Invariance
of the Positive and Negative Affect Schedule (PANAS)
Análise Fatorial Con
fi
rmatória e Invariância Temporal da Positive
and Negative Affect Schedule (PANAS)
Iolanda Costa Galinha
a, b, Cicero Roberto Pereira
c& Francisco Gomes Esteves
b, daUniversidade Autónoma de Lisboa, Lisboa, Portugal,
bCIS-Centre for Psychological Research and Social Intervention, Instituto Universitário de Lisboa, Lisboa,
Distrito de Lisboa, Portugal, cInstituto de Ciências Sociais, Lisboa, Distrito de Lisboa, Portugal
&dMid Sweden University, Sweden
Abstract
This paper analyzes the structure and the temporal invariance of the Portuguese version of the Positive and Negative Affect Schedule. Previous studies are not consensual whether PANAS measures two or three affect factors and whether such factors are independent or correlated. In order to fi ll in this gap, we compared the original PANAS, as an independent bi-dimensional structure, with several other alternative structures. Two hundred forty fi ve university students and professional trainees answered the questionnaire in two distinct moments with a two month interval. The model of PANAS with a structure of two independent factors, Positive Affect (PA) and Negative Affect (NA), as proposed by the authors of the scale, was tested. However, the best model consisted of two independent factors, PA and NA, with the cross-loading of the item “excited” between PA and NA, and specifi ed error correlations between the same categories of emotions. Another gap in the literature is the temporal invariance analysis of the PANAS. This paper assesses the temporal invariance of the scale, using the structural equation modeling analysis. Although it was used in its state form version, the PANAS scale showed temporal stability in a two month interval.
Keywords: PANAS, Positive and Negative Affect, confi rmatory factor analysis, temporal invariance.
Resumo
O artigo analisa a estrutura e a invariância temporal da versão portuguesa da Positive and Negative Affect Schedule. A investigação científi ca anterior não é consensual acerca da estrutura da PANAS, se é constituída por dois ou três fatores e se esses fatores são independentes ou correlacionados. De forma a colmatar esta lacuna, procedemos à comparação da estrutura da PANAS como tendo duas dimen-sões independentes com várias outras estruturas alternativas. Duzentos e quarenta e cinco estudantes universitários e de cursos de formação profi ssional responderam ao questionário em dois momentos, com dois meses de intervalo. Foi testado o modelo da PANAS que representa uma estrutura de dois fatores independentes, Afeto Positivo (AP) e Afeto Negativo (AN), tal como defi nida pelos autores da escala. Contudo, o melhor modelo foi o que representa uma estrutura de dois fatores independentes, com a ponderação dupla do item “excitado” entre o AP e o AN e especifi cando correlações entre os erros dos itens que pertencem às mesmas categorias de emoções. Outra lacuna na investigação é a análise da invariância temporal da PANAS. Este artigo analisa a invariância temporal da escala, utilizando a análise de modelos de equações estruturais. Embora a escala tenha sido aplicada na sua versão afeto estado, a PANAS revelou invariância temporal num intervalo de dois meses.
Palavras-chave: PANAS, Afeto Positivo e Negativo, análise fatorial confi rmatória, invariância temporal.
The PANAS is a well known and widely used self re-port measure of Positive Affect (PA) and Negative Affect (NA), developed by Watson, Clark and Tellegen (1988). PA and NA are defi ned as general dimensions that describe
* Endereço para correspondência: R. Cruz de Sta.
Apo-lónia, 64, 3º Dtº, Lisboa, Portugal 1100-188. E-mail: [email protected]
Project fi nanced by Fundação para a Ciência e a Tecnolo-gia (Bolsas de Pós-Doutoramento – BPD) / 26479 / 2006.
The wide interest in PANAS is related to the fact that it is a quick and easy application scale that measures impor-tant basic human emotions. Depending on the time frame used, the PANAS can assess affective states, mood, and trait affect. For this reason the study of PANAS has been associated to other constructs such as anxiety, depression and personality (Watson & Clark, 1997). PANAS is also frequently used as a measure of the emotional dimension of the psychological and subjective well-being constructs (Diener & Ryan, 2009). The use of PANAS is adequate to measure subtle changes in emotional experience for general and clinical samples. Therefore, it is pertinent to be used as a measure of mental health or to evaluate the impact of intervention programs. The development of PANAS was based on a previous study about categories of emotions (see Zevon & Tellegen, 1982). This study found that 60 human emotions can be gathered in 20 categories of emotions. PANAS includes 20 emotions that belong to nine of these categories. The structure of Affect has been represented through circumplex models. The emotions are distributed in a circumference and the similarity and difference between the emotions are represented by the proximity or distance between them in the circumference. The correlation between two emotions is not signifi cant when they are 90º distant from each other. The correla-tion between two emocorrela-tions is negative when they are 180º distant (see Tellegen et al., 1999).
The PANAS has been validated all over the world and generally shows good psychometric properties, construct, convergent, and discriminant validity (e.g., Terracciano, McCrae, & Costa, 2003). However, previous studies are not consensual about the factorial structure of the PANAS and about the association between PA and NA. Moreover, in the literature about the PANAS we have not found data about the temporal invariance of the scale using structural equation modelling with latent variables. In order to fi ll these gaps, in this paper we will test the structure of the PANAS, the relationship between PA and NA, and analyse the temporal invariance of the scale.
Factorial Structure of the PANAS
The structure of PANAS, as proposed by the authors, is bi-dimensional, as PA and NA are separate and highly, but not absolutely, independent dimensions (Tellegen et al., 1999; Watson & Clark, 1997). Several studies supported this two-factor structure. For instance, Crocker (1997) observed that the oblique two-factor model represented a good fi t to the data. However, the model fi t improved sig-nifi cantly when the errors of the items of the same content categories of emotions were correlated, such as afraid and scared (see also Zevon & Tellegen, 1982). The two-factor model was also the best fi tting model in the study of Ter-racciano et al. (2003), where PA and NA scales remained substantially independent after accounting for measure-ment error. In the studies of Crawford and Henry (2004) and Tuccitto, Giacobbi and Leite (2010), the best fi tting model was also a two-factor model, specifying correlations according to the mood content categories of Zevon and
Tellegen (1982). However, while the relationship between PA and NA was independent in the study of Tuccitto et al. (2010) it was not completely independent in the study of Crawford and Henry (2004).
Alternative three-factor structures with good fi t indices have also been proposed and tested by Gaudreau, Sanchez, and Blondin (2006), Killgore (2000) and Mehrabian (1997). Mehrabian (1997) tested a model where PA was maintained as one factor and NA was divided into two conceptually meaningful factors: Afraid (scared, nervous, afraid, guilty, ashamed, and jittery) and Upset (distressed, irritated, hostile, and upset). Although both the two-factor and the factor models were sustainable, the three--factor model provided better fi t to the data. In the same line, Killgore (2000) tested the two-factor and the three--factor models and showed the tenability of both. The three-factor model was slightly different from the one used by Mehrabian (1997). The PA factor was maintained and the NA factor was divided into Afraid (scared, nervous, afraid, and jittery) and Upset (distressed, irritated, hostile, upset, guilty, and ashamed). In the study of Gaudreau et al. (2006) the three-factor model yielded the best fi t indices. Additionally, however, the authors allowed cross--loadings of the items excited and active between the PA and the Afraid scales. The authors argued that some people perceive anxiety descriptors as facilitative while others perceive them as debilitative. In the study of Mackinnon et al. (1999) the item excited also shown to cross-load between PA and NA.
In sum, research has provided no consistent results about the PANAS’s factorial structure. Both two-factor (Crawford & Henry, 2004; Crocker, 1997; Terracciano et al., 2003; Tuccitto et al., 2010; Watson & Clark, 1997) and three-factor models (Gaudreau et al., 2006; Killgore, 2000; Mehrabian, 1997) yield good fi t indices. In this paper, we intent to contribute to the literature by testing both two--factor and threetwo--factor models of the PANAS and report which one best fi ts our data.
Relationship Between PA and NA
simultaneously experience very high negative and very high positive emotions.
In sum, although the majority of the studies observed an independent relationship between the scales of Affect, others found a correlated relationship or even mixed re-sults. In this study we will test both the independent and the correlated models of the PANAS and identify which model best fi ts the data.
Temporal Stability of the PANAS
Watson et al. (1988) tested the temporal stability of the several answering time frames of the PANAS (mo-ment, today, past few days, past few weeks, last year and in general), over a two month interval, in a small sample (n=101). Results showed correlations between Time 1 and Time 2, from .39 to .71. The trait version and the wider temporal frames of the scale showed the higher temporal stability as expected. However, the PANAS scale exhibits a signifi cant level of stability in every time frame, even in the moment ratings. These results are consistent with earlier fi ndings (Watson & Clark, 1984) and suggest the strong dispositional component of affect. According to the authors, even momentary moods are refl ections of the ge-neral affective level of the individual (Watson et al., 1988). Terracciano et al. (2003) also investigated the stability of the PANAS through test-retest correlations in a small sample (n=60) over a three month interval. They found that PA in Time 1 correlated with PA in Time 2 (r = .65, p < .001), while NA in Time 1 correlated with NA in Time 2 (r = .52, p < .001). The test-retest of the trait PANAS over the same period yielded, as expected, higher correlations, between .73 and .76.
Importantly, as far as we know, there are no studies addressing the temporal invariance of the PANAS speci-fying PA and NA as latent variables, which we believe is a better procedure to address the reliability of the PANAS. We further analyse the PANAS’s temporal stability, using structural equation modelling with latent variables.
In the present study we will start by analysing the factorial structure of the PANAS: (a) to identify which of the two-factor or three-factor models best fi t our data; and (b) to identify the relationship between the positive dimension and the negative dimension of the concept. Our starting hypothesis states that the PANAS measures two independent factors, as proposed by the authors of the PANAS (Watson et al., 1988). In a third step, we will analyse the temporal invariance of the PANAS over a two-month interval, using the factor structure with the best fi t to the data.
Materials and Method
Participants
Of the 303 adults who participated, 39.2% were pro-fessional trainees and 60.8% were university students in Portugal. They answered the PANAS twice, the second time after a two-month interval. At Time 2, 245 questio-nnaires were collected. Participants were aged between
20 and 58 years old, 81.1% were young adults (20 to 40 years old), and 67% were women. In terms of years of education, 25.5% of the participants had completed 4 to 9 years, 25.2% had completed 10 to 12 years, and 49.3% had further education. In terms of marital status, 45.8% were single, 43.8% were married or living with a partner, and 10.4% were divorced or widowed. An informed consent was communicated to the participants by the researcher in oral and written forms (the fi rst page of the question-naire). According to the ethics standards of the American Psychological Association, the participants were informed of the anonymity of their answers and that they were free to answer only to the questions that they wished. Participants volunteered and there was no gratifi cation to participate in the study.
Materials
We used the Portuguese version of the PANAS (Gal-inha & Pais-Ribeiro, 2005). This version was built from the original 60 items of the study by Zevon and Tellegen (1982) and the process of selection of items used by Wat-son et al. (1988) was replicated. The Portuguese version consists of 20 emotions representing all the content cat-egories of PA and NA as the original version. Participants were asked the extent to which they felt each emotion, at the moment (1 = Very slightly or not at al; 5 = Extremely). The Portuguese version yielded an internal consistency of
α = .86 for the PA and α = .89 for the NA, similar to the original scale.
Procedure
With the institutions’ and the teachers’ permission we approached participants in classrooms at the end of lessons. We invited the students to participate in a study about people’s emotions and subjective well-being. The global questionnaire included several measures of affect, subjective well-being and life events and lasted on avera-ge 30 minutes to answer. The students who volunteered answered the questionnaires in the classroom. The resear-cher was present to answer any questions from the students and supplied an e-mail address to give further information requested by the participants. Time 2 of data collection was carried out two months later. In order to match the questionnaires from Time 1 and Time 2, we requested participants to write a password on a separate sheet in the number of the questionnaire that they fi lled out at Time 1. At Time 2 participants answered the same questions and consulted the passwords to attribute the same number (as in Time 1) to the questionnaire fi lled out at Time 2.
Results and Discussion
Table 1
Comparison of the Goodness-Of-Fit Indices for the Hypothesized and the Alternative Models for the Structure of the PANAS
Models Χ2 df CFI RMSEA SRMR Δχ2 Δdf
Hypothesized
PA and NA independent (Watson et al., 1988) 408.5 170 .86 .08 .08
Alternative 1 PA and NA correlated
408.4 169 .86 .08 .08 .1n.s. 1
Alternative 2
Three-factor (Mehrabian, 1997) 398.4 168 .87 .08 .08 9.9* 2
Alternative 3
Three-factor (Killgore, 2000) 404.1 167 .86 .08 .08 4.4 n.s. 2
Alternative 4
Three-factor (Gaudreau et al., 2006)
cross-loading excited and active 364.1 165 .89 .07 .06 44.4** 5
Alternative 5
Two-factor model specifying error
correlations of Zevon and Tellegens’s (1982) content categories (Crawford & Henry, 2004; Tuccitto et al., 2010)
314.2 161 .91 .06 .08 94.3** 9
Alternative 6
Two-factor model with cross-loading of excited between PA and NA (Mackinnon et al., 1999)
374.4 168 .88 .07 .06 34.1** 2
Alternative 7
Two-factor model specifying error
correlations of Zevon and Tellegens’s (1982) content categories (Crawford & Henry, 2004; Tuccitto et al., 2010) and the cross-loading of excited between PA and NA
(Mackinnon et al., 1999)
277.9 160 .93 .06 .06 130.6** 10
Alternative 8
Three-factor model (Mehrabian, 1997) specifying error correlations of Zevon and Tellegens’s (1982) content categories (Crawford & Henry, 2004; Tuccitto et al., 2010) and the cross-loading of excited between PA and NA (Mackinnon et al., 1999)
277.9 160 .93 .06 .06 130.6** 10
** p<.001; * p<.05; n.s p≥.05.
We started our analysis by testing the two-factor independent model originally proposed by Watson et al. (1988). We specifi ed a measurement model predicting that the 20 items of the full version loaded on two uncorrelated latent variables PA and NA. The model represents the expected tendency for orthogonality, as defended by the authors of the scale and supported by part of the empirical
hypothesized model (see Table 1). Thus, in the analysis of the data collected at Time 1, Confi rmatory Factorial Analysis (CFA) results support the independent model as defended by the majority of the studies. However, in pre-vious literature the authors of the scale have found small signifi cant correlations between PA and NA and higher correlations were found by other researchers (Green & Salovey, 1999; Russell & Carroll, 1999).
Results show that PA and NA are independent at Time 1 (r210= -.02, p = .78) and inversely correlated at Time 2, although weakly(r210= -.14, p< .001). The results corro-borate the proposal that PA and NA are highly but not absolutely independent (Watson et al., 1988). The fact that our results are mixed is, however, important, as it allows us to eliminate some of the hypotheses raised by previous researchers. Since the present study was replicated with the same participants and using the same questionnaire we can say that the variation in the relationship between PA and NA, over a two-month interval, was not due to (a) the different answering options of the questionnaire, the items chosen to defi ne PA and NA, or the measurement errors (Russell & Carroll, 1999); (b) the differences in the cultural backgrounds of the participants (Bagozzi et al., 1999); or (c) the cognitive complexity of the participants (Reich et al., 2001). Several hypotheses about the differences in the relationship between PA and NA over a two-month interval remain to be explored. It may be due to time, as suggested by Russell and Carroll (1999), or to the conditions of the participants when answering the questionnaire. It would be interesting to analyse in future studies what are the conditions that infl uence the relationship between the PA and NA. Indeed, Diener and Emmons (1985) found that when the intensity of emotions is higher and the temporal frame of the answers is narrower, the relationship between PA and NA tends to be inversely correlated.
We continued our analysis by comparing the two--factor model proposed by Watson et al. (1988) with other two-factor and three-factor models proposed by previous research. We tested the three-factor models of the PANAS structure proposed by Mehrabian (1997) – alternative mo-del 2 (A2) – and by Killgore (2000) – alternative momo-del 3 (A3) – where the NA scale was divided into two latent fac-tors: Afraid and Upset. In order to guarantee the statistical identifi cation of the model, it was necessary to constrain to zero the error variance of the Upset factor to avoid nega-tive error variances (see Bollen, 1989). According to our results, only the A2 model tested by Mehrabian (1997) was signifi cantly better than the hypothesized model (Table 1). This model separates NA into two latent factors: Afraid (scared, nervous, afraid, guilty, ashamed, and jittery) and Upset (distressed, irritable, hostile, and upset). The sepa-ration of the items is semantically coherent according to the Zevon and Tellegen (1982) categorization of emotions, except for the items of guilty and ashamed that belong to a different category.
Gaudreau et al. (2006) also tested a three-factor model and they also allowed cross-loadings of two items
(exci-ted and active) between the Afraid NA scale and the PA scale. Again, we guaranteed the statistical identifi cation of the model by constraining to zero the error variance of the Upset factor. We replicated this Alternative Model 4 (A4) and it proved to be the best of the three-factor mo-dels and signifi cantly better than the hypothesized model
Δχ26= 44.4, p< .001 (Table 1). According to our results, distinguishing two categories of negative emotions (Afraid and Upset) and cross-loading the excited and active items between the PA scale and the Afraid subscale promotes the fi tness of the model. This modifi cation also allows us to be more specifi c about the analysis of the negative emo-tionality of an individual, being able to determine whether it is due to fear or to being upset. However, analysing the estimates of the model we see that the cross-loading of excited has a signifi cant loading on Afraid (.37) while the loading of active is not signifi cant (-.02). We consider that the improvement of the model is due to the cross-loading of excited and not of active. The cross-loading of the item excited represents a certain degree of overlap between PA and NA, meaning that this emotion may have a double meaning (positive and negative). This result has also been shown in previous studies, although not consistently. In fact, according to the dictionary defi nitions, in both Portuguese and English languages, excited may have a positive meaning (eagerness and happiness) or a negative meaning (nervousness and agitation). In both languages we also fi nd the reference to a sexual arousal meaning of the word. Future studies of PANAS should consider the development of shorter versions of the scale and the eli-mination of the potentially ambiguous items like excited. We continued the CFA analysis by testing the two-factor models proposed in the literature about the structure of the PANAS. We tested a fi fth alternative model (A5), where we correlated the errors of the items that belong to the same semantic content categories, following Crawford and Henry (2004) and Tuccitto et al. (2010). Then, a sixth alternative model (A6) was tested, which was exactly the same as the previous but with the cross-loading of the item excited between PA and NA scales, following the proposal of Mackinnon et al. (1999). Results show that the A5 model fi ts signifi cantly better to the data than the hypothesized model Δχ29= 94.3, p< .001 and the A4 model
Δχ23= 49.5, p< .001. The A6 model, in its turn, yielded better goodness-of-fi t indices than the hypothesized model
Δχ22= 34.1, p<.001 but not better than the previous A5 model Δχ27= 60.2, p< .001 (Table 1).
previous models and the hypothesized model Δχ210= 130.6,
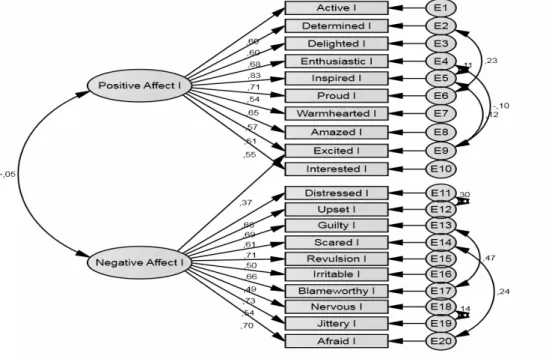
p< .001 (Table 1). We also explored an eighth alternative model (A8), the model is similar to model A7, except that instead of a two-factor model we tested the three-factor model proposed by Mehrabian (1997). It was necessary to constrain to zero the error variance of Upset and Afraid to avoid negative error variances (Figure 2). Results showed a Δχ210= 130.6, p< .001 (Table 1). A7 and A8 models are both better than the hypothesized model but not statistically different from each other. This result probably means that
after correlating the errors of the items that belong to the same categories of emotions, dividing NA in afraid and upset categories may be redundant. Not fi nding a statistical difference between both A7 and A8 models we chose the most parsimonious model (see West, Taylor, & Wu, 2012). Results suggest that the best structure of the PANAS is the one that represents two independent dimensions of PA and NA correlating the errors of the items that belong to the same content categories (see Zevon & Tellegen, 1982) and the double valence of the item excited.
Figure 2. Factor Structure of the PANAS. Alternative Model 8 (A8).
Results also support the construct validity of the PA-NAS. The analysis of the estimated parameters in Time 1 indicates that all of the observed variables load on the latent variables above ( = .48), indicating good construct vali-dity. The best fi ve indicators for the PA scale are: enthu-siastic; inspired; delighted; warmhearted; and determined. The best fi ve indicators for NA scale are: scared; afraid; distressed; upset; and nervous. Moreover, the parameter estimates are feasible, with appropriate standards of error and statistical signifi cance.
The PANAS’s Temporal Invariance
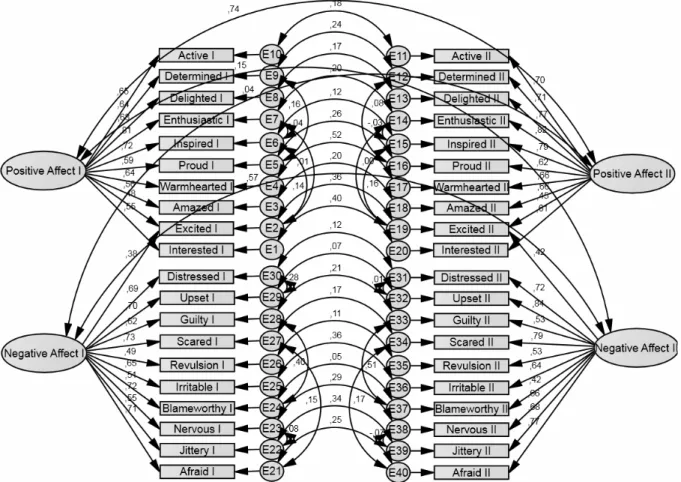
In our third step we aimed to address the temporal sta-bility of the PA and NA scales over a two-month interval
(Figure 3). Specifi cally, we tested the invariance of the regression weights at both data collection times. First we tested the stability of the independent two-factor model. Results for the baseline model (i.e., a model allowing cross-time loading to be freely estimated) showed a χ2716 =1435.5, p<.001 (CFI = .85; RSMEA = .07; SRMS = .09). We then estimated a constrained model (i.e., cross--time loadings constrained to equality), yielding a χ2734= 1464.3, p<.001 (CFI = .85; RSMEA = .07; SRMS = .09). Importantly, the difference between the baseline and the constrained models is not signifi cant (Δχ218= 28.8, p =
.05), supporting the temporal stability of the estimated parameters.
Figure 3. Temporal Stability of the PANAS.
After this, we tested the stability of the best fi tting model (i.e., two factor independent model with the cross lo-ading of excited between PA and NA and the correlation of the errors of the items of the same categories of emotions). The difference between the baseline χ2698=1217.9, p<.001 (CFI = .89; RSMEA = .06; SRMR=.08) and the constrai-ned model χ2717= 1246.6, p<.001 (CFI = .89; RSMEA = .07; SRMR=.08) is also not signifi cant Δχ219= 28.7, p =
.07, confi rming the stability of the measure. Although it is a state measure, results strongly support the temporal
out, these results suggest the infl uence of the trait like cha-racteristics in the state mood of the individuals. Moreover, as argued by other authors, there is a dynamic equilibrium that places individuals in a homeostatic level of subjective well-being to where they return after the infl uence of life events (Cummins, Gullone, & Lau, 2002; Headey, 2006).
Conclusion
This research analysed the factorial validity of the in-dependent two-factor structure of the PANAS as proposed by Watson et al. (1988). First, using CFA, we showed that this structure shows better fi t to the data than the correlated two-factor model. After testing this model with several alternative factorial structures, the one that yielded the best results was the independent two-factor model with the cross-loading of the item excited between PA and NA, suggesting some ambiguity of the item, and the correlation of the errors of the items from the same content categories. The scale also yields good construct validity. Second, spe-cifying PA and NA as latent variables, we demonstrated the temporal invariance of the PA and NA scales over a two-month interval.
As limitations of the study we point out that it was a convenience sample and that women and highly educated individuals constituted majorities in the sample, which could have contributed to the results. Furthermore, the fact that the questionnaires were fi lled in the same ecolo-gical setting twice may contribute to the invariance of the scale. Finally, the fact that the PANAS was answered at the same time with other measures may have infl uenced the answering of the scales. However, the results obtai-ned are suffi ciently strong to conclude that the PANAS features adequate psychometric parameters to be used in the measurement of Positive and Negative Affect not only in cross-sectional but also in longitudinal study designs.
We suggest that further study continue to analyse the structure of the PANAS. Longitudinal design studies may provide answers to the remaining inconsistencies in the li-terature about the structure of PANAS. We also suggest the development of short versions of the Portuguese PANAS that eliminate some of the double meaning items. Finally, we suggest that temporal reliability of the state PANAS may be analysed in wider time intervals, in order to analyse the stability of state affect through time.
References
Bagozzi, R., Wong, N., & Yi, Y. (1999). The role of culture and gender in the relationship between positive and negative affect. Cognition and Emotion, 6, 641-672.
Billings, D., Folkman, S., Acree, M., & Moskowitz, J. (2000). Coping and physical health during care giving: The roles of positive and negative affect. Journal of Personality and Social Psychology, 79, 131-142.
Bollen, K. A. (1989). Structural equations with latent variables. New York: John Wiley & Sons.
Crawford, J., & Henry, J. (2004). The positive and negative affect schedule (PANAS): Construct validity, measurement properties and normative data in a large non-clinical sample.
British Journal of Clinical Psychology, 43, 245-265. Crocker, P. (1997). A confi rmatory factor analysis of the positive
affect negative affect schedule with a youth sport sample.
Journal of Sport and Exercise Psychology, 19, 91-97. Cummins, R., Gullone, E., & Lau, A. (2002). A model of
subjective well-being homeostasis: the role of personality. In E. Gullone & R. A. Cummins (Eds.), The universality of subjective-well-being indicators (pp. 7-46). Dordrecht, Netherlands: Kluwer Academic.
Diener, E., & Emmons, R. (1985). The independence of posi-tive and negaposi-tive affect. Journal of Personality and Social Psychology, 47, 1105-1117.
Diener, E., & Ryan, K. (2009). Subjective well-being: A general overview. South African Journal of Psychology, 39, 391-406. Gaudreau, P., Sanchez, X., & Blondin, J. (2006). Positive and negative affective states in a performance-related setting testing the factorial structure of the PANAS across two sam-ples of French-Canadian participants. European Journal of Psychological Assessment, 22, 240-249.
Galinha, I., & Pais-Ribeiro, J. (2005). Contributions for the study of the Portuguese version of Positive and Negative Affect Schedule (PANAS): II - Psychometric study. Análise Psicológica, 23, 219-227.
Green, D., & Salovey, P. (1999). In what sense are positive and negative affect independent? A reply to Tellegen, Watson, and Clark. Psychological Science, 10, 304-306.
Headey, B. (2006). Subjective Well-Being: Revisions to Dynamic Equilibrium Theory Using National Panel Data and Panel Regression Methods. Social Indicators Research, 79, 369-403. Kercher, K. (1992). Assessing subjective well-being in the old--old. The PANAS as a measure of orthogonal dimensions of positive and negative affect. Research on Aging, 14, 131-168. Killgore, W. (2000). Evidence for a third factor on the Positive and Negative Affect Schedule in a college student sample.
Perceptual and Motor Skills, 90, 147-152.
Mackinnon, A., Jorm, A., Christensen, H., Korten, A., Jacomb, P., & Rodgers, B. (1999). A short form of the positive and negative affect schedule: Evaluation of factorial validity and invariance across demographic variables in a community sample. Personality and Individual Differences, 27, 405-416 Mehrabian, A. (1997). Comparison of the PAD and PANAS as
models for describing emotions and for differentiating anxiety from depression. Journal of Psychopathology and Behavioral Assessment, 19, 331-357.
Russell, J., & Carroll, J. (1999). On the bipolarity of positive and negative affect. Psychological Bulletin, 125, 3-30.
Tellegen, A., Watson, D., & Clark, L. (1999). On the dimensional and hierarchical structure of affect. Psychological Science,
10, 297-303.
Terracciano, A., McCrae, R., & Costa, P. T. (2003). Factorial and Construct Validity of the Italian Positive and Negative Affect Schedule (PANAS). European Journal of Psychologi-cal Assessment, 19, 131-141
Tuccitto, D. E., Giacobbi, P. R., Jr., & Leite, W. L. (2010). The internal structure of positive and negative affect: A confi rma-tory factor analysis of the PANAS. Educational and Psycho-logical Measurement, 70, 125-141.
Watson, D., & Clark, L. (1997). Measurement and mismeasure-ment of mood: Recurrent and emergent issues. Journal of Personality Assessment, 68, 267-296.
Watson, D., Clark, L., & Tellegen, A. (1988). Development and validation of brief measures of positive and negative affect: The PANAS scale. Journal of Personality and Social Psycho-logy, 54, 1063-1070.
West, S. G., Taylor, A. B., & Wu, W. (2012). Model fi t and model selection in structural equation modeling. In R. H. Hoyle (Ed.), Handbook of structural equation modeling (pp. 209-231). New York: Guilford.
Reich, J., Zautra, A., & Potter, P. (2001). Cognitive structure and the independence of positive and negative affect. Journal of Social and Clinical Psychology, 20, 99-115.
Zevon, M., & Tellegen, A. (1982). The structure of mood change: An idiographic/nomothetic analysis. Journal of Personality and Social Psychology, 43, 111-122.