Article
0103 - 5053 $6.00+0.00
*e-mail: [email protected]
Optimization of the Benzo(A)Pyrene Determination Procedure in Cachaça
Miriam S. F. Caruso* and Janete Alaburda
Divisão de Bromatologia e Química, Instituto Adolfo Lutz, Av. Dr. Arnaldo, 355, 01246-902 São Paulo-SP, Brazil
Neste trabalho foi otimizada uma metodologia de rotina para quantificar e confirmar a presença de benzo(a)pireno (BaP) em cachaça. Foram avaliados três procedimentos de extração; um, utilizando extração em fase sólida (EFS) tanto para extração como para purificação e dois, empregando extração líquido-líquido, seguida de limpeza por cromatografia em coluna com sílica gel. O BaP foi quantificado por cromatografia líquida de alta eficiência (CLAE), com detecção por fluorescência e confirmação por cromatografia gasosa com detector de massas. Os limites de detecção e quantificação obtidos foram, respectivamente, 0,03 e 0,10 µg L-1. Os resultados de
recuperação, em 3 níveis de concentração (0,1; 1,0 e 3,0 µg L-1) situaram-se na faixa de 82.9 a
97.0%, com coeficientes de variação de 0,5 a 4,9%. Estes resultados são similares aos relatados em trabalhos anteriores. Os 3 procedimentos de extração foram considerados apropriados para quantificar BaP em cachaça, entretanto a EFS revelou ser o método mais barato, rápido e com menor consumo de solvente. As concentrações de BaP variaram de não detectado (LOD < 0.03 µg L-1)
a 0.49µg L-1 em vinte amostras de cachaça analisadas.
The present study evaluated and optimized a routine method to quantify and confirm BaP in Brazilian sugar cane spirit (cachaça). Three extraction procedures were tested, one using SPE for extraction and clean-up, while two others were liquid-liquid partition extraction followed by silica gel chromatography clean-up. BaP was quantified by high performance liquid chromatography with fluorescence detection and confirmed by gas chromatography-mass spectrometry. HPLC detection and quantification limits were 0.03 and 0.10µg L-1, respectively. The recovery results ranged
from 82.9 to 97.0% with coefficients of variation (CV) ranging from 0.5 to 4.9% at concentration levels of 0.1, 1.0 and 3.0 µg L-1, which are in accordance with those described by other authors.
The three procedures were appropriated to quantify BaP in cachaça, although SPE extraction is the cheapest, fastest and the least solvent-consuming. The levels of BaP contamination on twenty cachaça samples ranged from no detected (LOD < 0.03µg L-1) to 0.49µg L-1.
Keywords: benzo(a)pyrene, polycyclic aromatic hydrocarbons, cachaça, sugar cane spirit, HPLC
Introduction
Polycyclic aromatic hydrocarbons (PAHs) are ubiquitous
environmental and food contaminants.1,2 In the last years,
they have attracted considerable interest, because some of them are highly carcinogenic in laboratory animals and have been implicated in breast, lung, and colon cancers in humans. These chemicals commonly enter human body through inhalation of cigarette smoke or poluted air, dermal contact or ingestion of contaminated food and beverages. Among these two pathways, dietary intake of PAHs
constitutes an important source of exposure in humans.3
Benzo(a)pyrene (BaP) is the most studied PAH and it
usually is generated together with others PAHs.4 Scientific
Committee on Food5 concluded that BaP could be used as a
marker for the occurrence and effect of carcinogenic PAH
in beverages and food.6
The control of BaP in food and beverages chain is required due to potential hazard to human health. The European Union has recently established a maximum level of BaP in different foodstuff, such as, oils and fats, smoked meat, crustaceans, bivalve mollusks, and infants and baby
foods.7 During the last decade, many studies concerning
BaP monitoring in food and water have been developed.8-12
BaP is extracted using different techniques prior to clean-up and purification. Normally, after complete dissolution or alkaline digestion of food samples, BaP is
extracted from sample by a selective solvent.4,6 Extracted
samples are usually purified from interfering substances
by adsorption column chromatography.13 C-18 cartridges
have been used for both extraction and clean-up of water
and beverage samples.14-16
A common analytical procedure used in the determination of BaP in food is high performance liquid chromatography
(HPLC) with fluorescence detection,4,15,17 sometimes
combining gas-chromatography (GC-MS) for identifying
BaP compounds.17
Brazilian sugar cane spirit (cachaça) is a typical Brazilian distilled alcoholic beverage obtained from distillation of fermented sugar cane juice. Its annual
production is estimated at around 1.4 billion liters,18 1% of
which are exported,19 being the third spirit most consumed
in the world.17 The BaP contamination of cachaça may
occur from raw material, because sugar cane is burnt during the harvesting season. In addition, graxes and oils from
the equipments used during the industrial process16 and
maturing also may be responsible for BaP contamination
of cachaça.20,21
Considering both high production and consumption of cachaça in Brazil, the objective of the present study was to propose a reliable routine method for determination of BaP in cachaças.
Experimental
Chemicals
All chemicals employed were analytical grade, except acetonitrile, cyclohexane, methanol and isopropanol, which were HPLC grade, purchased from Merck (Darmstadt, Germany). BaP standard with 97% purity was purchased from Sigma (ST Louis, USA). The Accubond SPE C-18 (500 mg, 6 mL) columns were purchased from Agilent (Palo Alto, USA). All solutions were prepared with deionized
water (resistivity > 18 MΩ cm-1, Toraypure, Shimadzu,
Japan).
Standard solution
Stock standard solution was prepared by BaP dissolution in acetonitrile. Aliquots were taken to prepare analytical
solutions in acetonitrile ranging from 0.05 to 30 µg L-1 to
calibrate HPLC fluorescence detector. This stock solution was also used to spike the samples.
Samples
A total of 20 samples of cachaça produced in 4 different Brazilian states were purchased in supermarkets, and cachaça stores in the City of São Paulo, State of São Paulo, Brazil, during the period of March to July of 2006. All samples were analyzed in triplicate.
Methods
Extraction
Three different extraction procedures were tested to quantify BaP in cachaça, one using SPE and the others liquid-liquid partition as extraction step. In all cases, both identification and quantification were done by HPLC system with fluorescence detection. The confirmation of BaP was carried out using a GC-MS equipment.
SPE extraction
Extraction and clean-up procedures were conducted
according to Bettin and Franco16 with some modifications.
SPE cartridge was conditioned with 10 mL methanol before sample injection. An analytical aliquot of 10.0 mL of sample was transferred to the cartridge. The vacuum was
adjusted to elute the sample at about 1 drops s-1. After the
entire sample had been eluted, the column was rinsed with 1 mL isopropanol, and completely drained. BaP was eluted
with 10 mL cyclohexane. The eluate was dried under N2 at
40 ºC. The residue was dissolved in 2.0 mL acetonitrile, and filtered through a 0.45 µm membrane filter before LC analysis.
Partition extraction with cyclohexane
This procedure was an adaptation of the methods
described by Toussaint and Walker,22 and Kleinjans et al.23
50 mL of cachaça were transferred to separating funnel, and 7 g of NaCl were added. This mixture was extracted with three portions of 30 mL of cyclohexane. The combined extract was filtered through filter paper containing 2 g
Na2SO4. The solution was reduced to 4 mL under N2 at
40 ºC. The extract was cleaned-up through a silica-gel column as described in “Silica-gel clean-up”.
Partition extraction with dimethylformamide/water
This methodology was first described by Grimmer and
Böhnke13 and has been utilized with some modifications in
(portions of 50, 25 and 25 mL) dimethylformamide-water (9:1, v/v). The extraction solution was diluted with 50 mL of 2% sodium sulfate aqueous solution and re-extracted with 120 mL (portions of 50, 35 and 35 mL) of cyclohexane. The extracts were filtered through filter paper containing 2 g of anhydrous sodium sulfate. The solution was reduced
to 4 mL under N2 at 40 ºC. The extract was cleaned-up by
silica-gel column as described following.
Silica-gel clean-up
5 grams of silica gel for adsorption chromatography (with a content of 15% of water) were packed into a glass column. The BaP extract was transferred to the column and eluted with 100 mL of cyclohexane. The eluate was dried
under N2 at 40 ºC and the residue was dissolved in 2.0 mL
of acetonitrile. This solution was filtered trough 0.45 µm membrane filter before LC analysis.
HPLC chromatographic conditions
The determination of BaP was carried out in a Shimadzu (Kyoto, Japan) high performance liquid chromatography (HPLC) system equipped with a pumping system (LC-10AD), a degasser (DGU-14A), a fluorescence detector (RF-10A XL), a 20 µL injector (Rheodyne LP), and a computer software (Class LC10). The BaP was separated with a reversed-phase C-18 column (Varian, Lake Forest, USA) (250 x 4.6mm, 5 µm) protected with a guard column C-18 (Varian, Lake Forest, USA) (2.0 × 4.6 mm, 5 µm) using isocratic elution. The mobile phase was a mixture of acetonitrile:water (70:30, v/v), and the flow-rate was
1.0 mL min-1.17 The BaP was detected by fluorescence
detector at 295 nm excitation wavelength and 405 nm emission wavelength.
Quantification
Peak areas of the sample chromatograms were correlated with the concentrations according to the calibration curve. The linearity was determined in the range
of 0.05-30 µg L-1 using ten BaP standard solutions with
equidistant concentrations. Standard solution and sample volumes of 20 µL were injected in triplicate.
GC-MS chromatographic conditions
The confirmation of BaP was carried out in a Shimadzu (Kyoto, Japan) chromatograph system equipped with gas chromatograph (GC 17A), mass detector (QP 5000), and computer software (Class 5000). The BaP was separated with DB5-MS column (J&W Scientific, Folson, USA)
(5% phenyl-95% methylpolysiloxane, 30 m × 0.254 mm, 0.25 µm film thickness) using helium as carrier gas at
0.9 mL min-1. The GC temperature programming rates were
as follows: initial column oven temperature, 120 ºC, then
programmed to rise to 250 ºC at 5 ºC min-1 and thereafter
to 280 ºC at 4 ºC min-1. Detector temperature was 285 ºC,
and injector temperature 250 ºC. Injection volume was 1 µL using splitless by 1 min, after that, the split valve
was opened (split ratio: 1/10).Mass spectra were obtained
in SIM mode, monitoring selected fragments at 126 and 252 m/z, and the ionization voltage was 70 eV.
Validation
Detection limit was calculated by spiking blank cachaça samples at levels of the BaP equivalent to three times the standard deviation of noise on analysis (n = 5), while quantification limit was calculated from BaP concentrations that provided signals equal to ten times of noise on analysis (n = 5). The spiked samples were prepared in five replicates independently using a blank cachaça sample.
Recovery was assessed by performing tests on cachaça blank samples. Independent aliquots were fortified with
0.1, 1.0, and 3.0 µg L-1. At each level, the analyses were
performed at least in independent triplicates. Recoveries were determined by back-calculation.
Repeatability of the method was evaluated through the coefficients of variation (CV%) associated with measurements of BaP (n = 5) in one choiced cachaça sample with low and natural contamination using three different extraction methods.
Method application
Twenty different cachaça brands obtained in the market in the City of São Paulo, State of São Paulo, Brazil, were evaluated using SPE extraction, HPLC quantification and confirmation of BaP identity by GC-MS. These samples were from four different states of Brazil, nine cachaça samples from Minas Gerais, nine from São Paulo, one from Ceará, and one from Pernambuco.
Results and Discussion
In order to define HPLC chromatographic conditions, the analytical mobile phase composition was investigated considering different proportions of acetonitrile and water using a fortified cachaça sample. The percentages of acetonitrile ranged from 65 to 80% at a constant flow-rate of
1.0 mL min-1. The 70% acetonitrile composition was the best
separation from others extraneous substances (Figure 1). After chromatographic conditions standardization, different analytical excitation and emission wavelengths were tested to detect BaP. The best results were obtained using 295 nm excitation wavelength and 405 nm emission wavelength.
Two different HPLC analytical columns were evaluated, an Inertsil ODS-P column (GL Science) (150 × 4.6 mm, 5 µm) and a C-18 column (Varian, Lake Forest, USA) (250 × 4.6 mm, 5 µm). The latter column was chosen because Inertsil column showed both high affinity to analyte resulting a retention time of 64 minutes and poor resolution of BaP peak (resolution < 1.5).
Fluorescence detector was linear for BaP from
0.05-30µg L-1. Data least-square regression analysis for
ten calibrators resulted in excellent straight-line fits over the examined concentration curve described by equation
A = 331713 BaP – 625,95 (r2 = 0.9995, where A is the
peak area and BaP the benzo(a)pyrene concentrations). Detection (LOD) and quantification (LOQ) limits were
0.03 and 0.10 µg L-1, respectively. These results are
considered satisfactory for BaP determination24 and they
are in accordance with values reported by others authors
for BaP analysis in food and beverages.8,10,15-18,25
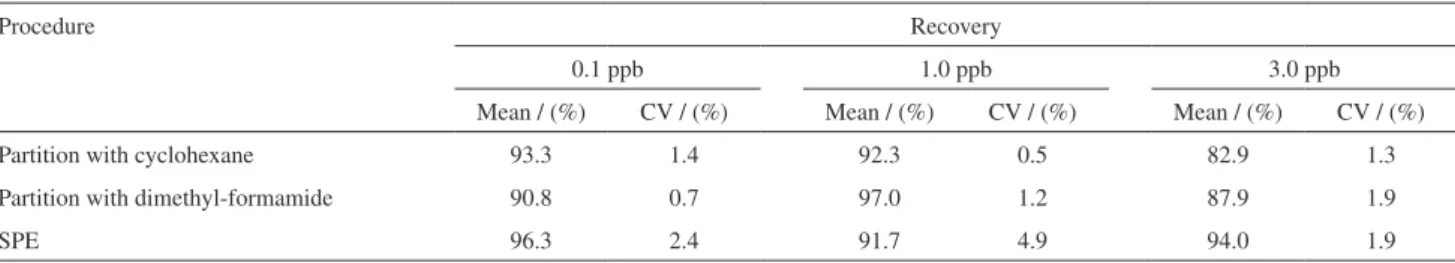
Extraction procedures were evaluated to maximize recovery and decrease both time and solvent consumption. Three different extraction procedures were tested, one using only SPE cartridge for extraction and clean-up steps, and two others, solvent partition to extraction and silica gel column to clean-up. The recovery results from three extraction procedures were summarized in Table 1. The precision was expressed as CV%, and the accuracy was determined
using fortified blank cachaça at 0.1, 1.0 and 3.0 µg L-1 and
expressed as the percent deviation between amount found and amount added at three concentration levels.
The recovery values summarized in Table 1 have good similarity, ranging from 82.9 to 97.0% with CV% from 0.5 to 4.9% at concentration levels of 0.1, 1.0 and
3.0 µg L-1. However, the best results were obtained from
SPE extraction, ranging from 91.7 to 96.3% and CV from 1.9 to 4.9%.
Figure 1. Chromatograms obtained by HPLC with fluorescence detection for BaP standard and cachaça sample solutions.
Table 1. Recovery values for three different extraction procedures of BaP from cachaça samples
Procedure Recovery
0.1 ppb 1.0 ppb 3.0 ppb
Mean / (%) CV / (%) Mean / (%) CV / (%) Mean / (%) CV / (%)
Partition with cyclohexane 93.3 1.4 92.3 0.5 82.9 1.3
Partition with dimethyl-formamide 90.8 0.7 97.0 1.2 87.9 1.9
SPE 96.3 2.4 91.7 4.9 94.0 1.9
The recovery values are satisfactory for determinations
at these levels (µg L-1)24,26 and they were in accordance with
those reported by others authors.8,15,18,25 All peaks obtained
in the recovery experiments were analyzed by GC-MS. This technique showed itself sensible and reliable to confirm the BaP peak identity.
Tfouni et al.17 analyzing cachaça samples have found
BaP recovery value of 74.5% and CV of 11.5%. In another work related to quantify PAH in cachaça, the authors had
reported BaP recovery of 99.4% and CV of 4.2%.16
Garcia-Falcon and Simal-Gandara20 had obtained BaP recovery
result of 94% and CV of 9% for white rum and recovery result of 100% and CV of 9% for red wine.
The repeatability was also evaluated for three extraction procedures and the results were summarized in Table 2. In this study, BaP concentration was determined in the same sample of cachaça in quintuplicate. All extraction procedures presented good repeatability.
Based on the results showed in Tables 1 and 2, the three extraction procedures showed precision, accuracy and sensitivity to quantify BaP in cachaças. During both liquid-liquid extraction procedures, the formation of emulsion was observed, resulting on low recovery values as described
by Toussaint and Walker.22 In order to avoid emulsion,
a portion of sodium chloride was added in the sample at the beginning of the extraction step, resulting on better recovery results. The solvent partition extraction steps using N,N-dimethylformamide were similar to procedure
described by Tfouni et al.,17 which is an adaptation from
the original method proposed by Grimmer and Böhnke.13
However, the use of only 50 mL of 2% sodium sulphate aqueous solution instead of 100 mL of 1% sodium sulphate
aqueous solution as proposed by Tfouni et al.17 produced
higher recovery values.
A modification of the procedure previously described by
Bettin and Franco16 was used in SPE extraction. In order to
define the best experimental conditions to elute BaP from the cartridge, different solvent volumes of isopropanol and acetonitrile or cyclohexane were tested. Analyzing
the recovery values, it was concluded that the use of isopropanol is important to remove residual water present in the cartridge, increasing recoveries. The best results were obtained using 1 mL of isopropanol to rinse the cartridge before the BaP elution with 10 mL of cyclohexane.
Considering solvent and time consumption and costs related to each extraction method, SPE extraction drastically reduced analysis time, volume of solvents and sample manipulations, and it was also suitable for routine analysis. This technique combines both clean-up and extraction. It was cheapest, and the least toxic among of the three techniques tested.
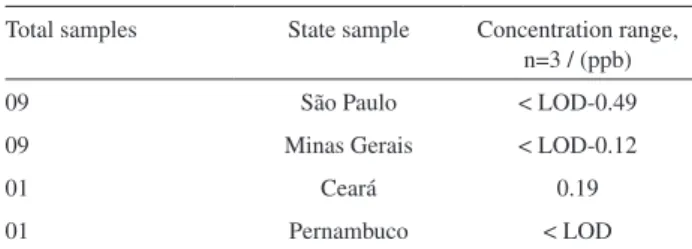
SPE extraction was applied in the quantification of twenty cachaça samples purchased in the market in São Paulo City, State of São Paulo, Brazil. The sampling was formed by cachaça brands from sugar cane burnt and not burnt. The levels of BaP contamination ranged from no detected
(LOD < 0.03µg L-1) to 0.49µg L-1. Table 3 summarizes the
concentrations of BaP determined in different brands of cachaça and their respective producer state.
The identity of all BaP peaks was confirmed by GC/MS method, monitoring selected fragments at 126
and 252 m z-1. Brazilian regulations have not established
BaP limit for alcoholic beverages; however, considering European regulation for foods, that establishes a BaP
maximum level ranged from 2.0 µg L-1 to 10.0 µg L-1
depending of the kind of the food,7 all analyzed cachaças
presented BaP contents above these limits.
The results shown in Table 3 are in accordance with
those described by others authors,16-18 and the variation of
the BaP levels could be related to different processing or differences on the type of sugar cane, burnt or not burnt.
Bettin and Franco16 analyzed 28 cachaça samples and
have found BaP levels ranged from LOD (0.001 µg L-1) to
1.55 µg L-1, and they observed a highest PAH contamination
in cachaça produced from burnt sugar cane. Tfouni et al.17
analyzed 25 brands of cachaça and have reported BaP levels
ranged from LOD (0.011 µg L-1) to 0.36 µg L-1. In another
study, 131 cachaça samples from burned and non-burned Table 2. Repeatability values for three different extraction procedures of
BaP from cachaça samples
Procedure Repeatability
Mean, n = 5 / (ppb)
sd / (ppb)
CV / (%)
Partition with cyclohexane 0.149 0.004 2.7
Partition with dimethyl-formamide 0.183 0.004 2.2
SPE 0.177 0.003 1.7
sd = standard deviation, CV = coefficients of variation.
Table 3. Levels of BaP in cachaça samples from different Brazilian States
Total samples State sample Concentration range, n=3 / (ppb)
09 São Paulo < LOD-0.49
09 Minas Gerais < LOD-0.12
01 Ceará 0.19
01 Pernambuco < LOD
sugar crops were analyzed and BaP levels ranged from
LOD (< 0.001 µg L-1) to 0.045 µg L-1.15
Studies conducted in Brazil have shown that sugar cane burnt is an important source of PAHs emission and could be responsible for contamination of sugar cane
by-products.15,16 Other possible sources of BaP contamination
are the contact of the product with coal tar that coats the reservoirs utilized to store the cachaça during the old step
and the sugar added in some cachaça brands.16
The control of BaP in food and beverages has been required due to its mutagenic and carcinogenic potential in vertebrates. During the last decade, many studies concerning monitoring of PAH and BaP in food have been developed. However, only a few studies about BaP or PAH contamination of alcoholic beverages were
published.15-17,20 Food contamination studies by BaP
are included in the JECFA (Joint FAO/WHO Expert
Committee on Food Additives) priority list.27 In addition,
European Commission has just published the Regulation (EC) N. 208/2005, establishing maximum level of BaP
in some foods.7
Considering both expressive production and high national consumption of Brazilian cane sugar spirit (cachaça), and the use of burnt sugar cane as raw material to produce this alcoholic beverage, the control of BaP contamination is very important to guarantee the safety and quality of this product. Consequently, a reliable routine method to determine BaP in cachaça samples is important for aiming the quality control.
Conclusions
The resolution obtained by HPLC isocratic elution using SPE C18 extraction and clean-up is a reliable method to determine BaP in cachaça samples. HPLC detection and
quantification limits were 0.03 and 0.10µg L-1, respectively.
The recovery results ranged from 82.9 to 97.0% with CV% ranging from 0.5 to 4.9% at concentration levels of
0.1, 1.0 and 3.0 µg L-1. The levels of BaP contamination
on twenty cachaça samples ranged from no detected
(LOD < 0.03µg L-1) to 0.49µg L-1. The analytical method
presents appropriated accuracy, precision and sensitivity levels, for the quality control of this product and all the results found in the present work are in accordance with those described by others authors.
Acknowledgments
The financial support of FAPESP is gratefully acknowledged.
References
1. Pereira Netto, A. D.; Moreira, J. C; Dias, A. E. X. O; Arbilla, G.; Ferreira, L. F. V; Oliveira, A. S.; Barek, J.; Quim. Nova
2000, 23, 765.
2. Lopes, W. A.; Andrade, J. B. de; Quim. Nova1996, 19, 497. 3. Ramesh, A.; Walker, S. A.; Hood, D. B.; Guillen, M. D.;
Schneider, K.; Weyand, E. H.; Int. J. Toxicol.2004, 23, 301. 4. Azeredo, A.; Toledo, M. C. F.; Camargo, M. C. R.; Cienc.
Tecnol. Aliment.2006, 26, 89.
5. S. C. F., Scientific Committee on Food; Polycyclic Aromatic Hydrocarbons-Occurrence in Foods, Dietary Exposure and
Health Effects, Report SCF/CS/CNTM/PAH/29 Add1 final,
4 December 2002. http://europa.eu.int/comm/food/fs/sc/scf/ index_en.html, accessed in October 2006.
6. Van der Wielen, J. C. A.; Jansen, J. T. A.; Martena, M. J.; De Groot, H. N.; In´t Veld, P. H.; Food Addit. Contam.2006, 23, 709.
7. C. E. C., The Commission of the European Communities. Commission Regulation (EC) No. 208/2005 of February 4, 2005. Off. J. Eur. Union 2005.
8. Yurchenko, S.; Mölder, U.; J. Food Comp. Anal.2005, 18, 857.
9. Güler, C.; J. Food Comp. Anal.2007, 20, 262. 10. Guillen, M. D.; Food Addit. Contam.1994, 11, 669.
11. Camargo, M. C. R.; Toledo, M. C. F.; Ciênc. Tecnol. Aliment.
2002, 22, 49.
12. Dobrinas, S.; Birghila, S.; Coatu, V.; J. Food Comp. Anal.2007,
21, 71.
13. Grimmer, G.; Böhnke, H.; J. AOAC Int.1975, 58, 725. 14. García-Falcón, M. S.; Perez-Lamela, M.; Simal-Gándara, J.;
J. Agric. Food Chem.2004, 52, 6897.
15. Galinaro, C. A.; Cardoso, D. R.; Franco, D. W.; J. Agric. Food Chem. 2007, 55, 3141.
16. Bettin, S. M.; Franco, D. W.; Ciênc. Tecnol. Aliment.2005,25, 234.
17. Tfouni, S. A. V.; Machado, R. M. D.; Camargo, M. C. R.; Vitorino, S. H. P.; Vicente, E.; Toledo, M. C. F.; Food Chem.
2007, 101, 334.
18. MAPA, Ministério da Agricultura, Pecuaria e Abastecimento;
O Setor Produtivo da Cachaça, http://www.agricultura,gov.br/
portal, accessed in September 2007.
19. PBDAC, Programa Brasileiro de Desenvolvimento da Cachaça. http://www.atisoline.com.br/pbdac, accessed in March 2006. 20. García-Falcón, M. S.; Simal-Gándara, J.; Food Addit. Contam.
2005,22, 791.
21. Chinnici, F.; Natali, N.; Spinabelli, U.; Riponi, C.; LWT-Food
Sci. Technol.2007, 40, 1587.
22. Toussaint, G.; Walker, E. A.; J. Chromatogr., A1979, 171, 448. 23. Kleinjans, J. C. S.; Moonen, E. J. C.; Dallinga, J. W.; Albering,
24. C. E. C., The Commission of the European Communities; Commission Directiva (EC) No. 10/2005 of 4 February 2005.
Off. J. Eur. Union2005.
25. Simon, R.; Palme, S.; Anklam, E.; Food Chem.2007, 104, 876.
26. Horwitz, W.; Kamps, L. R.; Boyer, K.W.; J. AOAC Int. 1980,
63, 1344.
27. JECFA, Joint FAO/WHO Expert Committee on Food Additives;
64th Meeting, Rome, 2005. http://www.who.int/ipcs/food/jecfa/en,
accessed in October 2005.
Received: May 20, 2008 Web Release Date: March 6, 2009