Article
J. Braz. Chem. Soc., Vol. 23, No. 5, 938-943, 2012. Printed in Brazil - ©2012 Sociedade Brasileira de Química 0103 - 5053 $6.00+0.00
A
*e-mail: [email protected]
Determination of Tetracycline in Environmental Water Samples at a
Graphite-Polyurethane Composite Electrode
Carolina M. F. Calixto, Priscila Cervini and Éder T. G. Cavalheiro*
Instituto de Química de São Carlos, Universidade de São Paulo, Av. Trabalhador São-carlense, 400, 13566-590 São Carlos-SP, Brazil
O eletrodo compósito grafite-poliuretana foi avaliado na determinação de tetraciclina (TC) em amostras de água natural. Utilizando voltametria de pulso diferencial (DPV), uma resposta linear foi observada no intervalo de 4,00-40,0 µmol L-1 com limite de detecção de 2,80 µmol L-1,
sem necessidade de renovação da superfície entre medidas sucessivas. Durante determinação de tetraciclina em amostras de água, foram obtidas recuperações entre 92,6 e 100%. Os resultados para determinação de TC em amostras de água após a etapa de pré-concentração concordam com valor adicionado em um nível de confiança de 95% de acordo com o teste t-student.
A bare graphite-polyurethane composite was evaluated in the tetracycline (TC) determination in natural water samples. Using differential pulse voltammetry (DPV), a linear response was observed in the range of 4.00-40.0 µmol L-1 with limit of detection of 2.80 µmol L-1, without
the need of surface renewing between successive runs. During the tetracycline determination in water samples, recoveries between 92.6 and 100% were found. The results for TC determination in water samples after a pre-concentration stage agreed with spiked value at a 95% confidence level according to student t-test.
Keywords: tetracycline, graphite-polyurethane composite electrode, natural water
Introduction
Tetracyclines (TCs, Figure 1) are a family of antibiotics that have been used for more than 50 years in the treatment
of bacterial infections in both humans and animals.1
Tetracycline residues in biological samples can be directly toxic or cause allergic reactions in some hypersensitive individuals, also promoting the occurrence of antimicrobial-resistant bacteria. However, its concentration
is still very low in that samples.2 To prevent health
problems, some countries from the European Union and the United States have established their own maximum
residue limits for these compounds in livestock products.3-5
Tetracyclines are also active against a wide range of
gram-(+) and gram-(-) aerobic and anaerobic bacteria,
including Spirochete, Actinomyces, Ricketsia and
Mycoplasma.6
Even though tetracyclines may be considered
carcinogenic7,8 and have been implicated in the growing
prevalence of antibiotic resistance in humans,9,10 they are
still largely used against infections, such as respiratory tract infections, urethritis and severe acne. It also has a role in the treatment of multidrug resistant malaria. Adverse effects include gastrointestinal disturbances, renal dysfunction, hepatotoxicity, raised intracranial pressure and skin
infections, like rosacea and perioral dermatitis.11
These antibiotics also have non-therapeutic use since they are widely used in veterinary practice as food additives for cattle, pigs, sheep, poultry and fish. In these cases, they are used in sub-therapeutic doses for growth promotion due to their broad range of activity against
bacteria and low cost.12,13 So, there is a risk that residues
of tetracycline or its metabolites are present in foodstuffs from animals treated with them. This represents an impact on human health because the TCs strongly adsorb onto
environmental materials in which they also maintain their
chemical activity.14,15
Several methods have been used for the tetracycline
determination, including capillary electrophoresis,5,16
fluorescence,14 UV-Vis spectroscopy,17 spectrofluorimetric,18
liquid chromatography-tandem mass spectrometry19,20 and
high performance liquid chromatography.6,21
Although chromatographic procedures usually offer lower limits of detection, electrochemical methods can be an interesting alternative due to their simplicity, less analysis time, low cost and small amount of waste generation.
Voltammetric determination of tetracycline was performed using a disposable screen-printed gold
electrode,12 a multi-walled carbon nanotube-ionic liquid
film coated glassy carbon electrode22 and an anodized
boron-doped diamond thin film electrode.23 In these works,
the limits of detection 0.96 µmol L-1,12 0.3 nmol L-122 and
10 nmol L-123 were measured.
A flow injection analysis of TC with pulsed amperometric detection was also developed, with sensitivity
of 13.7 µA L mmol-1.24 Molecularly imprinted polymers
(MIPs) were developed by precipitation polymerization
using TCs as template.25,26 O`Connor and Aga27 described the
analysis of tetracycline antibiotics in soil and Seifrtová et al.28
presented analytical methodologies for the determination of these antibiotics in environmental waters. The stability
of tetracyclines in water was discussed by Loftin et al.29
According to these authors, tetracyclines undergo degradation in water, including hydrolysis and epimerization. The effects of ionic strength, pH and temperature on such reactions
were reported, and for tetracycline at 22 °C in 4 mmol L-1
phosphate buffer pH 2, a t½ of 306 h was found.
29
The purpose of this work is to investigate the voltammetric behavior and the possibility of TC determination using a 60% (graphite, m/m) bare graphite-polyurethane composite (GPU) electrode in environmental water samples. This
composite was proposed30 and showed to be sensitive and
useful in differential pulse voltammetry (DPV),31 square
wave voltammetry (SWV) 32 and as an amperometric
detector in flow injection analysis33 of antihypertensives.
Experimental
Apparatus
Voltammetric experiments were performed using an
µAUTOLAB Type III potentiostat/galvanostat (Ecochemie,
The Netherlands) coupled to a personal computer and controlled with a GPES 4.9 software (Ecochemie, The Netherlands). A homemade three-electrode glass cell with 25.0 mL full capacity was used with a saturated calomel
electrode (SCE) and a platinum wire as the reference and counter electrodes, respectively. The 60% (graphite, m/m)
GPU30 was used as a working electrode. All measurements
were performed at room temperature without need of degassing the solution.
Reagents and solutions
All reagents used were of the analytical grade and used as received. Solutions were prepared with water purified
in a BarnsteadTM EasyPure® RoDi (Thermoscientific,
D13321, resistivity ≥ 18 MΩ cm) system. Tetracycline
hydrochloride (95%) was purchased from Sigma-Aldrich
(USA), and a 2.00 × 10⁻³ mol L-1 TC stock solution in
0.1 mol L-1 phosphate buffer pH 2.3 was freshly prepared
(just before the measurements) and used for no more
than 12 h. Considering the findings of Loftin et al.,29 the
degradation is negligible under such conditions.
Preparation of the composite electrode
The composite used as working electrode was prepared
as previously described in literature.30 Briefly, following
the manufacturer instructions, polyurethane (PU, from Poliquil, Araraquara, Brazil) wasprepared by taking equal mass amounts of the polyol and hardener, to this mixture, an appropriate amount of graphite (Aldrich, 1-2 µm, USA) was added. These components were mixed in a mortar for 10 min in order to obtain a homogeneous mixture containing 60% of graphite (m/m).
The resulting mixture was inserted in a casting mould and extruded as 3.0 mm diameter rods with a manual press. The composite was cured for 24 h at room temperature and cut in 1.0 cm long rods. A copper wire
(φ = 1.0 mm) was attached to these rods by a silver epoxy
(EPO-TEK 410E, Epoxy Technology, USA) (a conducting resin that establishes the electric contact). This set was then inserted in a 5.0 mm i.d. glass tube and sealed with epoxy resin (Silaex, SQ 2004, Brazil). The electrodes were allowed to cure for additional 24 h.
After curing, the resin in excess was removed using a 600-grit abrasive paper, and the electrode surface
polished with 1.0 µm γ-Al2O3 suspension in an APL-2
polishing wheel (Arotec, Brazil), and sonicated in isopropyl alcohol and water for 5 min in each solvent.
Procedures
Voltammetric measurements were performed using
the 60% (graphite, m/m) GPU composite (φ = 3.0 mm
In order to record all voltammograms, appropriate aliquots of a freshly prepared TC stock solution were diluted in 20.0 mL of phosphate buffer pH 2.3 inside the voltammetric cell.
Pulse amplitude (a) and scan rate (ν) were optimized
for the DPV experiments from a set of values: a = 10 and
50 mV, and ν = 10 and 50 mV s-1, according to a 2n factorial
planning, resulting in four experiments, in phosphate buffer pH 2.3.
Procedures for environmental water sample analysis34
Natural water sample was collected from a lake located in São Carlos City (São Paulo State, Brazil) at 21°59’08”-S and 47°52’58”-W. This collect was done using amber glass bottles that were pre-cleaned with HPLC grade methanol and rinsed with ultrapure water before use. Each water sample was filtered firstly using a
filter paper, and then glass fiber membrane filter (0.45 µm)
(Sartorius, Germany) to remove solid particulate matter. The natural water sample (500 mL) was then acidified to
pH 3.0 with 3.0 mmol L-1 H
2SO4. An aliquot of 100 µL of
1.0 × 10⁻² mol L-1 TC was spiked to 500 mL of this natural
water sample, resulting in a water sample containing
2.00 µmol L-1 of TC.
The solid phase extraction (SPE) procedure was
performed using Oasis® HLB 30 µm Extraction Cartridge
(200 mg, 6.0 mL) (Waters, USA). The cartridges were preconditioned with 6.0 mL of methanol (HPLC grade) and
6.0 mL of ultrapure water, at a flow rate of 2.0 mL min-1.
After the conditioning step, the spiked water samples were percolated through the cartridges at a flow rate of
10.0 mL min-1. Elution was performed with 3 × 2.0 mL
of methanol at 2.0 mL min-1. The extract was evaporated
under a gentle nitrogen stream in a volumetric flask and reconstituted with 100.0 mL of phosphate buffer pH 2.3
to obtain a solution corresponding to 10.0 µmol L-1 in TC.
Then, additions of adequate volumes of 2.00 mmol L-1
TC standard solution were made, and differential pulse voltammograms were recorded in triplicate, as the procedure was repeated three times. This procedure was also repeated in triplicate with TC solutions of ultrapure water to evaluate the efficiency of the extraction procedure.
Results and Discussion
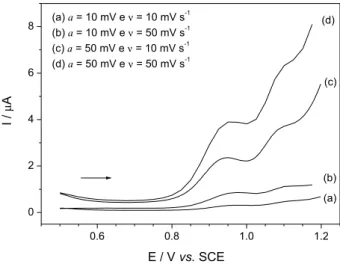
DPV voltammograms of 1.00 × 10⁻⁴ mol L-1 TC
solutions in phosphate buffer pH 2.3 are presented in Figure 2, using 10 and 50 mV pulse amplitude at 10 and
50 mV s-1 scan rates based on a 2n factorial planning. In
these voltammograms, two oxidation peaks appeared at
ca. 960 and 1100 mV (vs. SCE) at the GPU composite
electrode.
Better peak definition was obtained using a = 50 mV,
while higher sensitivities were reached with ν = 10 mV s-1.
For a = 10 mV, very low sensitivity was achieved. Thus,
50 mV and 10 mV s-1 were used as pulse amplitude and scan
rate, respectively, in further studies since less distortion on the peak shapes were observed under such conditions, as can be observed in Figure 2.
Although apparently higher currents were observed in Figure 2 curve d, there is a very high residual current on these voltammograms making the actual faradaic current not as higher as than in curve c.
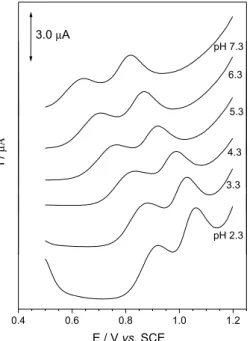
Effect of pH on the DPV voltammograms
Figure 3 depicts the differential pulse voltammograms of TC in phosphate buffer pH 2.3 to 7.3 at the 60% (graphite, m/m) GPU composite electrode. As presented by these results, the oxidation currents decreased with pH increasing over the whole range investigated, while the peaks shifted to less positive potentials. Therefore, it is
evident that the two peaks around 920 and 1060 mV (vs.
SCE) are better resolved in pH 2.3.
Vega et al.15 described only one oxidation peak at a
multi-walled carbon nanotube modified glassy carbon electrode and attributed the signal decreasing at higher pH to the low stability of TC in these conditions.
Wangfuengkanagul et al.23 using a diamond electrode
doped with boron observed the highest current signal for TC at pH 2. They attributed this to the fact that the electrode is negatively charged, while the TC would be a cation at that
pH.23 However, this does not seem to be the only cause for
Figure 2. Differential pulse voltammograms obtained at 60% (graphite, m/m) GPU composite electrode using 1.00 × 10⁻⁴ mol L-1 TC in phosphate
the best response in an acidic medium since in this work it was observed the same fact, without the negative charges on the electrode surface.
Masawat and Slater12 also observed best voltammetric
responses and good resolution for both peaks at a gold
electrode in acidic medium. Chatten et al.35 suggest the
dimethylamino group or phenol as likely sites for the initial
oxidation at a potential less than +1.0 V (vs. SCE). The
amino groups are protonated in the two aqueous acetate buffers pH 4.0 and 5.6 used by those authors, leading them to conclude that the phenolic moiety of the molecule
undergoes an one electron irreversible oxidation.35
On the other hand, Dang et al.36 observed only one TC
oxidation peak around +0.58 V (vs. SCE) and attributed
this peak to the phenolic substituent in position C-10 of TC. The mechanism of electrode process proposed by these authors was based on the oxidation of phenol group to benzoquinone, which is adsorbed at the acetylene black
electrode surface.36
From the peak potential (Ep) vs. pH plots (Figure 4), it
can be observed a break around pH 3.5, with a well-defined linear region between pH 4.3 and 7.3. This break is visible for both TC oxidation peaks and evidences that the pKa is near this region. A more careful analysis of such breaks suggests 3.7 and 3.6 as the approximated values of pKa for the first and second TC oxidation peaks, respectively. Both
are close to the value described in literature (pKa of 3.3).37
A linear dependence of peak potential between pH 4.3 and 7.3 obeyed the following relationships:
1st peak: E
p = 1081 mV − 60 pH
(n = 5 and correlation coefficient of 0.999) (1)
2nd peak: E
p = 1213 mV − 54 pH
(n = 5 and correlation coefficient of 0.997) (2)
The slopes of these equations (pH 4.3-7.3) are close to 59 mV suggesting that the same number of protons and electrons are involved in the redox process, in these cases.
Analytical curve
Using these optimized conditions, an analytical curve
was obtained in the range of 4.00 to 95.0 µmol L-1 TC.
TC concentrations lower than this range did not present well-defined current signals. The curves in Figure 5
Figure 3. Differential pulse voltammograms obtained at 60% (graphite, m/m) GPU composite electrode using 1.00 × 10⁻⁴ mol L-1 TC solution in
phosphate buffer, with different pH values (2.3-7.3), with a = 50 mV and
ν = 10 mV s-1.
Figure 4. Relationship between the peak potential in differential pulse voltammetry and pH, in phosphate buffer solution at different pH values, containing 1.00 × 10⁻⁵ mol L-1 TC.
Figure 5. Dependence of the Differential pulse voltammograms with TC concentration from 4.00 to 95.0 µmol L-1 in phosphate buffer, pH = 2.3,
a = 50 mV, ν = 10 mV s-1 at the 60% (graphite, m/m) GPU composite
were obtained with no need for surface renewal between successive determinations, suggesting that there is no adsorption of the analyte or its oxidation products onto the electrode surface.
The DPV voltammograms showed successive current increase of both peaks when the TC concentration increases. To the first peak, a linear region was determined between
4.00 to 40.0 µmol L-1 in the investigated interval, obeying
the following linear equation:
I = 0.01 µA + 0.03 µA µmol-1 L C
TC,
(n = 7, correlation coefficient of 0.996) (3)
The limit of detection determined as three times the
standard deviation of the blank (Sd) divided by the angular
coefficient of straight line (b)38 was 2.30 µmol L-1. To the
second peak, the peak currents in the interval between 4.00
to 20.0 µmol L-1 obeyed the linear equation:
I = 0.01 µA + 0.06 µA µmol-1 L C
TC,
(n = 6, correlation coefficient of 0.998) (4)
In this case, the limit of detection was 2.60 µmol L-1.
Environmental water sample analysis
The 60% (graphite, m/m) GPU composite electrode was used in the analysis of environmental water that was spiked
to be 2.00 µmol L-1 TC. This spiking level corresponds to
one that may be determined considering the linear range of the proposed procedure.
The sample treatment described in the Experimental
section was adapted from the one presented by Gros et al.,39
that is a recent method developed for the determination of pharmaceuticals in surface and wastewater.
The standard addition method was used for the voltammetric determination of the TC amount present in the water samples. The results obtained for the analysis of three different samples of environmental water
containing a spiked amount of 2.00 µmol L-1 resulted
in 1.93 ± 0.07 µmol L-1, which represents a recovery of
96 ± 3%.
Moreover, a blank sample prepared with water purified in a Barnstead™ system and spiked with the analyte was also analyzed to test the efficiency of the extraction procedure. The results pointed to a recovery of 98 ± 2%,
for a 2.00 µmol L-1 TC solution.
The results agreed at a confidence level of 95% according
to student t-test, thus demonstrating the suitability of the
method for determining these levels of tetracycline in water samples with the help of a pre-concentration step.
A single electrode was used during all measurements here described, showing that the composite electrode has a long useful life. The results obtained in the determination of tetracycline in natural water samples point to even lower limits of detection if the extraction procedure is optimized.
Conclusions
The unmodified composite 60% GPU (graphite, m/m) electrode represents an interesting alternative to be used in differential pulse voltammetry for the tetracycline
determination with limit of detection in the µmol L-1 level.
Although even lower limit of detection were described
in literature,12,22,23 the method here proposed uses a
non-modified and low cost electrode, when compared with
gold,12 carbon-nanotube-ionic liquid film22 and
non-commercial boron-doped diamond thin film.23 In addition,
the GPU electrode is more physically resistant than films. With the results here described (as a first approach), it can be inferred that using other pre-concentration strategies,
even sub-µmol L-1 concentrations can be detected.
The method was satisfactorily applied for TC determination in purified water as well as in lake water samples, revealing no interference from other interferents in the natural environment. Although the higher limits of detection, when compared with tandem mass-chromatography coupled procedures, the method can be considered as a screening procedure with much lower instrumental and analysis costs, and much lower amount of waste generation.
Acknowledgments
The authors are indebted to the Brazilian agency Fundação de Amparo à Pesquisa do Estado de São Paulo (FAPESP) for C. M. F. C. fellowship (Proc. 08/02590-1) and financial support (Grant No. 10/11080-7), as well as to the PROCONTES/PRP/USP Program.
References
1. Fritz, J. W.; Zuo, Y.; Food Chem.2007, 105, 1297. 2. Kowalski, P.; J. Pharm. Biomed. Anal.2008, 47, 487. 3. The Commission of the European Communities; Commission
Regulation No. 508/99; Official Journal of the European Community, 1999, L6/16.
4. The United States Food and Drug Administration (US-FDA), Mill animal drugs for use in animal feeds, Fed. Reg. 1998, 207, 57245.
6. Cristofani, E.; Antonini, C.; Tovo, G.; Fioroni, L.; Piersanti, A.; Galarini, R.; Anal. Chim. Acta 2009, 637, 40.
7. Littlefield, N. A.; Sheldon, W. G.; Allen, R.; Gaylor, D. W.; Food Chem. Toxicol.1990, 28, 157.
8. Doerge, D. R.; Decker, C. J.; Chem. Res. Toxicol.1994, 7, 164. 9. Wegener, H. C.; N. Engl. J. Med.1999, 340, 1581.
10. Fey, P. D.; Safranek, T. J.; Rupp, M. E.; Dunne, E. F.; Ribot, E.; Iwen, P. C.; Bradford, P. A.; Angulo, F. J.; Hinrichs, S. H.; N. Eng. J. Med. 2000, 342, 1242.
11. Jia, A.; Yang, X.; Hu, J.; Asamib, M.; Kunikane, S.; J. Chromatogr., A2009, 1216, 4655.
12. Masawat, P.; Slater, J. M.; Sens. Actuators, B2007, 124, 127. 13. Wegener, H. C.; Curr. Opin. Microbiol.2003, 6, 439. 14. Rodriguéz, N.; Real, B. D.; Ortiz, M. C.; Sarabia, L. A.; Herrero, A.;
Anal. Chim. Acta2009, 632, 42.
15. Vega, D.; Agüí, L.; González-Cortés, A.; Yáñez-Sedeño, P.; Pingarrón, J. M.; Anal. Bioanal. Chem.2007, 389, 951. 16. Candioti, L. V.; Olivieri, A. C.; Goicoechea, H. C.; Talanta
2010, 82, 213.
17. Ni, Y.; Lin, D.; Kokot, S.; Anal. Chim. Acta2008, 606, 19. 18. Rodríguez, N.; Ortiz, M. C.; Sarabia, L. A.; Anal. Chim. Acta
2009, 651, 149.
19. Blasco, C.; Corcia, A. D.; Picó, Y.; Food Chem.2009, 116, 1005. 20. Xu, J.; Ding, T.; Wu, B.; Yang, W.; Zhang, X.; Liu, Y.; Shen, C.;
Jiang, Y.; J. Chromatogr., B 2008, 868, 42.
21. Wang, L.; Yang, H.; Zhang, C.; Mo, Y.; Lu, X.; Anal. Chim. Acta2008, 619, 54.
22. Guo, G.; Zhao, F.; Xiao, F.; Zeng, B.; Int. J. Electrochem. Sci. 2009, 4, 1365.
23. Wangfuengkanagul, N.; Siangproh, W.; Chailapakul, O.; Talanta 2004, 64, 1183.
24. Palaharn, S.; Charoenraks, T.; Wangfuengkanagul, N.; Grudpan, K.; Chailapakul, O.; Anal. Chim. Acta2003, 499, 191.
25. Jing, T.; Gao, X. D.; Wang, P.; Wang, Y.; Lin, Y. F.; Zong, X. C.; Zhou, Y. K.; Mei, S. R.; Chin. Chem. Lett.2007, 18, 1535. 26. Jing, T.; Wang, Y.; Dai, Q.; Xia, H.; Niu, J.; Hao, Q.; Mei, S.;
Zhou, Y.; Biosens. Bioelectron.2010, 25, 2218.
27. O’Connor, S.; Aga, D. S.; TrAC, Trends Anal. Chem. 2007, 26, 456.
28. Seifrtová, M.; Novakova, L.; Lino, C.; Pena, A.; Solich, P.; Anal. Chim. Acta2009, 649, 158.
29. Loftin, K. A.; Adams, C. D.; Meyer, M. T.; Surampalli, R.; J. Environ. Qual.2008, 37, 378.
30. Mendes, R. K.; Claro-Neto, S.; Cavalheiro, E. T. G.; Talanta 2002, 57, 909.
31. Cervini, P.; Ramos, L. A.; Cavalheiro, E. T. G.; Talanta 2007, 72, 206.
32. Cervini, P.; Cavalheiro, E. T. G.; Eclet. Quím.2006, 31, 59. 33. Cervini, P.; Cavalheiro, E. T. G.; Anal. Lett. 2008, 41, 1867.
34.Miao, X.-S.; Bishay, F.; Chen, M.; Metcalfe, C. D.; Environ. Sci. Technol.2004, 38, 3533.
35. Chatten, L. G.; Fleischmann, M.; Pletcher, D.; J. Electroanal. Chem. 1979,102, 407.
36. Dang, X.; Chengguo, H.; Wei, Y.; Chen, W.; Hu, S.; Electroanalysis2004, 16, 1949.
37. Reeuwijk, H. J. E. M.; Tjaden, U. R.; J. Chromatogr.1986, 35, 339.
38. Long, G. L.; Winefordner, J. D.; Anal. Chem.1983, 55, 712A. 39. Gros, M.; Petrović, M.; Barceló, D.; Talanta 2006, 70, 678.
Submitted: July 29, 2011
Published online: April 19, 2012