ISSN 0104-6632 Printed in Brazil
www.abeq.org.br/bjche
Vol. 25, No. 01, pp. 83 - 94, January - March, 2008
of Chemical
Engineering
EFFECTS OF BINARY PARTICLE SIZE
DISTRIBUTION ON THE FLUID DYNAMIC
BEHAVIOR OF FLUIDIZED, VIBRATED
AND VIBROFLUIDIZED BEDS
R. V. Daleffe, M. C. Ferreira and J. T. Freire
*Programa de Pós-Graduação em Engenharia Química, PPGEQ, Universidade Federal de São Carlos, UFSCar, Phone +(55) (16) 3351-8687, Fax: (55) (16) 3351-8266, Rodovia Washington Luiz, km 235,
P.O. Box 676, CEP: 13565-905, São Carlos - SP, Brazil. E-mail: [email protected]
(Received: March 9, 2006 ; Accepted : November 9, 2007)
Abstract - In this work the effects of particle size distribution on the dynamics and segregation patterns in fluidized, vibrated and vibrofluidized beds were investigated. A binary particle size distribution and a reference one composed of glass spheres with a mean Sauter diameter of 2.18×10⁻³ m were tested. The experimental setup consisted basically of a circular glass chamber with a height of 0.50 m and a diameter of 0.114 m, operated in the fluidized bed mode (* = 0.00), in either vibrated or vibrofluidized bed modes (* = 2.00). The pressure drops in the fluidized and vibrofluidized beds were not significantly affected by the binary particle size distribution. Well-defined segregation patterns occurred in fluidized and vibrated beds with small particles concentrating at the top and large particles at the bottom in the first situation and the reverse in the second one. Segregation patterns in vibrofluidized beds depended on the values of vibration parameters. Segregation in vibrofluidized and vibrated beds was minimized by operating at a high amplitude of vibration.
Keywords: Vibrofluidized bed; Vibrated bed; Fluidized bed; Fluidization; Particle size distribution; Size segregation.
INTRODUCTION
The handling of particles with a wide distribution of sizes is common in the processing of particulate materials, such as in drying. Even if they are originally uniform, the size and mass of particles may undergo changes during processing, resulting in particles with nonuniform characteristics. In the drying of pastes in beds operated with inert particles, for instance, the formation of liquid and/or solid bridges may cause particle agglomeration, giving rise to clusters and increasing particle size distribution (Chen et al., 1991). In gas-solid fluidized beds, the presence of particles with different densities and/or sizes may cause vertical segregation
made of particles with identical densities and different sizes, segregation is likely to occur when there is a significant difference in the drag force per unit weight between different particles. Particles subjected to higher values of drag force per unit weight (the smaller particles) tend to migrate to top of the bed, while the ones subjected to low values of drag per unit weight tend to sink to the bottom (Chiba et al., 1980).
Gibilaro and Rowe (1974) and Naimer et al. (1982) discussed in detail the mechanisms of mixing and segregation in fluidized beds and proposed models to describe particle segregation in binary mixtures of solids fluidized by a gas. Authors such as Cheung et al. (1974), Chiba et al. (1979), Noda et al. (1986) and Formisani (1991) investigated the minimum superficial velocity required for fluidizing mixtures of solids of different sizes. In spite of all the research reported in the literature, it seems there is still no general criterion to identify the minimum fluidization velocity of mixtures of particles (Gauthier et al., 1999).
A vibrated bed consists of a granular bed of solids subjected to a continuous mechanical vibration with no air percolation. Segregation in vibrated granular beds containing a mixture of particulate material of different sizes has been extensively investigated. Rosato et al. (1987) mentioned the occurrence of the “Brazil nut effect.” This is a well-known phenomenon that occurs when a mixture of particles of different sizes contained in a vessel are subjected to a vertical vibration: the larger particles tend to migrate to the top of the bed, while the smaller ones tend to sink to the bottom (Bridgwater, 1976; Williams, 1976). The physical mechanisms causing this effect are not yet fully understood and have intrigued researchers over the last 70 years (Rosato et al., 1987). Among the possible mechanisms causing this segregation pattern the “percolation” model and the “granular convection” model have been suggested. The first model considers that when a mixture of multisized particles is shaken, the smaller particles fill in the transient gaps that open beneath the larger particles in a kind of “geometrical rearrangement” that dislocates the large particles to the top of the container. Although the gravitational force acts on every particle, only the smaller ones can fill in the gaps (Williams, 1976; Rosato et al., 1987; Jullien et al., 1992). In the convection model, it is assumed that particles in a shaking recipient undergo a convective flow, rising at the middle and falling at the sides. Segregation occurs because the large particles, once swept up to the top of the recipient, cannot be entrained into the downflow through the very narrow outer region of downward
1993; Shinbrot and Muzzio, 1998). Other possible mechanisms are still under investigation, among them condensation, granular diffusion, controlled reorganization, entropy (in a zero gravity environment) and the inertial mechanism (Hong et al., 2001). Segregation in vibrated beds is affected not only by the size of particles, but also by other particle characteristics and by characteristics of the granular bed and of the equipment as well. Such characteristics include particle density and shape, angle of repose, granular temperature gradients, vibration parameters, presence of electrostatic charges, etc. (Akiyama and Nishiyama, 1994; Huerta and Suárez, 2004).
Vibrofluidized beds combine air percolation and mechanical vibration simultaneously and thus are considered an appealing alternative for the drying of adhesive, cohesive or pasty materials. Vibration supplies additional energy to produce vertical dislocation of particles and also contributes to reducing particle agglomeration by breaking up liquid and/or solid bridges. To quantify the effects of vibration on the dynamic behavior of particles the
dimensionless vibration number (*), defined as
follows is usually adopted:
2 A (2 f )
g S
* (1)
where A and f are respectively the amplitude and the frequency of vibration and g is the acceleration of gravity.
Daleffe et al. (2005) carried out a number of experimental investigations on the fluid dynamics in vibrofluidized beds and reported very different
dynamic patterns with identical values of *, since
different values of A and f might be combined to
yield identical values of *. For this reason the
authors have questioned the use of the dimensionless vibration number as the only parameter to quantify the vibration effects on fluidized beds. They suggested that, besides the dimensionless vibration number, the amplitude or the frequency of vibration should be addressed as well in order to fully characterize a given operational condition.
considered questionable by a few authors, probably
because the dimensionless vibration number (*) is
often used as the only quantification of vibration conditions, leading to analytical misinterpretations for the reasons previously discussed in Daleffe et al. (2005).
From this brief review it can be verified that there is a considerable amount of work discussing the effects of particle size distribution on fluid dynamics and segregation patterns in fluidized beds, but on vibrofluidized beds, the research is still incipient. In vibrated beds, on the other hand, there are still gaps in the available theories adopted to describe size segregation. The purpose of the present work is to experimentally investigate the effects of a binary particle size distribution on the fluid dynamics behavior of fluidized, vibrated and vibrofluidized beds and to evaluate the segregation patterns in these beds under different conditions.
EXPERIMENTAL METHODOLOGY
Experimental Setup and Materials
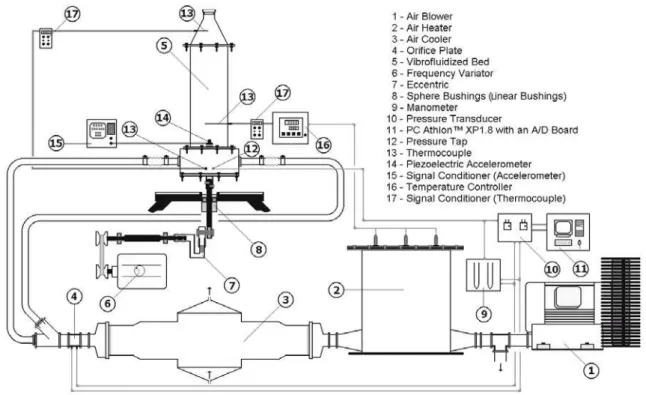
The experimental apparatus is depicted in Figure 1. The vibrofluidized bed is composed of a circular glass chamber with a height of 0.50 m, a diameter of 0.114 m and a wall thickness of 0.003 m. Air is provided by a blower and the airflow rate is obtained using a previously calibrated orifice plate. Both the orifice plate and the pressure tap located at the
bottom of the bed are connected to pressure transducers linked to a data acquisition system. The data acquisition system was developed in the graphic language G, using the software Labview 7 Express
TM
, with an acquisition board A/D PCI-6024E from
National Instruments in an AMD AthlonTM XP 1800+
computer. Air temperature was kept constant using an electrical resistance heater connected to a controller. A water cooler is used as an auxiliary piece of equipment to control temperature. An eccentric mechanism is used to adjust the amplitude of vibration and a mechanical controller located at the axle of the electric motor allows for the adjustment of frequency of vibration. The acceleration, velocity and amplitude of vibration are obtained with a Brüel & Kjær 4371 piezoelectric accelerometer linked to a Brüel & Kjær 2525 signal conditioner. Frequency of vibration is measured with an optical tachometer Minipa MDT-2244A. For image acquisition a digital camera Sony DSC-V1 mounted on a tripod with an effective resolution of 5.0
mega pixels and Carl Zeiss® Vario-SonnarTM lenses is
used. For sampling of particles from the bed an Electrolux A10 vacuum cleaner, properly modified to reduce its suction power, is used (José et al., 1994). This was done by replacing the original internal filter with one with a reduced flow area in order to increase the pressure losses and obtain smaller suction velocities. The original collection tip was also replaced with a smaller one with a reduced transverse section area in order to minimize disturbances in the granular bed during the samplings.
“Ballotini” glass spheres with a density of 2,500
(r 5) kg/m3, determined by picnometry, and mean
diameters of 1.29×10⁻³, 2.18×10⁻³ and 3.67×10⁻³ (r
0.05×10⁻³) m were used in the experiments. The total
mass of inerts used in every essay was 1.6 (r 0.1×10
-3
) kg, corresponding to a static bed height of 0.10 (r
0.05×10⁻²) m.
Experimental Procedure
The bed was operated in three modes: vibrofluidized (with simultaneous vibration and aeration), vibrated (with vibration only) and fluidized (with aeration only). All the experiments were replicated in order to check the reliability of the data. To minimize the presence of electrostatic charges, an earthed copper wire was wound around the chamber wall with the rings located equidistant
from one another - 1.0×10⁻² (r 0.05×10⁻²) m. The
tests were carried out at a constant temperature of 40
(r 0.5) º C.
A binary particle size distribution was tested, as shown in Table 1. The was composed of binary distribution particles with two different sieved mean diameters combined with results on the same Sauter
particle diameter (ds), as defined by
s
i
i i
1 d
X dp
¦
(2)where Xi is the particle mass fraction with dpi as the
mean diameter. The reference diameter adopted was
ds = 2.18×10⁻³ m.
Some preliminary tests allowed the establishment of the intervals of vibration parameters. To obtain a
given value of dimensionless vibration number (*),
different combinations of amplitude (A) and frequency of vibration (f) were chosen. The values of
* were set at 0.0 (in the tests with fluidized beds)
and 2.0 (r 5%) with amplitudes of 0.000, 0.003 and
0.009 (r 0.005×10⁻¹) m and frequencies of vibration
of 0.00, 7.43 and 12.87 (r 0.5%) Hz.
Fluid dynamic experiments were carried out by adjusting the parameters for a given experiment, and then keeping the bed fluidized until stabilization of the operational conditions. The characteristic curves of either the fluidized or the vibrofluidized bed were then obtained. Pressure drops were measured as a function
of the superficial air velocity (Us), according to the
classical methodology described by Bratu and Jinescu (1971). For every particle and set of vibration parameters, the pressure drops were measured as the superficial air velocity was reduced. Simultaneously, the standard deviations for pressure drop were recorded by the data acquisition system. The data were collected at a rate of 500 points in 3 seconds.
The complete fluidization velocity (Ufc), defined
as the minimum air velocity at which all the particles are suspended (Tannous et al., 1998; Gauthier et al., 1999), was determined for each condition. To ensure that all the particles were suspended, particularly in the experiments involving a binary particle size distribution, the air fluidization velocity was kept at
a value 10% above Ufc.
For analysis of segregation samples of particles from the bed are taken by inserting the modified probe tip vertically at three different vertical positions, located at distances of 0.00, 0.05 and 0.10
(r0.05×10-2) m from the plate distributor. The
experiments were performed as follows: a mixture of particles was prepared and after adjusting the vibration parameters, the particles were fed into the bed. The bed was then operated during 6 minutes at a
fluidization velocity 10% above Ufc. During this time
the operation was filmed and photographed to complement the analysis of results. The solids samples were obtained in static beds at the specified heights after cutting off the air supply and vibration. The modified system developed allowed a uniform and continuous sampling of a representative amount
of particles (0.16r0.1×10-3 kg), with minimum
disturbances in the granular bed of particles. At every height, the samplings were obtained by scanning the whole transversal section area. The samples were then sifted to determine their size distributions.
Table 1: Composition of particle size distribution with ds = 2.18×10 -3
m (Bacelos and Freire, 2006).
Distribution % Xi dp(10-3 m) Sieves (10-3 m)
reference 100.00 2.18 2.00-2.36
37.10 1.29 1.18-1.40
binary
RESULTS AND DISCUSSION
Figure 2 depicts characteristic curves and standard pressure drop deviations for the fluidized beds with uniform sizes (a) and with the binary particle size distribution and the reference one (b). The data show the typical behavior observed in fluidization as the size of inert particle is increased, that is, the minimum fluidization velocity increases and the pressure drop in the fixed bed region decreases. Such a behavior occurs because the larger and heavier particles require higher air flow rates to be fluidized, since the drag and gravitational forces acting on the bed of particles must be balanced. In the fixed bed region, the larger particles provide more permeable beds, favoring the flow of air through the bed and reducing the pressure drop. Figure 2 (b) shows that particle size distribution has little effect on the pressure drop in the bed. The binary distribution curve is slightly under the reference, particularly at the transition region between the fixed and fluidized regimes. The standard deviations for pressure drop, though, clearly show a delay in the onset of fluidization for this size distribution.
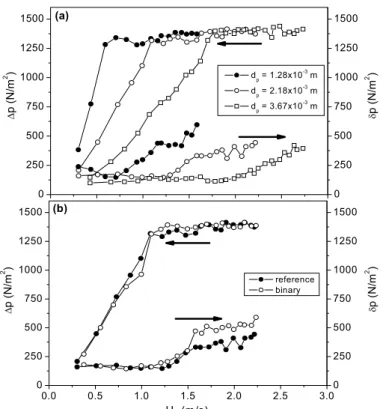
It can be seen in Figures 3 (a) and 3 (b) that low amplitude (0.003 m) and high frequency (12.87 Hz) of vibration did not cause a significant change in the
dynamic behavior of inert particles, as compared to those presented in Figures 2 (a) and 2 (b). In Figure 3 (b) one can observe that the complete fluidization velocity and pressure drop in the bed are approximately the same for the binary distribution and the reference one.
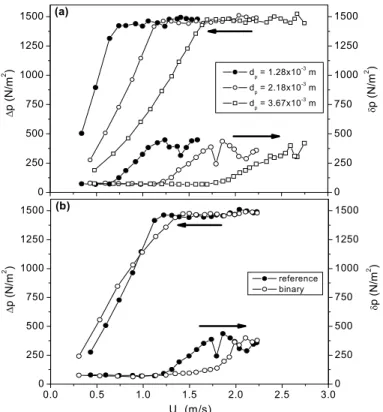
When the vibrofluidized bed was operated at a high amplitude (0.009 m) and low frequency of vibration (7.43 Hz), the dynamics of particles were more affected by vibration parameters than in the previous case, as can be noted in Figures 4 (a) and 4 (b). The increase in amplitude of vibration, accompanied by a drop in frequency, resulted in more expanded beds, favoring air percolation and reducing pressure drops. The transition between the fixed and fluidized regimes was softened as well, and complete fluidization velocities are not as clearly defined as in the curves shown in Figure 3. Since air percolation became easier, the onset of fluidization was delayed and, compared to the previous case, the complete fluidization velocities were higher. An inspection of Figures 3 and 4 also shows that with an identical value of dimensionless
vibration number (* = 2.00), very different fluid
dynamic patterns might be observed, corroborating that this parameter alone does not characterize the vibration conditions, as previously observed by Daleffe et al. (2005).
0 250 500 750 1000 1250 1500
0 250 500 750 1000 1250 1500
G
p (N/m
2 )
'
p (N/m
2 ) dp = 1.28x10
-3
m
dp = 2.18x10⁻³
m
dp = 3.67x10⁻³
m
(a)
0.0 0.5 1.0 1.5 2.0 2.5 3.0
0 250 500 750 1000 1250 1500
0 250 500 750 1000 1250 1500
reference binary
(b)
G
p (
N
/m
2 )
Us (m/s)
'
p (N/
m
2 )
0 250 500 750 1000 1250 1500 0 250 500 750 1000 1250 1500 ' p (N /m
2 ) dp = 1.28x10
-3
m
dp = 2.18x10⁻³
m
dp = 3.67x10⁻³
m (a) G p ( N /m 2 )
0.0 0.5 1.0 1.5 2.0 2.5 3.0
0 250 500 750 1000 1250 1500 0 250 500 750 1000 1250 1500 reference binary ' p (N/ m 2 ) G p ( N /m 2 ) U
s (m/s) (b)
Figure 3: Pressure drop in the bed and its standard deviations as a function of superficial air velocity;
* = 2.00; A = 0.003 m; f = 12.87 Hz; (a) uniform sizes; (b) binary particle size distribution.
0 250 500 750 1000 1250 1500 0 250 500 750 1000 1250 1500 ' p (N/m 2 ) (a) G p (N/m 2 )
dp = 1.28x10 -3
m
dp = 2.18x10⁻³
m
dp = 3.67x10 -3
m
0.0 0.5 1.0 1.5 2.0 2.5 3.0
0 250 500 750 1000 1250 1500 0 250 500 750 1000 1250 1500 (b) reference binary
Us (m/s)
' p (N/m 2 ) G p( N/ m 2 )
Figure 4: Pressure drop in the bed and its standard deviations as a function of superficial air velocity;
In Figure 5 (a) the particle mass fraction for the
binary distribution as a function of dp for a fluidized
bed is presented and in Figure 5 (b), a photo of the bed obtained during operation. The occurrence of segregation is clearly noted in Figure 5 (a). In the three measurement positions, the compositions of the mixture are different from the original and a vertical concentration gradient appears over the entire bed height. Analysis of Figures 5 (a) and 5 (b) indicates that most of the small particles were dragged by the air and migrated to the top of the bed, while a significant fraction of large particles stayed preferentially at the bottom, a behavior that agrees with reports in the literature (Gibilaro and Rowe, 1974; Wu and Baeyens, 1998). At the middle bed height, the concentration was approximately 50% of particles of each size, a uniform composition, but very different from the original one. The presence of small and large particles at H = 0.05 m as well as layers of large particles at the bottom and of small particles at the top of the bed can be seen in Figure 5 (b).
The mass fraction as a function of particle
diameter for the binary distribution in a vibrofluidized bed at low amplitude of vibration is depicted in Figure 6 (a), and a photo of the bed under operation is shown in Figure 6 (b). Under this condition, particle mixing was better than that in the fluidized bed, with a lower concentration gradient throughout the bed height. A segregation pattern is still observed though, with the small particles tending to migrate to the top of the bed and the large particles tending to sink to the bottom. At the middle height, the composition of the mixture is close to that of the original distribution, but considering the entire bed height, the tendency of segregation is clear. For a vibrofluidized bed operated with high amplitude of vibration and low frequency, the original composition is maintained for the entire bed height, with no tendency for segregation being observed, as show in Figure 7 (a). A comparison between Figures 6 (b) and 7 (b) shows a more expanded bed at a higher amplitude of vibration, which probably helps to produce the mixing of particles. It is worth noting that both behaviors were
obtained for a value of * = 2.00.
1.0 1.5 2.0 2.5 3.0 3.5 4.0 0.0
0.2 0.4 0.6 0.8 1.0
Xi
(-)
dpx103 (m)
binary distribution H = 0.10 m H = 0.05 m H = 0.00 m
(a) (b)
Figure 5: Fluidized bed; * = 0.00; Us = 1.57 m/s; (a) Xi as a function of dp;
1.0 1.5 2.0 2.5 3.0 3.5 4.0 0.0
0.2 0.4 0.6 0.8 1.0
d
px10 3
(m)
binary distribution H = 0.10 m H = 0.05 m H = 0.00 m
Xi
(-)
(a) (b)
Figure 6: Vibrofluidized bed; * = 2.00; A = 0.003 m; f = 12.87 Hz; Us = 1.33 m/s
(a) Xi as a function of dp; (b) photo of the bed under operation.
1.0 1.5 2.0 2.5 3.0 3.5 4.0 0.0
0.2 0.4 0.6 0.8 1.0
Xi
(-)
dpx103 (m)
binary distribution H = 0.10 m H = 0.05 m H = 0.00 m
(a)
(b)
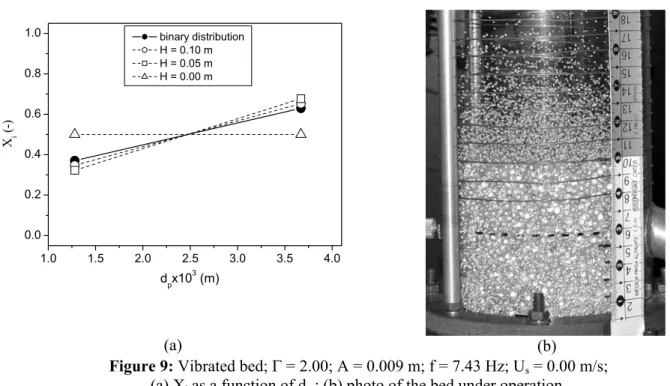
Figure 7: Vibrofluidized bed; * = 2.00; A = 0.009 m; f = 7.43 Hz; Us = 1.50 m/s;
The results shown in Figure 8 were obtained in a vibrated bed (without aeration) with vibration conditions identical to those in Figure 6. Figure 8 (a) indicates the tendency of the small particles to migrate to the bottom of the bed, with particle concentrations close to the original ones at the top of the bed. Analysis of Figure 8 (a) might suggest that at the middle and top bed heights, the particles are perfectly mixed, but such a behavior was not really observed, as can be seen in Figure 8(b), where a segregating pattern with small particles over an intermediary layer of large ones is detected in the expanded bed. Bed vibration caused collisions between small and large particles, and the smaller ones were lifted by vibration. The large particles, which tended to migrate to the top, formed a physical barrier that prevented percolation of all the small particles to the bottom of the bed. These particles did not penetrate the mixture, forming a thin layer of small particles over the large ones. In the particle sampling, the air supply and vibration were cut off and the small particles deposited over the top of the bed were suctioned with the large ones, resulting in nonrepresentative measurements of particle concentration at this position.
Figure 9 shows the results obtained in a vibrated bed under vibration conditions identical to those in Figure 7. Raising the amplitude of vibration produced better particle mixing than that shown in Figure 8 for a lower amplitude. A segregation pattern is still detected, though, with the large particles tending to migrate to the top of the bed. A comparison of results in Figures 8 and 9 again shows
very different fluid dynamic patterns obtained with
the same value of *. In general, a high amplitude
(and low frequency) produces an expanded bed, while a low amplitude (and high frequency) produces a compact bed. The resulting differences in the local structures, voidages and circulation patterns define the different behaviors observed experimentally.
An analysis of segregation patterns obtained in the different beds indicates that in fluidized beds, the drag forces acting on the particles predominate, with the air carrying the small particles to the top of the bed. In vibrated beds, on the other hand, it is the forces related to vibration that control segregation, with the large particles moving to the top. In vibrofluidized beds, those forces may be compromised in order to improve the mixing and minimize segregation. By adequately choosing the vibration parameters and aeration rates, different degrees of mixing can be achieved. In a practical situation, additional factors may have to be considered. In the drying of pastes, for instance, the presence of solid or liquid bridges may affect the bed dynamics and even change the particle size distributions, modifying the segregation patterns. Differences in the density or shape of particles may also produce different segregation patterns. The point, however, is that the versatile characteristics of vibrofluidized beds allow their operation with very different dynamic behaviors by only changing the operating parameters, which is an appealing feature to be explored in industrial applications involving segregation.
1.0 1.5 2.0 2.5 3.0 3.5 4.0 0.0
0.2 0.4 0.6 0.8 1.0
dpx103 (m)
Xi
(-)
binary distribution H = 0.10 m H = 0.05 m H = 0.00 m
(a) (b)
Figure 8: Vibrated bed; * = 2.00; A = 0.003 m; f = 12.87 Hz; Us = 0.00 m/s;
1.0 1.5 2.0 2.5 3.0 3.5 4.0 0.0
0.2 0.4 0.6 0.8 1.0
Xi
(-)
dpx103 (m)
binary distribution H = 0.10 m H = 0.05 m H = 0.00 m
(a) (b)
Figure 9: Vibrated bed; * = 2.00; A = 0.009 m; f = 7.43 Hz; Us = 0.00 m/s;
(a) Xi as a function of dp; (b) photo of the bed under operation.
CONCLUSIONS
In beds of particles of uniform size, the velocity of complete fluidization increases as the particle diameter is increased and the pressure drop is reduced. Such a reduction occurs until the onset of fluidization. Once the particles are fluidized, the pressure drop in the bed is no longer affected by the increase in particle diameter. The fluid dynamic behavior, investigated through the measurement of pressure drop and pressure deviations as a function of air velocity, was not significantly affected by binary particle size distribution under the conditions tested.
In fluidized beds with a binary distribution of particles, clear segregation patterns were observed, with larger concentrations of small particles at the top and of large particles at the bottom of the beds. In vibrated beds the segregation patterns showed the opposite behavior, with the large particles concentrating at the top and the small ones at the bottom. The segregation patterns in vibrofluidized beds changed depending on the operational conditions. At a low amplitude of vibration the pattern was similar to that of the fluidized bed, but a better degree of mixing was achieved, since the gradient concentration throughout the bed height was softened in the presence of vibration. Operation at a high amplitude of vibration seemed to be the better
particles were completely mixed along the bed height for all the particle distributions tested. The
results also show that the use of a same value of *
with different combinations of amplitude and frequency of vibration produces very different fluid dynamics behaviors. This confirms that the dimensionless vibration number should not be adopted as a universal parameter to characterize the dynamics of vibrofluidized beds.
ACKNOWLEDGEMENTS
The authors thank the Brazilian funding agencies CNPq, PRONEX and FAPESP for their financial support.
NOMENCLATURE
A amplitude of vibration m
dp particle mean diameter m
ds Sauter mean diameter m
f frequency of vibration Hz
g acceleration of gravity m/s2
H bed static height m
Ufc complete fluidization
velocity
m/s
'p pressure drop in the bed N/m2
Gp standard deviation of
pressure drop in the bed
N/m2
* dimensionless vibration
number
(-)
REFERENCES
Akiyama, T. and Nishiyama, R., Solids Mixing in Vibrating Particle Beds – Effect of a Tube Submerged in the Bed. Powder Technology, 80, No. 1, 11 (1994).
Bacelos, M.S. and Freire, J.T., Stability of Spouting Regimes in Conical Spouted Beds with Inert Particle Mixtures. Industrial & Engineering Chemistry Research, 45, No. 2, 808 (2006).
Beeckmans, J.M., Nilsson, J. and Large, J.F., Observations on the Mechanisms of Segregation in Flotsam-Rich, Fully Fluidized-Beds. Industrial & Engineering Chemistry Fundamentals, 24, No. 1, 90 (1985).
Bratu, E. and Jinescu, G.I., Effect of Vertical Vibrations on the Pressure Drop in a Fluidized Layer. British Chemical Engineering, 16, No. 8, 691 (1971).
Bridgwater, J., Fundamental Powder Mixing Mechanisms. Powder Technology, 15, No. 2, 215 (1976).
Chen, Y.L., Lin, P.S. and Peng, Y.L., Particle Agglomeration Characteristics in Vibro-Fluidized Bed Dryers. Journal of Chemical Engineering of Japan, 24, No. 5, 669 (1991).
Cheung, L., Nienow, A.W. and Rowe, P.N., Minimum Fluidization Velocity of a Binary Mixture of Different Sized Particles. Chemical Engineering Science, 29, No. 5, 1301 (1974). Chiba, S., Nienow, A.W., Chiba, T. and Kobayashi,
H., Fluidized Binary-Mixtures in Which the Denser Component May Be Flotsam. Powder Technology, 26, No. 1, 1 (1980).
Chiba, S., Tanimoto, H., Kobayashi, H. and Chiba, T., Measurement of Solid Exchange Between the Bubble Wake and the Emulsion Phase in a 3-Dimensional Gas-Fluidized Bed. Journal of Chemical Engineering of Japan, 12, No. 1, 43 (1979).
Daleffe, R.V. and Freire, J.T., Analysis of the Fluid-dynamic Behavior of Fluidized and Vibrofluidized Bed Containing Glycerol. Brazilian Journal of Chemical Engineering, 21, No. 1, 35 (2004). Available on-line at:
http://www.scielo.br/scielo.php?script=sci_arttext&pi d=S0104-66322004000100005&lng=en&nrm=iso Daleffe, R.V., Ferreira, M.C. and Freire, J.T., Drying
of Pastes in Vibro-Fluidized Beds: Effects of the Amplitude and Frequency of Vibration. Drying Technology, 23, No. 9-11, 1765 (2005).
Formisani, B., Packing and Fluidization Properties of Binary-Mixtures of Spherical-Particles. Powder Technology, 66, No. 3, 259 (1991).
Gauthier, D., Zerguerras, S. and Flamant, G., Influence of the Particle Size Distribution of Powders on the Velocities of Minimum and Complete Fluidization. Chemical Engineering Journal, 74, No. 3, 181 (1999).
Gibilaro, L.G. and Rowe, P.N., Model for a Segregating Gas Fluidized-Bed. Chemical Engineering Science, 29, No. 6, 1403 (1974). Gupta, R. and Mujumdar, A.S., Aerodynamics of a
Vibrated Fluid Bed. The Canadian Journal of Chemical Engineering, 58, p. 332 (1980).
Hong, D.C., Quinn, P.V. and Luding, S., Reverse Brazil Nut Problem: Competition Between Percolation and Condensation. Physical Review Letters, 86, No. 15, 3423 (2001).
Huerta, D.A. and Suarez, J.C.R., Vibration-Induced Granular Segregation: A Phenomenon Driven by Three Mechanisms. Physical Review Letters, 92, No. 11, 1 (2004).
José, M.J.S, Olazar, M., Penas, F.J. and Bilbao, J., Segregation in Conical Spouted Beds with Binary and Ternary Mixtures of Equidensity Spherical-Particles. Industrial & Engineering Chemistry Research, 33, No. 7, 1838 (1994).
Jullien, R., Meakin, P. and Pavlovitch, A., Three-Dimensional Model for Particle-Size Segregation by Shaking. Physical Review Letters, 69, No. 4, 640 (1992).
Knight, J.B., Jaeger, H.M. and Nagel, S.R., Vibration-Induced Size Separation in Granular Media – The Convection Connection. Physical Review Letters, 70, No. 24, 3728 (1993).
Naimer, N.S., Chiba, T. and Nienow, A.W., Parameter-Estimation for a Solids Mixing Segregation Model for Gas-Fluidized Beds. Chemical Engineering Science, 37, No. 7, 1047 (1982).
Noda, K., Uchida, S., Makino, T. and Kamo, H., Minimum Fluidization Velocity of Binary Mixture of Particles with Large Size Ratio. Powder Technology, 46, No. 2-3, 149 (1986).
-Size Segregation of Particulate Matter by Shaking. Physical Review Letters, 58, No. 10, 1038 (1987).
Shinbrot, T. and Muzzio, F.J., Reverse Buoyancy in Shaken Granular Beds. Physical Review Letters, 81, No. 20, 4365 (1998).
Tannous, K., Hemati, M. and Laguerie, C., Hydrodynamic Characteristics of Fluidized Beds
Containing Large Polydispersed Particles. Brazilian Journal of Chemical Engineering, 15, No. 1, 67 (1998).
Williams, J.C., Segregation of Particulate Materials – Review. Powder Technology, 15, No. 2, 245 (1976). Wu, S.Y. and Baeyens, J., Segregation by Size