Article
J. Braz. Chem. Soc., Vol. 25, No. 9, 1583-1591, 2014. Printed in Brazil - ©2014 Sociedade Brasileira de Química 0103 - 5053 $6.00+0.00
A
*e-mail: [email protected]
Multivariate Optimization of the QuEChERS-GC-ECD Method and Pesticide Investigation
Residues in Apples, Strawberries, and Tomatoes Produced in Brazilian South
Juliana G. Lorenz,*,a Léa L. F. Costa,b Eliane A. Sucharac and Ernani S. Sant’Annaa
aDepartamento de Ciência e Tecnologia de Alimentos, Universidade Federal de Santa Catarina,
Rodovia Admar Gonzaga, 1346, 88034-001 Florianópolis-SC, Brazil
bLaboratório Central de Saúde Pública, Secretária de Estado da Saúde de Santa Catarina,
Avenida Rio Branco, 152, 88015-201 Florianópolis-SC, Brazil
cUniversidade Federal de Mato Grosso, Campus Universitário do Araguaia,
Avenida Valdon Varjão, 6390, 78600-000 Barra do Garça-MT, Brazil
Culturas como maçã, morango e tomate estão entre os alimentos de maior contaminação por uso de pesticidas no Brasil. Pensando nisso, a otimização multivariada do método QuEChERS, acoplado ao CG-ECD, foi proposta a fim de investigar os níveis de resíduos dos pesticidas clorpirifós, dimetoato, malationa, mevinfós, pedimentalina, simazina e trifluralina em maçãs, morangos e tomates produzidos no Estado de Santa Catarina, sul do Brasil. O processo envolveu os planejamentos fatorial completo 24 e Doehlert seguido de validação do método modificado e aplicação em 91 amostras reais coletadas durante os anos de 2010 e 2011. As modificações realizadas no método proporcionaram aumento de detectabilidade e valores satisfatórios de linearidade, precisão e exatidão. Nas amostras reais, resíduos de pelo menos um pesticida (≥ LOQ) foram encontrados em 8 (27,6%) amostras de maçãs, 12 (40,0%) morangos e 17 (53,1%) tomates. Os resultados indicaram a necessidade de monitoramento contínuo para o uso destes pesticidas em frutas e vegetais.
Apple, strawberry and tomato are among the foods with higher contamination for pesticide use in Brazil. Thereby, a multivariate optimization of the QuEChERS method coupled to GC-ECD was proposed to investigate the level of pesticides residues clorpyrifos, dimethoate, malathion, mevinphos, pedimentalina, simazine and trifluralin in apple, strawberries and tomatoes produced in Santa Catarina state, South of Brazil. The process involved a two-level full factorial and Doehlert designs followed by validation of the modified method and its application in 91 real samples collected during the years 2010 and 2011. Modifications in the method provided increased detectability and satisfactory values of linearity, accuracy and precision. In real samples, residues of at least one pesticide (≥ LOQ) were found in 8 (27.6%) apple, 12 (40.0%) strawberry and 17 (53.1%) tomato samples. The results indicated the necessity of continuous monitoring for pesticide use in fruits and vegetables.
Keywords: pesticides, QuEChERS, multivariate optimization, fruits, Brazil
Introduction
Brazil is one of the main food producers and exporters in the world.1 The South Brazilian region for instance,
constitutes a great hortifruticulture center, being the state of Santa Catarina a leader in applecropping.2 Nevertheless,
the great production of fruits and vegetables is strongly related to the excessive use of pesticide. According to data from Brazilian National Monitoring Program for
Pesticide Residues in Food,3 pesticides such as chlorpyrifos,
dimethoate, malathion and mevinphos are frequently used in fruit and vegetable growing, without necessarily being authorized for use in some cultures. Furthermore, residues of some other non-recommended and restricted use pesticides can also be found in these foods from indirect sources, such as adjacent crops, soil, and irrigation waters.4-6
The QuEChERS (Quick, Easy, Cheap, Effective, Rugged and Safe) method, developed originally by Anastassiades et al.,8 has been used for extraction of
pesticide residue in a wide range of foods and other agricultural products.9,10 Characteristics such as low
consumption of reagents, generation of small amounts of waste, simplicity of the operations, low cost of analysis, and efficient removal of matrix components and high recoveries of the analysed compounds, are responsible for the popularity of this method. 10-14
Despite of all the advantages, important variables that help increasing the efficiency of extraction can still be enhanced in QuEChERS, including: sample quantity, solvent volume, pH and temperature of extraction. In the original method, the ratio of sample quantity/ solvent volume (1:1) result in a low pre-concentration of compounds in the extracts, and can lead to higher detection limits, i.e., lower sensitivity. According to some researchers this ratio is the principal disadvantage of the QuEChERS compared to other extraction methods.15-17 In addition, the
pH and temperature effects on the recovery of pesticides, especially those sensitive to basic pH and thermolabile, must also be considered.18-20 The optimization of such
variables is necessary for improving the method sensitivity by increasing detection and recovery levels.
Va r i o u s a n a l y t i c a l m e t h o d s i n c l u d i n g g a s chromatography (GC) and liquid chromatography (LC) coupled with various detectors have been developed for the determination of pesticides.21 The most frequently used
technique is gas chromatography (GC) especially coupled with electron capture detector (ECD), nitrogen phosphorus detector (NPD), flame photometric detector (FPD) and mass spectrometry (MS).15,21 Among them, ECD is commonly
used for the determination of organochlorine and pyrethroid pesticides, however research using this detector for multiresidue determinations show excellent results. In the literature variations of the QuEChERS method using GC-CD analysis are described for different pesticides residues in foods,22-25 including apples, strawberries and
tomatoes.26,27 These studies, the ratio of sample quantity/
solvent volume was not modified.
Univariate methods of optimization neglect the interaction between the variables, therefore the obtained results do not necessarily correspond to the conditions which lead to the perfect optimum. In chemical systems, the variables are often strongly correlated, interacting through mechanisms which provide synergistic and antagonistic effects. If such fact is ignored, the optimization process has little value.28,29 The multivariate optimization includes
factorial designs and response surface methods, which are used to evaluate the main and interactive effects of variables
in relation to analytical response.30 Furthermore, it reduces
the number of necessary experiments to provide sufficient information for statistically acceptable results.31
In the present study, a multivariate optimization of the QuEChERS method coupled to GC-ECD was proposed to evaluate important variables of the extraction process and investigate the levels of pesticides residues of chlorpyriphos, dimethoate, malathion, mevinphos, pedimenthalin, simazine and trifluralin in apples, strawberries and tomatoes grown and commercialized in the State of Santa Catarina, South Brazil. A multivariate optimization process was used, followed by validation of the modified methodology and application in real samples.
Materials and Methods
Sample
Apples, strawberries, and tomatoes were weekly collected between September 2010 and April 2011, at the Supply Center of Santa Catarina State (CEASA), Brazil. The collections were made randomly, without preference of size, type or color. A minimum of 1 kg of each sample was collected per collection day.32 The samples were
packed into sealed plastic sacks, transported to the laboratory and immediately conditioned at −18 ± 2 °C until the analysis.
Samples with no pesticide residues were purchased at local organic products shop and used for the optimization and validation assay. Analyzes were carried out to confirmation of the absence of pesticides in such samples (data not shown).
Reagents and standards
Water was purified through a Milli-Q system from Millipore®. Anhydrous magnesium sulphate p.a. and sodium
chloride p.a. were purchased from Vetec (Rio de Janeiro, RJ, Brazil). The PSA (primary and secondary amine) sorbent was obtained from Varian (Varian, Harbor City, CA). Glacial acetic acid p.a. and solvents acetonitrile, toluene and methanol, all high performance liquid chromatography grades were purchased from Merck (Darmstadt, Germany).
The pesticide analytical standards of chlorpyriphos, dimethoate, malathion, mevinphos, pendimethalin, simazine and trifluralin, all whit purity higher than 98.0%, were obtained from Sigma-Aldrich (Saint Louis, MO, EUA), as well as Tris (1,3-dichloro-2-propyl) phosphate (TDCPP) used internal standard. Individual pesticide stock solutions (100 mg L-1) were prepared in toluene.
Intermediate solutions (10 mg L-1) of each pesticide
in methanol. Two mixed work solutions were prepared, one by the mixture of intermediate standard solutions of chlorpyriphos, dimethoate, malathion, and mevinfos (Mix 1), and the other by mixture of pendimethalin, simazine and trifluralin (Mix 2). The pesticides were grouped in each mix according to their physicochemical properties. Such solutions were diluted successively in methanol and added into varied concentrations in samples submitted to tests of optimization and validation. All solutions were stored in amber bottles and kept at −18 ± 2 °C, protected from light.
Instrumentation
The analysis were carried out in a gas chromatograph CP-3800 (Varian, USA) equipped with electron capture detector (ECD). The capillary column used was CP SIL 8CB (50 m × 0.53 mm, 5.0 µm film thickness) (Varian, USA). The injections were carried out manually in splitless mode with the injector at 220 °C. Nitrogen (99.999%) was used as the carried gas at a flow rate of 1 mL min-1 at
the initial temperature of column oven.The temperature program of the chromatographic column used was: 90 °C (1 min), heating 30 °C min-1 up to 210 °C (6 min), and
5 °C min-1 up to 250 °C (2 min); with analysis time of
25 min. The detector temperature was 300 °C. The data were obtained using the software Star Chromatography Workstation 6.2 version.
Extraction process - QuEChERS method
Samples of apple, strawberry and tomato were homogenized individually in a commercial blender. For each sample, a portion of 18 g was weighed into a 50 mL centrifuge tube (Sarstedt AG. & Co., Germany). The internal standard was then added at 500 µg kg-1
concentration. Samples destined for optimization and validation assay were fortified with work mix solutions. These were carefully mixed and left at rest for at least 30 min before the extraction. A 10 mL volume of acetonitrile was added as extraction solvent and the pH was adjusted to 5 with acetic acid. The tube was tightly capped and shaken vigorously by vortex for 1 min. Then, 1 g of sodium chloride and 4 g of magnesium sulphate anhydrous were added and the mixture was immediately shaken for further 1 min. The extract was centrifuged at 5000 rpm for 3 min and 10 ºC. After centrifugation, 1 mL of supernatant was transferred to another centrifuge tube (Eurotips Scientific) containing 50 mg of PSA and 300 mg of magnesium sulphate anhydrous. The tube was shaken in a vortex for 1 min and centrifuged again at 3000 rpm
for 5 min. The final extract was stored into glass vials at −18 ± 2 °C.
The parameters sample amount (18 g), solvent volume (10 mL), pH (5) and extraction temperature (10 ºC) were predetermined by optimization analyzes performed through multivariate experimental design, described in the Multivariate optimization section.
Multivariate optimization
Strawberry samples were used as matrix for the optimization of QuEChERS method. These were fortified with 500 µg kg-1 of the internal standard and work mix
solutions.
The optimization process was performed in two steps. In the first moment, the parameters sample amount, solvent volume, pH and extraction temperature were submitted to a full factorial design to evaluate which of those variables had significant effect on the efficiency of extraction of pesticide. The design was constructed based on a 24 factorial design
with 3 replications of the center point to estimate the experimental error, leading to 19 experiments, carried out in random order. The variables were evaluated at three levels, coded as −1, 0 and +1: sample amount (5, 10, and 15 g), solvent volume (5, 10, and 15 mL), pH (3, 5, and 7), and extraction temperature (5, 10, and 15 °C) (Table 1). Wide ranges of variation were adopted because it is a multiresidue methodology where pesticides with different properties will be extracted simultaneously.
Secondly, the parameters that were significant (indicated by a Pareto chart) were optimized by a response surface methodology through a Doehlert matrix. The variables evaluated in this case were sample amount at five levels (10, 15, 20, 25, and 30 g) and solvent volume at three levels (0, 5, and 10 mL). A total of 9 experiments were carried out, considering 3 repetitions of the central point, in order to allow the estimation of experimental variance.
One response for each pesticide was obtained in each chromatographic run (chromatographic peak area). The geometric mean of the peak areas for the seven pesticides was used as optimization response, in order to better express a unique set of optimum conditions for the extraction of all the analytes. The Statistica (version 6.0) software program was used for statistical evaluation of the data.
Validation of the method
as suggested by the European Commission SANCO NCCLS guideline 12495/2011.33 The linearity was analyzed
using concentrations of 0.1; 1.0; 10; 100; 250; 500; 750; 1000 µg kg-1, prepared in triplicate and randomly injected.
The calibration curves were plotted as the relative peak areas (pesticide versus internal standard) as a function of the concentration ratio (pesticide concentration versus internal standard concentration). The sensitivity was expressed in terms of limits of detection (LOD, concentration for signal/noise = 3) and quantification (LOQ, concentration for signal/noise = 10). The accuracy and precision were evaluated through recovery and repeatability tests, respectively. These were performed through of 5 replicates of the blank samples fortified with two different concentration levels of pesticides.
Results and Discussion
Identification of the most significant variables
A full factorial design was used to elucidate the significant effects and the interactions of the variables sample amount, solvent volume, pH and extraction temperature. The Pareto chart obtained (R2 = 0.94) is shown in Figure 1. The sample
amount and solvent volume were the variables of relevant effect, (+) 8.37 and (−) 5.83 respectively. These variables affect directly the geometric mean of peak areas for seven pesticides. As expected, the increase of sample amount and decrease of solvent volume can result in a greater extraction of studied pesticides.34 All other factors and their interactions
had small effects on response and low trust level (p < 0.05), not being considered significant.
Based on the results provided by Pareto chart, the significant variables were studied in a second step of the optimization process, through a Doehlert matrix. In such step, the pH and the temperature were fixed at 5 and 10 °C, respectively.
The pH value was defined according to the natural pH of the fruits and vegetables, variable between 3 and 5 for apple, strawberry and tomato.35 Therefore, it was not necessary to
add large quantities of acid or basic reagents. At the same time, it was considered the fact that pHs between 4 and 5 are recommended for optimal extraction of pesticides. This pH range provides superior recoveries to 70.0% for sensitive compounds in acid environment and ensures stability for those sensitive in the alkaline environment.18,36
The temperature was chosen to avoid the degradation of some pesticides more sensitive to heat, as recommended by the literature.20,37 This is because the centrifugation
mechanical process and the exothermic reaction caused by addition of MgSO4, can result in increase in a temperature
to about 45 °C, harming the extraction. 38,39
Doehlert design application
A Doehlert design was used to define the optimal values for variables, sample amount and solvent
Table 1. Two-level full factorial design for the screening of the significant variables
No. exp. Sample / g
Solvent /
mL pH
Temperature / °C
1 5.00 (−) 5.00 (−) 3.00 (−) 5.00 (−)
2 15.00 (+) 5.00 (−) 3.00 (−) 5.00 (−)
3 5.00 (−) 5.00 (−) 3.00 (−) 5.00 (−)
4 15.00 (+) 5.00 (−) 3.00 (−) 5.00 (−)
5 5.00 (−) 15.00 (+) 7.00 (+) 5.00 (−)
6 15.00 (+) 15.00 (+) 7.00 (+) 5.00 (−)
7 5.00 (−) 15.00 (+) 7.00 (+) 5.00 (−)
8 15.00 (+) 15.00 (+) 7.00 (+) 5.00 (−)
9 10.00 (0) 10.00 (0) 5.00 (0) 10.00 (0)
10 10.00 (0) 10.00 (0) 5.00 (0) 10.00 (0)
11 10.00 (0) 10.00 (0) 5.00 (0) 10.00 (0)
12 5.00 (−) 15.00 (+) 7.00 (+) 15.00 (+)
13 15.00 (+) 15.00 (+) 7.00 (+) 15.00 (+)
14 5.00 (−) 15.00 (+) 7.00 (+) 15.00 (+)
15 15.00 (+) 15.00 (+) 7.00 (+) 15.00 (+)
16 5.00 (−) 5.00 (−) 3.00 (−) 15.00 (+)
17 15.00 (+) 5.00 (−) 3.00 (−) 15.00 (+)
18 5.00 (−) 5.00 (−) 3.00 (−) 15.00 (+)
19 15.00 (+) 5.00 (−) 3.00 (−) 15.00 (+)
volume. Doehlert constitutes a uniform distribution of the experiments in a three-dimensional space. For two variables, the design consists of one central point and six additional points forming a regular hexagon situated on a circle.40,41 As variables levels depend on the design
geometry, one variable is studied in five levels while the other is studied in only three levels.41 Table 2 shows the
Doehlert’s matrix and the corresponding experimental and predicted responses.
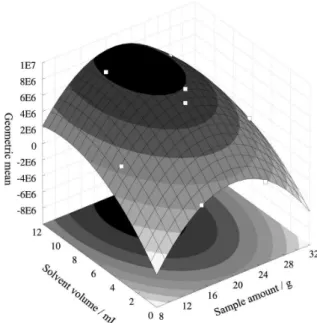
The predicted values for the geometric mean peak area are close to the experimental values demonstrating that the model is possibly applicable. The response surface shown in Figure 2 was built through the experimental responses. The model was governed by the equation:
R = −1.93.107 + 2.08.106 x – 51881.78 x2 + 1.80.106 y –
87817.89 y2 – 9071.97 xy,
where x and y are the sample amount and solvent volume, respectively, and Ris the geometric mean of the peak area for the seven pesticides.
Analysis of variance (ANOVA) was used to evaluate the quality of relation between the response and the significant variables, in order to obtain the optimum extraction conditions. The results showed that the model was significant (F = 0.14 and p < 0.05) and the lack-of-fit test (p > 0.05) indicated that the quadratic model was valid for this study. The same can be confirmed by the satisfactory determination coefficient obtained (R2 = 0.96), indicating
that even using a variable which is not significant in the model, the results obtained are reliable.
The model equation allowed the higher point to be calculated at 19.24 g sample and 9.29 mL solvent. However, in order to facilitate homogenization of samples in extraction
assays, the option was to use 18.00 g sample and 10.00 mL solvent, values that are still within the optimal region of the method (Figure 2). The extraction methodology was then defined as: 18.00 g sample, 10.00 mL solvent, pH 5.0, and temperature of 10 °C.
Analytical performance of the optimized method
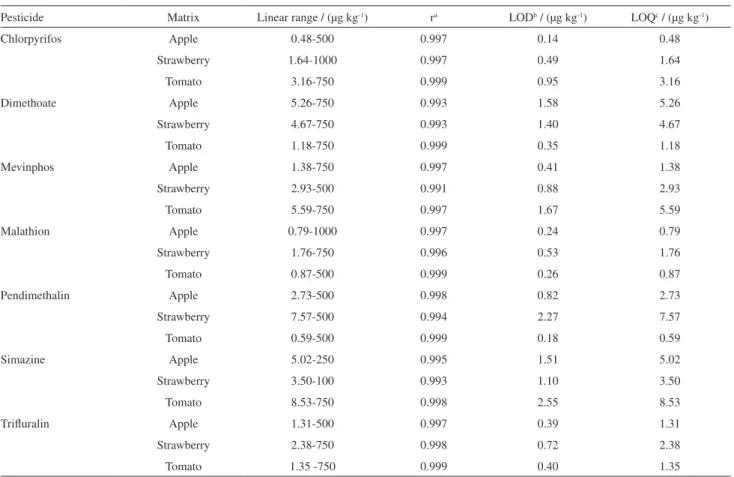
Good linearity range and satisfactory values of correlation coefficients (r) were obtained for all studied pesticides. According to Table 3, the pesticides showed correlation coefficients above than 0.99. The LOD and LOQ of the method reached values considerably lower than the maximum residue limits (MRL) established by the European Union42 and Brazilian Legislation.43
In addition, the LOD values were lower or similar to those reported in the literature,44-48 which depends on the
instrumentation and analytical conditions used. According to Diez et al.16 and Hiemsta et al.,34 for extraction methods
as the QuEChERS, an increase of sample/solvent relation leads to smaller LOD for the same extract volume injected into the chromatographic system, which explains the results obtained.
Recovery and repeatability studies were conducted after fortification of the samples in two concentration levels, between 5 µg kg-1 and 500 µg kg-1. According
to European Commission SANCO NCCLS guideline 12495/2011,33 recovery intervals between 70.0 and 120.0%
are considered acceptable for analysis of residues in food, with an repeatability of up to 20.0%.
Table 2. Doehlert’s matrix and the corresponding experimental and predicted responses
Factor Geometric mean peak area / %
Sample / g Solvent / g Experimental Predicted
1 0.00 (20) 0.00 (5) 8884449.9 7502326.6
2 1.00 (30) 0.00 (5) 2108887.6 1916743.5
3 0.50 (25) 0.86 (10) 7125494.9 7317638.9
4 −1.00 (10) 0.00 (5) 2519468.2 2711612.3
5 −0.50 (15) −0.86 (0) 440635.6 248491.5
6 0.50 (25) −0.86 (0) 112511.9 304656.0
7 −0.50 (15) 0.86 (10) 8360816.4 8168672.3
8 0.00 (20) 0.00 (5) 7164588.1 7502356.6
9 0.00 (20) 0.00 (5) 6458031.7 7502356.6
All spiked samples presented satisfactory recovery rates for the target pesticides, ranging from 70.5% to 119.4% (Table 4). Approximately 93.0% achieved recoveries were above 80.0%. These recoveries indicate good accuracy of the method.
In relation to the repeatability, the relative standard deviations (RSDs) ranged from 2.2% to 16.6%. More than 60.0% of pesticides had RSDs below 10.0%, which verifies the good precision of the method.
These results show broad agreement with data from other researchers who also developed and validated different versions of QuEChERS method, for the determination of pesticides chlorpyrifos, dimethoate, mevinphos, malathion, pedimentalina, simazine and trifluralin in different fruits and vegetables. Lu et al.49 modified and validated the
QuEChERS method for determination of 45 pesticides of different chemical families in samples of apple, spinach and cucumber. Lesueur et al.45 validated a method to analyze
105 pesticides for GC analysis and 46 for the HPLC analysis in tomato, lemon, grape and onion. Queiroz et al.48
also validated a version of QuEChERS method followed by UPLC – MS/MS for detection and quantification of 29 pesticides in tomato, lettuce, apple and grape samples.
The recovery results observed in the present study are similar or even higher than those validated methods, although they have used chromatographic techniques coupled to mass spectrometry. It should be emphasized that in those studies, the ratio sample quantity/solvent volume was not modified in validated methods. A specific evaluation of this parameter of the QuEChERS method was not found in the literature.
The QuEChERS provides several benefits compared to conventional extraction methods, such as simplicity of the steps, ease of execution and dynamism, which allow its affordable application/usage in pesticides analysis laboratories. The QuEChERS-GC-ECD method presented the same characteristics of the traditional method, but with greater sensitivity, accuracy and precision, which are important parameters for monitoring ever smaller levels of residues in food.
Application to real samples
The validated method was used for pesticides detection and quantification in apple, strawberry, and tomato real samples produced and commercialized in Santa Catarina
Table 3. Analytical parameters obtained for the optimized method: linear range, correlation coefficient (r), limit of detection (LOD), limit of quantification (LOQ)
Pesticide Matrix Linear range / (µg kg-1) ra LODb / (µg kg-1) LOQc / (µg kg-1)
Chlorpyrifos Apple 0.48-500 0.997 0.14 0.48
Strawberry 1.64-1000 0.997 0.49 1.64
Tomato 3.16-750 0.999 0.95 3.16
Dimethoate Apple 5.26-750 0.993 1.58 5.26
Strawberry 4.67-750 0.993 1.40 4.67
Tomato 1.18-750 0.999 0.35 1.18
Mevinphos Apple 1.38-750 0.997 0.41 1.38
Strawberry 2.93-500 0.991 0.88 2.93
Tomato 5.59-750 0.997 1.67 5.59
Malathion Apple 0.79-1000 0.997 0.24 0.79
Strawberry 1.76-750 0.996 0.53 1.76
Tomato 0.87-500 0.999 0.26 0.87
Pendimethalin Apple 2.73-500 0.998 0.82 2.73
Strawberry 7.57-500 0.994 2.27 7.57
Tomato 0.59-500 0.999 0.18 0.59
Simazine Apple 5.02-250 0.995 1.51 5.02
Strawberry 3.50-100 0.993 1.10 3.50
Tomato 8.53-750 0.998 2.55 8.53
Trifluralin Apple 1.31-500 0.997 0.39 1.31
Strawberry 2.38-750 0.998 0.72 2.38
State, South Brazil. A total of 91 samples were analyzed, considering 29 apples, 30 strawberries, and 32 tomatoes. Residue of at least one pesticide (≥ LOQ) was found in 8 (27.6%) apple samples, 12 (40.0%) strawberry samples, and 17 (53.1%) tomato samples. Except for the strawberries samples, most of the residue was below the MLRs stipulated by Brazilian Legislation.43 The irregular
samples (presence of non-authorized active ingredient or residue levels higher than the Brazilian MRL) represented 1 (12.5%), 10 (83.3%), and 6 (35.3%) of apple, strawberry and tomato positive samples, respectively.
Apples showed a lower number of residues. Only one sample presented residue (simazine) above the MRL (> 20 µg kg-1). Strawberries contained dimethoate,
pendimethalin, and trifluralin at levels ranging from 10.40-111.90 µg kg-1, none of them allowed in the country for
fruit cultivation use. For the tomato, mevinphos residues were found above the MRL (> 200 µg kg-1) in two samples.
Chlorpyrifos, pendimethalin, and simazine, non-authorized active ingredients for this crop, were quantified between 19.30-211.50 µg kg-1.
Most of the irregularities found for the fruits under study were related to the use of non-authorized active ingredient. This fact was also reported by Ciscato et al.50
In their study with Brazilian fruit export, 17.8% of the analyzed samples were contaminated by non-autorized active ingredients, while only 5.4% contained residue above
the MRL. Similarly, Jardim and Caldas (2012),51 based on
Brazilian monitoring programs, found that approximately 72.1% of the positive fruit and vegetable samples were irregular by the presence of non-allowed ingredients. These authors justify the data in part due to the diverse agricultural population profile in the country. In many cases, the decisions on which pesticide to use depend on the costs and availability of product in agricultural properties.52 Thus,
a farmer will probably use a pesticide which is registered for one certain culture also in other crops grown on the same property, regardless of its registration status.51
Surveys carried out in other countries showed similar contamination percentages to those reported here. In Colombia, for example, pesticide residues were detected above the MRLs in 53.9% and 27.6% of the open field and greenhouse tomato samples respectively, collected during the year 2011.53 In Bangladesh between 2009 and
2012 pesticide waste was detected in 53.4% of the total tomato samples collected.54 The analyzes of pesticides on
imported apples from South America to Denmark, Estonia, Finland, Norway, and Sweden, showed 73.0% of positive samples and 12.0% samples with residues above the MRL.55 Such results reflect the lack of efficient programs
of guidance and awareness of farmers regarding the correct use of pesticides, such as the correct dose application, the application procedures and the appropriate interval between harvesting and pesticide treatment.
Table 4. Recovery and repeatability of the method for three samples evaluated
Pesticide Concentration / (µg Kg-1)
Recovery / % Repeatability RSD / %a
Apple Strawberry Tomato Apple Strawberry Tomato
Chlorpyrifos 10 500 87.7 91.4 107.8 103.3 117.4 94.6 9.7 16.6 8.7 6.5 8.7 14.3 Dimethoate 10 500 70.5 94.9 110.3 89.8 103.2 92.6 8.9 14.6 7.9 8.3 12.2 6.0 Mevinphos 10 500 78.3 90.8 114.9 97.4 119.4 85.9 15.1 7.9 11.8 14.4 4.9 10.4 Malathion 10 500 105.6 93.1 113.2 93.5 98.1 91.1 9.5 5.0 2.2 9.6 15.0 9.4 Pendimethalin 10 500 102.0 95.4 107.4 91.0 101.4 84.8 11.4 9.7 8.5 3.3 8.1 8.5 Simazine 5 10 100 250 500 – 92.2 – 110.1 – 81.6 – 92.2 – – – 99.7 – – 119.4 – 14.6 – 12.7 – 11.3 – 3.4 – – – 12.3 – – 7.4 Trifluralin 5 10 250 500 – 89.0 – 89.1 113.1 – 71.9 – – 107.0 – 84.6 – 8.1 – 8.7 3.1 – 7.5 – – 7.3 – 15.1
Conclusions
The multivariated optimization of the QuEChERS method enabled the evaluation of important parameters that affect the extraction efficiency of pesticides in apple, strawberry and tomate samples. The changes applied to the methodology resulted in increased detectability and satisfactory values of linearity, accuracy and precision, when compared to other versions of QuEChERS. The analyses results performed in real samples have established the need for good preventive actions, such as orientation of the farmers and the continuous monitoring of the residues in fruit and vegetables produced in Southern Brazil.
Acknowledgements
The authors thank the Conselho Nacional de Pesquisa (CNPq, Processo 578456/2008-7) for the financial support and also to Laboratório Central de Saúde Pública de Santa Catarina (LACEN) by lending the equipment.
References
1. Brooks, J.; Food Policy 2014, 44, 88.
2. Zagati, F. G.; Braga, D.; Hortifruti Brasil 2013, 121, 1. 3. Agência Nacional de Vigilância Sanitária (ANVISA); Programa
de Análise de Resíduos de Agrotóxicos em Alimentos (PARA) -
Relatório de Atividades de 2011 e 2012, ANVISA: Brasil, 2013. 4. Sharma, D.; Nagpal, A.; Pakade, Y. B.; Katnoria, J. K.; Talanta
2010, 82, 1077.
5. Li, J.; Zhang, H.-F.; Shi, Y-P.; Food Chem. 2011, 127, 784. 6. Freitas, L. L.; Sant’Anna, E. S.; Benato, V. S.; Carasek, E.; Int.
J. Environ. Anal. Chem. 2012, 92, 313.
7. Carneiro, R. P.; Oliveira, F. A. S.; Madureira, F. D.; Silva, G.; de Souza, W. R.; Lopes, R. P.; Food Control 2013, 33, 413. 8. Anastassiades, M.; Maštovska, K.; Lehotay, S. J.; J. Chromatogr. A
2003, 1015, 163.
9. Furlani, R. P. Z.; Marcilio, K. M.; Lemea, F. M.; Tfouni, S. A. V.;
Food Chem. 2011, 126, 1283.
10. Cherta, L.; Beltran, J.; López, F.; Hernández, F.; Food Anal. Methods 2013, 6, 1170.
11. Surma, M. K.; Sadowska-Rociek, A. B.; Food Anal. Methods
2014, 7, 366.
12. Miao, Q.; Kong, W.; Yang, S.; Yang, M.; Chemosphere 2013,
91, 955.
13. Zhou, L.; Liu, X.; Kanga, S.; Zhanga, F.; Pana, C.; Food Chem. 2013, 138, 1355.
14. Lehotay, S. J.; Methods Mol. Biol. 2011, 747, 65. 15. Zhang, Y.; Zhang, X.; Jiao, B. Food Chem. 2014, 159, 367. 16. Díez, C.; Traag, W. A.; Zommer, P.; Marinero P.; Atienza, J.;
J. Chromatogr. A. 2006, 1131, 11.
17. Pinto, C. G.; Laespada, M. E.; Martin, S. H.; Ferreira, A. M.; Pavón, J. L.; Cordero, B. M.; Talanta 2010, 81, 385.
18. Prestes, O. D.; Friggi, C. A.; Adaime, M. B.; Zanella, R.; Quim. Nova 2009, 32, 1620.
19. Wilkowska, A.; Biziuk, M.; Food Chem. 2011, 125, 803. 20. González-Curbelo, M. A.; Herrera-Herrera, A. V.; Ravelo-Pérez,
L. M.; Hernández-Borges, J.; Trends Anal. Chem. 2012, 38, 32. 21. Miao, Q.; Kong, W.; Yang, S.; Yang, M.; Chemosphere 2013,
91, 955.
22. Correia-Sá, L.; Fernandes, V. C.; Calhau, C.; Domingues, V. F.; Delerue-Matos, C.; Food Anal. Methods 2013, 6, 587. 23. Jean, I.-S.; Kwak, B.-M.; Ahn, J.-H.; Jeong, S.-H.; Food Chem.
2012, 133, 473.
24. Selvi, C.; Paramasivam, M.; Rajathi, D. S.; Chandrasekaram, S.;
Bull Environ. Contam. Toxicol. 2012, 89, 1051.
25. Barakat, A. A.; Badawy, H. M. A.; Salama, E.; Attallah, E.; Maatook, G. J.; J. Food Agr. Environ. 2007, 5, 97.
26. Bakirci, G. T.; Acay, D. B. Y.; Bakirci, F.; Otles, S.; Food Chem.
2014, 160, 379.
27. Fernandes, V. C.; Domingues, V. F.; Mateus, N.; Delerue-Matos, C.; J. Agric. Food Chem. 2011, 59, 7582. 28. Peralta-Zamora, P. G.; Morais, J. L.; Nagata, N.; Eng. Sanit.
Ambient. 2005, 10, 106.
29. Casas, V.; Llompart, M.; Garcá-Jares, M.; Cela, R.; Dagnac, T.;
J. Chromatogr. A. 2006, 1124, 148.
30. Suchara, E. A.; Budziak, D.; Martendal, E.; Costa, L. L. F.; Carasek, E.; Anal. Chim. Acta 2008, 613, 169.
31. Tarley, C. R. T.; Silveira, G.; dos Santos, W. N. L.; Matos, G. D.; da Silva, E. G. P.; Bezerra, M. A. B.; Miro, M.; Ferreira, S. L. C.; Microchem. J. 2009, 92, 58.
32. Codex Alimentarius; Methods of Analysis and Sampling, Pesticides Residues in Food, 2nd edition, volume 2A, Part 1, 2000.
33. European Commission; Method Validation and Quality Control Procedures for Pesticide Residues Analysis in Food and Feed,
Document SANCO/12495/2011, National Food Administration: Sweden, 2011.
34. Hiemsta, M.; Kok, A.; J.Chromatogr. A 2007, 1154, 3. 35. U.S. Food and Drug Administration, http://www.fda.gov/Food/
FoodScienceResearch/LaboratoryMethods/ucm109398.htm, accessed in June 2014.
36. Lehotay, S. J.; Maštovská, K.; Lightfield, A. R.; J. AOAC Int.
2005, 88, 615.
37. Fenik, J.; Tankiewicz, M.; Biziuk, M.; Trends Anal. Chem. 2011,
30, 814.
38. Nguyen, T. D.; Lee, B. S.; Lee, B. R.; Lee, D. M.; Lee, G.-H.;
Rapid Commun Mass Spectrom. 2007, 21, 3115.
39. Geis-Asteggiante, L.; Lehotay, S. J.; Heinzen, H.; J. AOAC Int. 2012, 95, 1311.
41. Ferreira, S. L. C.; dos Santos, W. N. L.; Quintella, C. M.; Neto, B. B.; Bosque-Sendra, J. M.; Talanta 2004, 63, 1061. 42. European Commission Decision 2005/396/EC; Off. J. Eur.
Comm. 2005, L70.
43. Agência Nacional de Vigilância Sanitária (ANVISA);
Monografias Autorizadas de Agrotóxicos, ANVISA: Brasil,
2012.
44. Húšková, R.; Matisová, E.; Kirchner, M.; J. Chrom. Suppl. 2008,
68, 49.
45. Lesueur, C.; Knittl, P.; Gartner, M.; Mentler, A.; Fuerhacker, M.;
Food Control 2008, 19, 906.
46. Koesukwiwat, U.; Lehotay, S. J.; Miao, S.; Leepipatpiboon, N.;
J. Chromatogr. A 2010, 1217, 6692.
47. Cherta, L.; Beltran, J.; López, F.; Hernández, F.; Food Anal. Methods 2013, 6, 1170.
48. Queiroz, S. C. N.; Ferracini, V. L.; Rosa, M. A.; Quim. Nova
2012, 35, 185.
49. Lu, D.; Qiu, X.; Feng, C.; Jin, Y.; Lin, Y.; Xiong, L.; Wen, Y.; Wang, D.; Wang, G.; J. Chromatogr. B 2012, 17, 895. 50. Ciscato, C. H. P.; Gebara, A. B.; Monteiro, S. H.; Food Addit.
Contam.,Part B 2009, 2, 140.
51. Jardim, A. N. O.; Caldas, E. D.; Food Control 2012, 25, 607. 52. Recena, M. C. P.; Caldas, E. D.; Pires, D. X.; Pontes, E. R. J. C.;
Environ. Res. 2006, 102, 230.
53. Bojacá, C. R.; Arias, L. A.; Ahumada, D. A.; Casilimas, H. A.; Schrevens, E.; Food Control 2013, 30, 400.
54. Chowdhury, A. Z.; Fakhuddin, A. N. M.; Islam, N.; Moniruzzaman, M.; Gan, S. H.; Alam, K.; Food Control 2013,
34, 457.
55. Hjorth, K.; Johansen, K.; Holen, B.; Andersson, A.; Christensen, H. B.; Siivinen, K.; Toome, M.; Food Control 2011, 22, 1701.
Submitted: November 4, 2013