http://dx.doi.org/10.1590/S1982-217020130004000013
PROJECTION ANALYSIS FOR CADASTRAL MAPPING
Analise da projeção para mapeamento cadastral
GOPIKRISHNAN.T 1 RAMAKRISHNAN.S.S 2
1
Assistant Professor, AMS College of Engineering, Muthapudupet, Chennai – 600055
2
Professor, Institute of Remote Sensing, Anna University, Chennai – 600 025 E-mail: [email protected]
ABSTRACT
Maps are created for different purposes. Among the various types of maps, cadastral maps are created by cadastral surveying. Cadastral maps are used for management of land and land-related activities by Government organisations or other institutions in various countries. Cadastral map making is both an art and a science, and the data about a surveyed land parcel are collected and incorporated in cadastral maps. Technological development has resulted in the development of simple methods for cadastral mapping. The Indian cadastral system for the state of Tamil Nadu is described in this paper. The challenges of conversion while scanning conventional paper-based land records to make digital records are explained. The procedure for selecting an appropriate projection system for scanned digital conventional records is elaborated on. A statistical application for identifying the nature of the data is shown. An inverse ranking system is used to identify a suitable projection system. Projection research is important in cadastral mapping when digitally processing a large number of land records in a country. The described method is effective for identification of a suitable projection system.
Keywords: Cadastre; Conventional and Modern Survey; Projections.
RESUMO
estudados e incorporados aos mapas cadastrais. O desenvolvimento tecnológico facilitou as maneiras de produzir mapas cadastrais. O sitema cadastral da India, no estado Tamil Nadu, é apresentado nesta pesquisa. Os desafios da conversão digital a partir de documentos convencionais baseados em dados do terreno para dados digitais são trabalhados. Os desafios da conversao de documentos analógicos de registro da terra para dados digitais são explicados. Apresenta-se o procedimento para selecionar um sistema de projeção adequado a partir dos dados dos registros escanerizados. Foi realizada uma análise estatística para identificar a natureza dos dados, bem como um sistema de classificação para identificar a projeção mais adequada. A pesquisa sobre a projeção cartográfica é importante quando se realiza o processamento digital de um grande numero de registros de terra em um determinado pais. O método descrito é efetivo na identificação de uma sistema de projeçao.
Palavras-chave: Cadastro; Levantamento Moderno e Convencional; Projeções.
1. INTRODUCTION
Maps demonstrate the development of civilisation in the world. There are many types of information that can be obtained from a map. Types of maps include road maps, rail network maps, air route maps, town maps, city maps, district maps, state maps and maps of various countries. A map is a pictorial representation of a large area in small scale. Among various types of maps, cadastral maps are created by cadastral surveying. Cadastral maps are used for land management-related activities in many countries because they show land details. Proper land management is important because poor land management leads to encroachments (KRISHNAN and RAMAKRISHNAN, 2012). Management and maintenance of land are based on land records and land management laws.
Land management laws in many countries use the categories classified by Sir Robert Richard Torrens. The Torrens classification system includes both positive and negative modes. A positive mode allows a person to claim ownership of land that he or she owns. The negative mode allows a person to pay taxes to the government, but he or she cannot claim ownership of the land. Vacant site taxes, building taxes, farming taxes and agricultural taxes may be collected from citizens of the country. Taxes are collected based on the cadastral information available to government organisation via cadastral maps (EASSIE et al, 2004).
The Earth’s surface is assumed to be approximately a spheroid or ellipsoid. The shape of earth is important for studying earth and the astronomical or celestial bodies around it. The shape of the Earth affects cadastral mapping on a large scale. Cadastral mapping with a chain survey considers the Earth to be flat. If a chain surveyed area is larger than 250 square kilometres, the curvature of the Earth should be considered for calculating areas and determining land dimensions, as recommended by American Survey Institute (KANETKAR, 1994).
If a curved Earth surface is considered for cadastral mapping, the map will have to have distortions. Distortion possibilities for a map include shapes, areas, distances and directions. Distortions can be minimised based on the map requirements. However, limiting area distortions is vital for cadastral mapping.
Cadastral mapping and surveying was started during the period when the British ruled in India. Cadastral maps from the British period are in use today as base maps. A cadastral survey is conducted by chain surveying. A chain survey is performed using the Diagonal and Offset method. Cadastral maps created using a chain survey should be projected using mapping software for analysis. Chain survey-created cadastral maps are called conventional cadastral maps or conventional land records.
This paper describes a method for selecting suitable or appropriate projections for conventional cadastral maps. Detailed explanations of conventional land records with suitable diagrams are provided.
2. CONVENTIONAL LAND RECORDS
Conventional land records are paper based and created by the Diagonal and Offset method (KANETKAR, 1994). The method has been used since the period of British rule in India. The method was found to be reliable and precise at the time. The Diagonal and Offset method using chain survey is still used for land surveying. Land parcels in a village are grouped together as five acres of wet land parcels and ten acres of dry land parcels. Grouped wet land and dry land parcels are then used to form condoms irrespective of ownership of those parcels. A village will have more than two condoms. The condom boundaries will be set by use of a 20” theodolite for angular measurement and a chain survey for linear boundary measurement.
Condoms are divided on the basis of land parcels with survey numbers unique for every village. Divided land parcels are surveyed by the Diagonal and Offset method using a chain and a cross staff. The Diagonal and Offset method is shown in Figure 1. Diagonal lines passing through the entire length of a parcel are selected and named as base lines. Perpendicular offsets are formed at right angles to the base lines. Perpendicular offsets connect straight parcel boundary edges from the base lines and are marked using a wooden cross staff.
the individual areas. The area of a land parcel is then plotted on paper, with the Parcel based land records compiled as field measurement books. Individual parcel land records are plotted together as village maps with physical markings on the land shown by village boundary stones. The boundary stones of individual parcels do not have carvings on their top surfaces.
Figure 1 Showing Diagonal and Offset method.
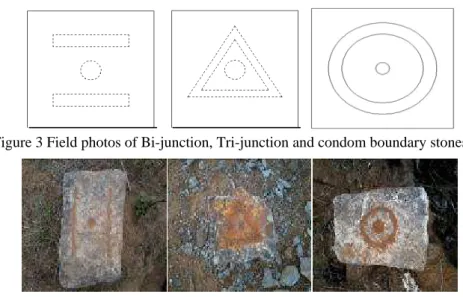
The boundaries of a village will be marked with village boundary stones. The village boundary stones will be accompanied by condom boundary stones and parcel boundary stones. There will be different carvings on top of village and condom boundary stones. Village boundary stones will be shared by adjacent villages and will have demarcations showing if the boundary is a Bi-Junction or a Tri-Junction. If the village boundary is shared by two villages then the boundary is indicated by a Bi-Junction stones, while a boundary or point shared by three villages is shown by a Tri-Junction stone.
Figure 2 Bi-junction, Tri-junction and condom boundary stones.
Figure 3 Field photos of Bi-junction, Tri-junction and condom boundary stones.
2.1 Conventional Survey Error Allowance
Conventional survey error allowances were started during the British rule in India. At present, the rules are being amended for the Survey and Land Records Department of Tamil Nadu. The allowances for surveying using metric chains by the Diagonal and Offset method are one link for one chain measurement i.e., ±1/100th unit of chain. The value of one link in a 20 m chain is 20 cm. Standard chain lengths according to Indian standards are 5 m, 10 m, 20 m, and 30 m, so the link size varies with respect to different chains. Area measurements can have variations of ±5% by use of chain surveys using the Diagonal and Offset method. Chain surveyed land records have been found to conflict with the Total Station surveyed land record of the same land parcel.
Conflicts of linear boundary distances and areas can be readily identified in records. However, the Total Station surveyed land record is then assumed to be accurate. The Total Station survey for a selected village is used to aid in the selection of a suitable projection. A suitable projection is selected by comparing areas from land parcels surveyed by conventional means and the Total Station surveyed land records from the same village. The selection of a suitable projection is performed using an inverse ranking system and statistical analysis as explained below.
3. METHODOLOGY
minimal adjustment and errors. The selection of a suitable projection system involves a pilot study of a village. Based on the results of the pilot study, conclusions about a suitable land record projection system can be reached. The first steps toward determining a suitable land record projection system is to collect land records or cadastral maps.
Paper-based land records or cadastral maps are collected for villages in Ambattur taluk from the Tamil Nadu Survey and Land Records Department. The Ambattur taluk map is used to select one village based on topography that is similar to other villages. The villages with a large number of undulations, such as hillocks and hills, are avoided because the land records of those villages are difficult to match in an orthographic view. Because distance measurements in land records or cadastral maps will include surface slope lengths, we need the orthographic distance for mapping. Cadastral maps or land records show village boundary stone locations.
Village boundary stones are identified in the pilot study village. Stones that are open to the sky or have fewer obstructions are selected. Selected village boundary stones are used for a global positioning system survey. A global positioning system survey provides latitude and longitude. Latitude and longitude are then converted to projected coordinate system coordinates. The projected coordinate system provides coordinates for the Total Station survey. The Total Station survey uses coordinates expressed in metres or feet. Coordinates for the Total Station survey are obtained from the village boundary stones that are used for the global positioning system survey.
The locations of village boundary stones where the global positioning system survey is carried out are utilised as the main stations for the Total Station survey. The main stations of the Total Station survey are used for surveying individual plots in the pilot study village. The Total Station survey is coordinate based, with the production of east and north coordinates. The coordinates are also called local coordinates, which are based on latitude and longitude. The local coordinate database is created and plotted using Auto-Cad software. The coordinate data base is used to create a map of the pilot study village. The pilot study village area obtained by Total Station surveying is assumed to be accurate or the true area of the land parcels. Total Station surveys have errors that are negligible compared to the Chain surveyed land records. The chain surveyed land records of the pilot study village are compared with the Total Station survey map of the pilot study village.
Cylindrical Equal Area (WGS-1984). The Everest 1880 IV is based on the Everest Projection, while WGS 1984-44N is based on an ellipsoid where 44N indicates the zone in which Tamil Nadu lies, The Albers Equal Area South Asia Conic is based on a conic projection for South Asia, the Cylindrical Equal Area is based on a cylindrical projection based on spheroid and the Cylindrical equal area (WGS-1984) is based on a cylindrical projection based on the ellipsoid WGS 1984.
The purpose of using five different projections other than a cartographic projection is that there is no specific projection created for cadastral and cartographic application based on conformal standards. The projections employed in this research that are equivalent to conformal are WGS 1984 -44N and the Albers Equal Area South Asia Conic (SNYDER, 1987).
Five different projections are used to project digitised land parcels, which results in different areas for given polygons in different projections. The area obtained by a Total Station survey of the pilot study village and the areas obtained in different projections of the pilot study village is compared. The projection that results in an area with the smallest error is identified as suitable. A suitable projection system is finally selected by an inverse ranking method and statistical analysis.
The inverse ranking method entails assigning values from one to five to the projections based on the ascending order of accuracy. The projection with the least error when compared with the Total Station survey area is assigned a value of one. The projection with the next smallest error when compared with the Total Station survey area is assigned a value of two and so on. By inverse ranking, the projection with lowest rank total has the least error when compared to other projections. The projection that was found to be most suitable according to the inverse ranking method was the Cylindrical Equal Area, which is based on a spheroid. The inverse ranking method is shown in Table 1. The areas of the individual parcels that were used for the inverse ranking are subjected to statistical analysis.
Table 1 - Inverse rank to projections based on area. Parcel ID 44N 80 AEAC CEA CEA84
1 4 5 2 1 3
2 4 5 2 1 3
3 2 1 3 5 4
4 3 4 2 1 2
5 4 5 2 1 2
6 4 5 2 1 3
7 1 3 2 4 2
8 3 4 2 1 2
9 4 5 3 1 2
10 4 1 2 5 3
11 4 5 3 1 3
12 3 4 2 1 2
13 2 1 3 4 3
15 4 5 3 1 2
16 2 1 3 5 4
17 2 1 3 5 4
18 2 1 4 5 3
19 2 1 4 5 3
20 2 1 3 5 4
21 4 5 2 1 3
22 4 5 2 1 3
23 3 4 2 1 2
24 2 1 4 5 3
25 4 5 2 1 3
26 2 1 4 5 3
27 4 5 3 1 2
28 4 5 3 1 2
29 4 5 2 1 3
30 3 4 2 1 2
31 2 1 3 5 4
32 4 5 3 1 2
33 4 5 2 1 3
34 2 1 3 4 3
35 1 2 4 5 3
36 2 1 3 5 4
37 4 5 2 1 3
38 2 1 3 5 4
39 2 1 3 4 3
40 2 1 3 4 3
41 4 5 2 1 3
42 2 1 3 5 4
43 4 5 2 1 3
44 3 4 2 1 2
45 2 1 3 5 4
46 4 5 2 1 3
47 2 1 4 5 3
48 2 1 4 5 3
49 2 1 4 5 3
50 2 1 4 5 3
51 4 5 2 1 3
52 4 5 2 1 3
53 4 5 3 1 2
54 2 1 3 5 4
55 4 5 3 1 2
56 4 5 3 1 2
57 2 1 4 5 3
58 4 5 2 1 3
59 2 1 4 5 3
60 4 5 3 1 2
62 4 5 2 1 3
SUM OF
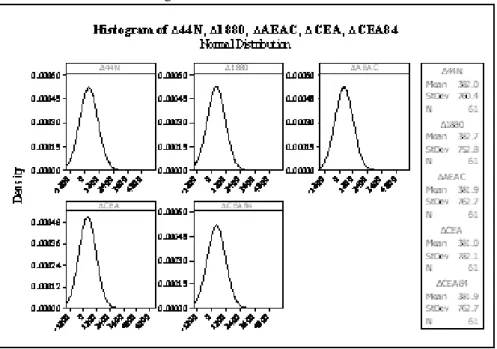
The area difference in all projections are analysed with Minitab version_16. The software’s graph option gives statistical parameters such as the distribution of area differences, the means and the standard deviations. The statistical analysis and results are shown in the Figure 4.
Figure 4 - Statistical nature of data used.
Statistics are applied to determine the nature of data used for analysis. Figure 18 shows that all data are normally distributed. The normal distribution shows that the data can be used for statistical analysis. Statistical analysis derives a relationship between a conventional chain survey and a Total Station survey. Statistical analysis helps in expanding further research based on a suitable projection.
Figure 5 - Work flow diagram.
3.1 India
and Lakshadweep. India has 28 states and 7 union territories. The government is elected by voting by individual Indian citizens that are 18 years and above. An election is conducted once every five years for the selection of the Prime Minister of the country and the Chief Ministers of the states and Union territories. The country is administered by the Prime Minister and the ministers of the respective departments. States are administered by Chief Ministers and the ministers of the respective departments. Union territories are administered similar to states. Cadastre is administered by state governments.
The Cadastral concept was developed in India by British colonisers to aid in the collection of taxes that were imposed on property. The Cadastral System is based on the concept of cadastre. Cadastre is the collection of parcel based information to form one single record of estimated area with current information. Cadastral surveying gained importance due to the fact that it contained information of ownership and topographical features such as parcel boundaries, length, and the extent of the land.
Land as part of dynamic developmental activities is subjected to various changes. Changes in land are recorded in land records. Land records are important, and land surveying became important in developing countries. Land is surveyed as parcels. The basic unit of land in India is a land parcel. Parcels are nothing but a piece of land owned by individuals or an organisation. Details of land are recorded in the cadastral record. Maintenance of cadastral records with ownership, tax assessment, and collection of tax are carried out by officers appointed by the state government. The states of India have cadastral records concerning individual parcels. Individual parcels in town surveys are grouped in blocks. The individual parcels are grouped as village maps in rural areas.
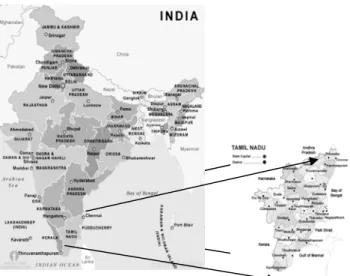
Village maps are prepared to scales of 1 in 5000, 1 in 25,000 for states, and 1 in 50,000 for the country. The unit used for mapping is metres. Figure 6 shows India along with an inset image of the state of Tamil Nadu. On the request of the state and central government, organisations will prepare maps on required scales. Maps are computerised as a part of the land record modernisation programme. Modernisation of land surveys is also carried out. Modernisation resulted in the development of a National Spatial Data Infrastructure. The National Spatial Data Infrastructure is being developed in India to implement efficient use of land and resources. The National Spatial Data Infrastructure is formed based on the cadastral information available in the country.
Figure 6 - India and State Tamil Nadu.
Figure 7 - State Tamil Nadu and Thiruvallur District.
3.1.1 Study Area
a l c A d g
approximate a lower left co coordinates of Ambattur talu developed by growth.
Figure
area of the stu oordinates of f 80˚12’23”E uk was chosen
industrialisat
Figure 8 - T
e 9 - Ambattu
udy area is 4 f 80˚01’03”E
and 13˚13’28 n for this res tion, suburban
Thiruvallur D
ur Taluk admin
9 square kilo E and 13˚0’5 8”N, and is sh search due to n rail ways, e
District and Am
nistrative boun
metres. The s 56”N, and a hown in Figur
its rapid gro expressways a
mbattur Taluk
ndary with 46
study area lie at the right
Figure 10 - Avadi and Ambattur railway stations.
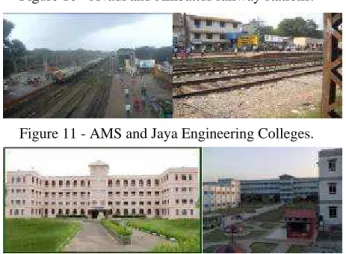
Figure 11 - AMS and Jaya Engineering Colleges.
Figure 12 - Sri Krishna and VelTech Engineering Colleges.
Figure 13 - Avadi and Ambattur Municipality Offices.
Figure 15 - Sewage treatment plant and Dunlop tyre factory.
Figure 16 - Four-lane Express way.
The face of Ambattur Taluk changes dynamically every day. Land in Ambattur taluk requires rapid management and maintenance due to selling, buying and transactions like renting, pledging land for loans against property, etc. Field photographs, which are shown in Figures 10 to 16, demonstrate the need for selection of an appropriate projection system. The software and survey technologies that were used to select a suitable projection system are elaborated on below.
3.2 Materials Used
Software Minitab16, ARC GIS 9.3, Leica Geo-office, and Auto Cad 2007 are employed in this research. Minitab 16 is a statistical software package that is used to analyse numerical data. ARC GIS 9.3 is geographical information software that is used for advanced mapping. The software is capable of storing data in different layers and acts as a decision support tool. (MAPLES, 2013). Leica Geo-Office is Global Positioning System (GPS) software that is used for processing data from GPS. Auto Cad 2007 is drafting software that is used for mapping coordinates from Total Station in this research.
4. RESULTS
Results show that the methodology adapted in this research provides good solutions. The solutions help us to find a suitable projection for projecting conventional village maps with minimal distortion. The data used to arrive at the solutions are analysed using statistical tools. Those tools helped us to determine the behaviour of data used for identifying projections. The most suitable projection for handling a conventional village map is the Cylindrical Equal Area, which is based on a spheroid. The projection projects a conventional village map within a chain survey error allowance. The area allowance for the error ±5% is not violated by land parcels after projecting with a suitable projection. The objective of finding a suitable projection is achieved. Proper modernisation of land records could be carried out with a suitable projection. Further research regarding projections can be carried out based on new results.
5. CONCLUSION AND DISSCUSSION
A number of studies regarding projections and mapping have been conducted. This paper is one of them and had the goal of finding a suitable projection. Projections for conventional chain surveys created land records whit minimal errors were found. This paper is a step towards future digital land records, which are obtained from digital error adjustment of conventional land records. Digital adjustment techniques are to be developed in India. India is a developing country where the infrastructure needs must be met rapidly to allow infrastructure growth. Infrastructure growth needs land. The need for land and the global rise in the real estate industry is affecting India’s real estate industry. Land costs have risen significantly, resulting in large bills for land transactions. Therefore, land needs to be maintained and managed efficaciously. The method used in this paper proves to be a successful tool for selecting a map projection. The map projection will be suitable for projecting conventional village maps.
REFERENCES
BAUER KURT W.; Fellow. Creation of Land Information System for Milwaukee County, Wisconsin. Journal of Surveying Engineering, Vol.120, No.4, 1994. EASSIE, MAHER GERARD, REID KENNETH GC, THOMPSON JOSEPH M,
TYRE COLIN J, Disscussion Paper on Land Registration: Void and Voidable Titles, Scottish Law Commission Disscussion Paper No. 125, February 2004. Kanetkar T. P., Surveying and Levelling, Vols. I and II, United Book Corporation
Pune, 1994.
KRISHNAN T. G.; RAMAKRISHNAN SS. Digital Cadastral Surveying for Land Encroachment Identification using Spatial Technologies. Geodetski list, Vol.66, No.2, 2012.
PRITHVISH NAG. Country Report 2003. 2003. Accessed 22.07.2013 http://www. cadastraltemplate.org/countryreport/India-25Mar2003.pdf
ROBERTS, C. GPS for cadastral surveying – practical considerations, Proceedings
of SSC 2005 Spatial Intelligence, Innovation and Praxis: The National Biennial
Conference of the Spatial Sciences Institute, September 2005. Spatial Sciences Institute, Melbourne.
SNYDER JOHN P. Map Projections-A Working Manual. Supersedes USGS
Bulletin 1532, United States Government Printing Office, 1987. Washington.
Tae-suc; Kang. Cadastre Survey, Hyungseul Publication, pp. 229 -243, 1994.